Full-stack Observability With
AI SRE Agent
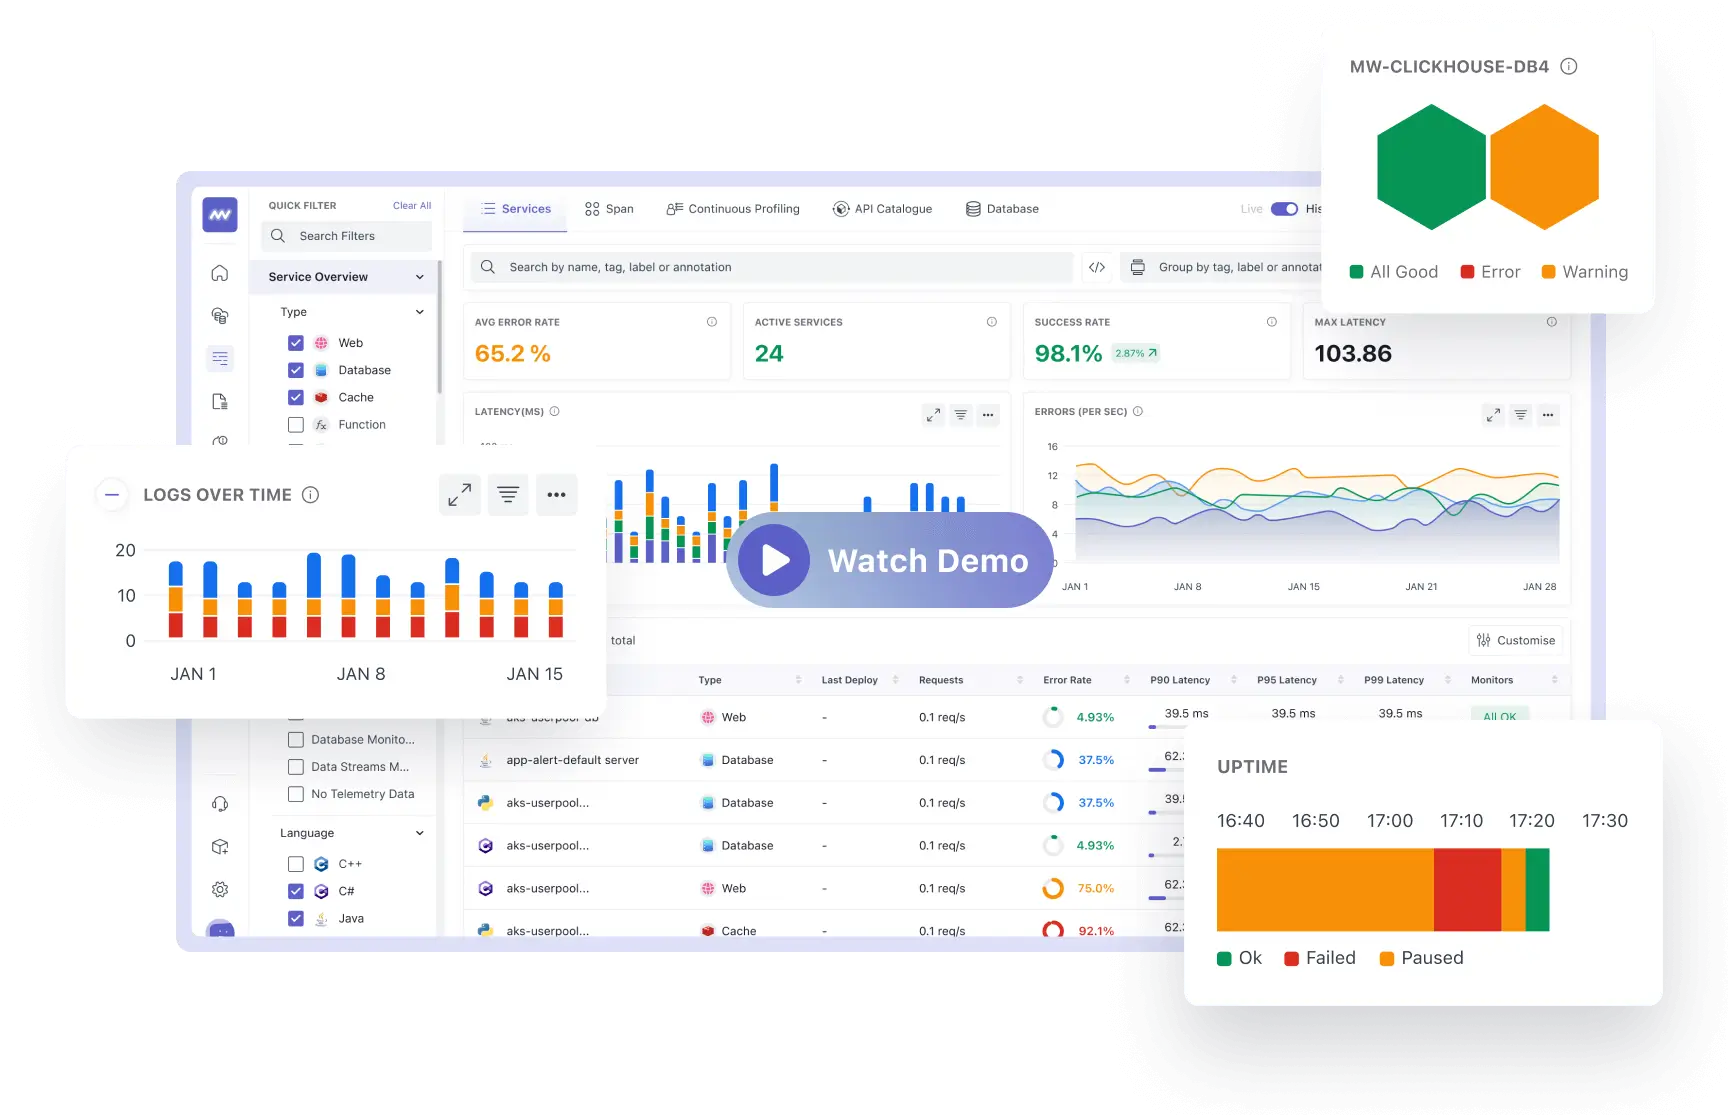
Middleware is a full-stack observability platform that detects issues from infra, APM, RUM and resolves them using the AI SRE Agent.
Testimonials 👤
Why Organizations Trust Middleware
Middleware reduced the time spent debugging and resolving issues by nearly 90%.
What sets their AI apart is that it does not stop at detecting issues. It actually helps fix problems in production, and for engineering teams, that's been a real game changer. At Corgi, we rely on Middleware to monitor our entire infrastructure and application stack.