We’re thrilled to announce our latest updates, designed to simplify alerting, boost performance, and expand integrations.
What’s New?
- GitHub Integration.
- Better Alerting Experience.
- Metrics Explorer.
- Journald Integration.
- Service Monitoring in Prometheus integration.
- Added over 50+ integrations in GCP, AWS, and Azure.
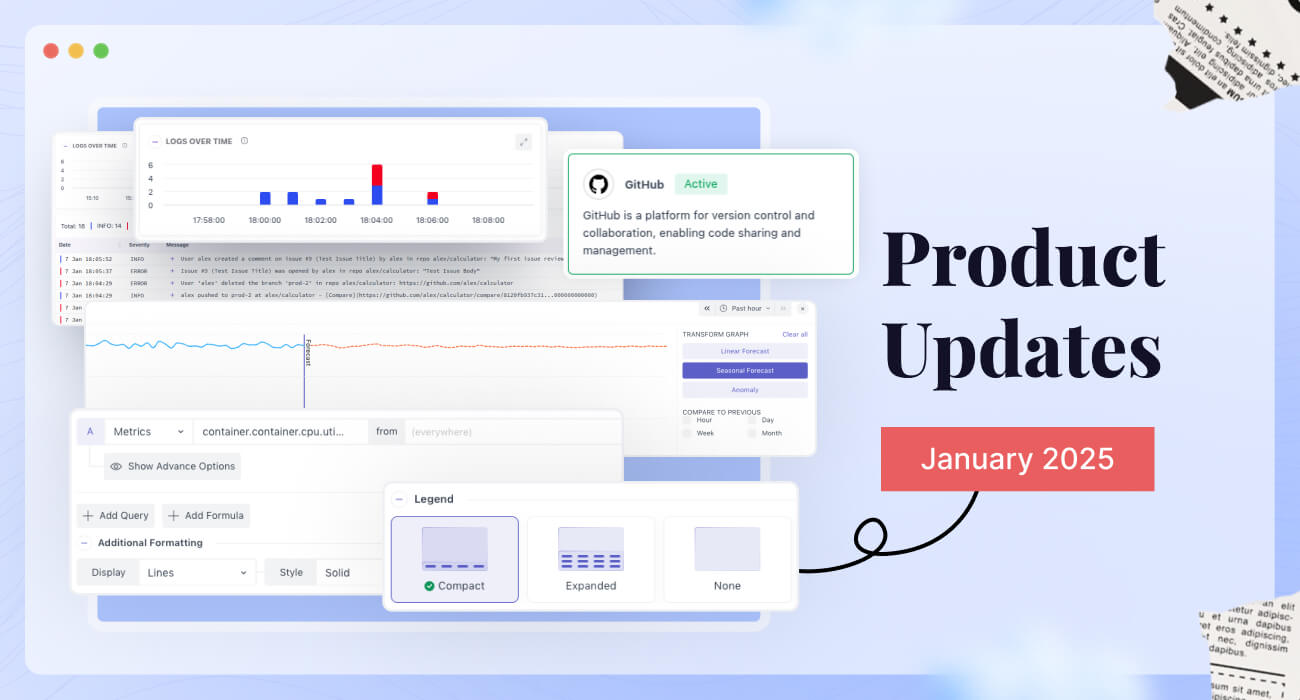
Product Updates
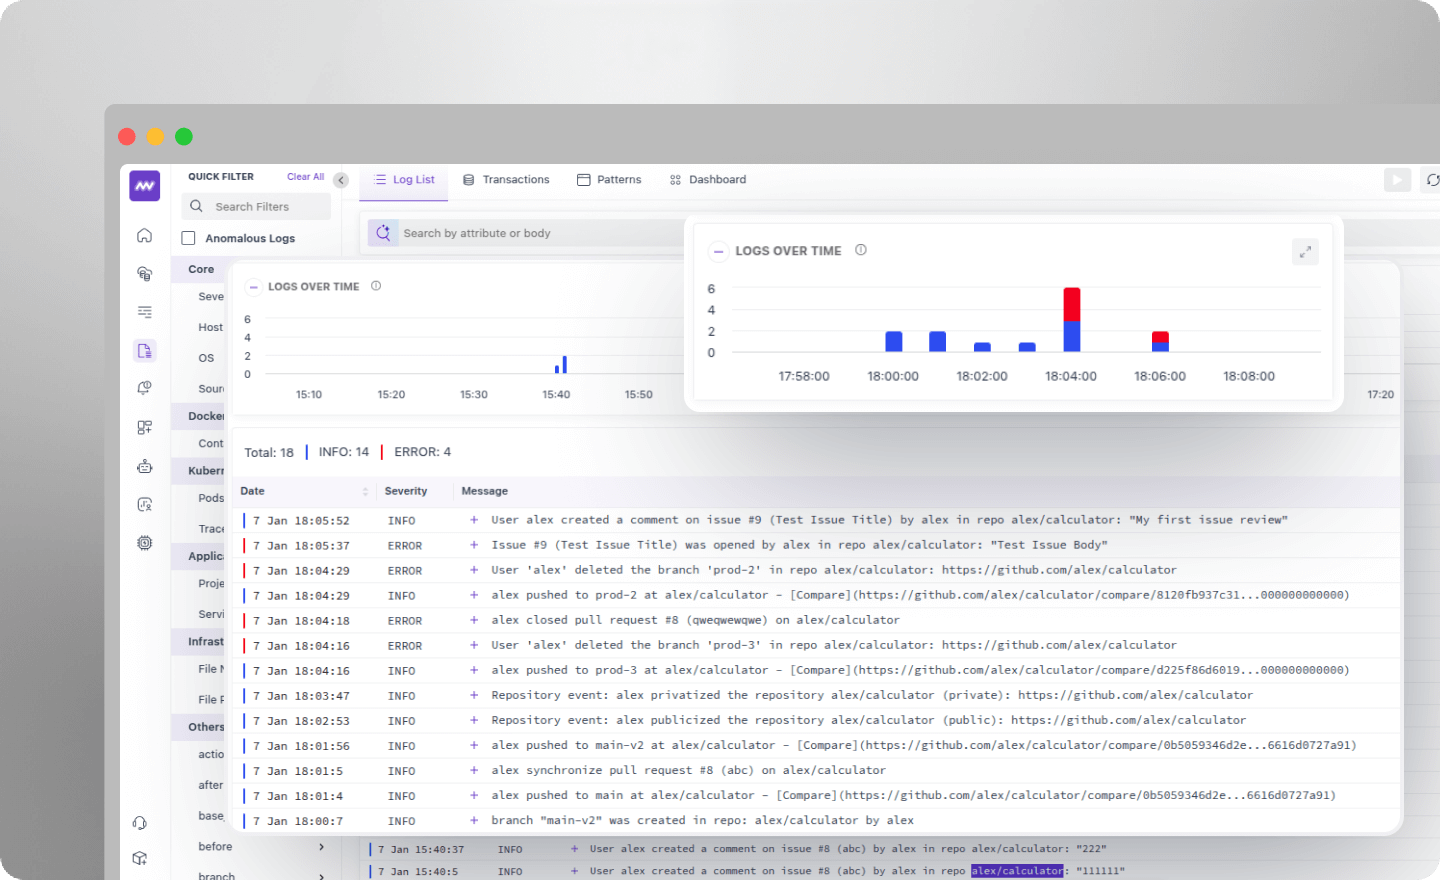
GitHub Integration
Integrate GitHub with Middleware to see 17 events like Pull Request (PR), PR reviews, comments, releases, issues, commit, and more as Logs in Middleware. All the issues and error events will come as error logs. Read more about integration and event mapping here.

Better Alerting Experience
Create alerts on any metrics or data point and customize it as per your need.
- Create alerts on metrics/attributes of selected categories.
- Customize alerts with options like adding formulas and multiple queries, and setting thresholds.
- Write your custom message for alert notification and configure it for re-notification for different alert states.
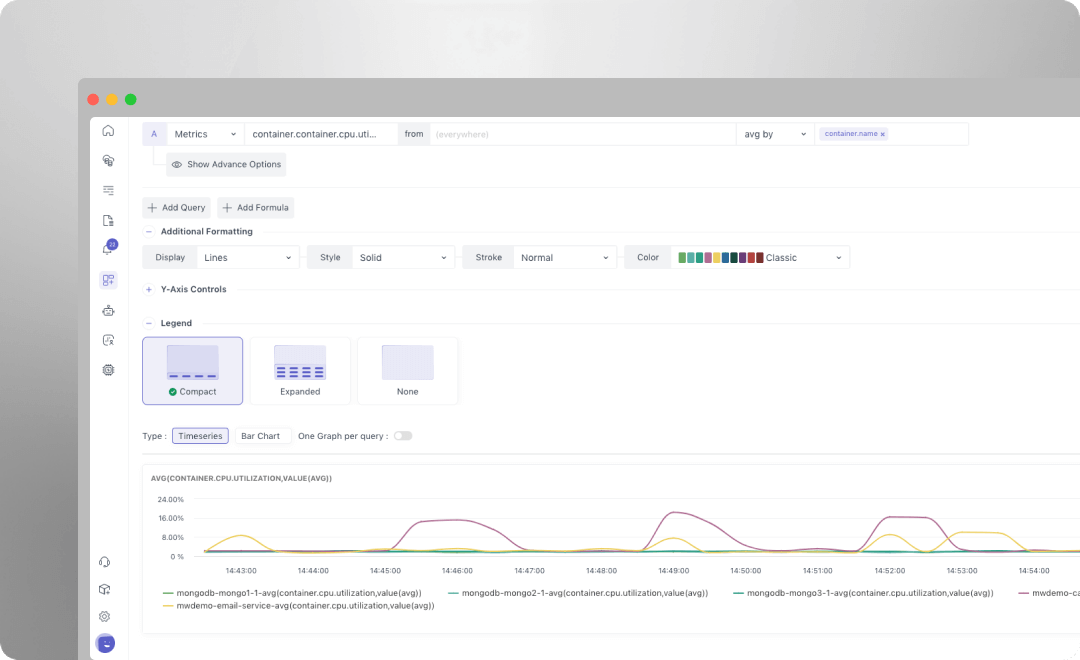
Metrics Explorer
Select metrics and see the widget representation in the chart by applying filters and other configurations. This can be used to visualize any metrics data.
Journald Integration
The Journald Integration allows parsing events from the systemd journal (journald) to collect structured log data.
Improvements
Log Patterns
Log patterns with advanced options like inspector/explore which shows sample logs with operator values.
Prometheus Integration
Option to scrap Prometheus metrics based on annotation and target allocator.
GCP Integration
We have added support for 21 new GCP services, including:
Google Cloud AlloyDB, Bigtable, Composer, Dataflow, Dataproc, Datastore, Filestore, Firebase, Firestore, Intercon