LLM Observability

Monitor and optimize LLM apps and AI agents in real time with OpenTelemetry-native insights into traces, prompts, token usage, costs, evaluations, logs, and GPU metrics.

No credit card required

Trusted By Leading Companies

LLM Observability

Product overview

Middleware LLM Observability gives AI engineers, platform teams, and SREs complete visibility into every LLM application and AI agent. Monitor prompts, traces, token usage, model performance, stack traces, logs, and GPU metrics from a unified platform. Detect failures faster with correlated traces and logs for faster root cause analysis, evaluate model quality before deployment, and optimize AI performance and costs in production.

  • TracingTracing

  • PlaygroundPlayground

  • LLM as a JudgeLLM as a Judge

  • GPU MonitoringGPU Monitoring

  • LLM DashboardsLLM Dashboards

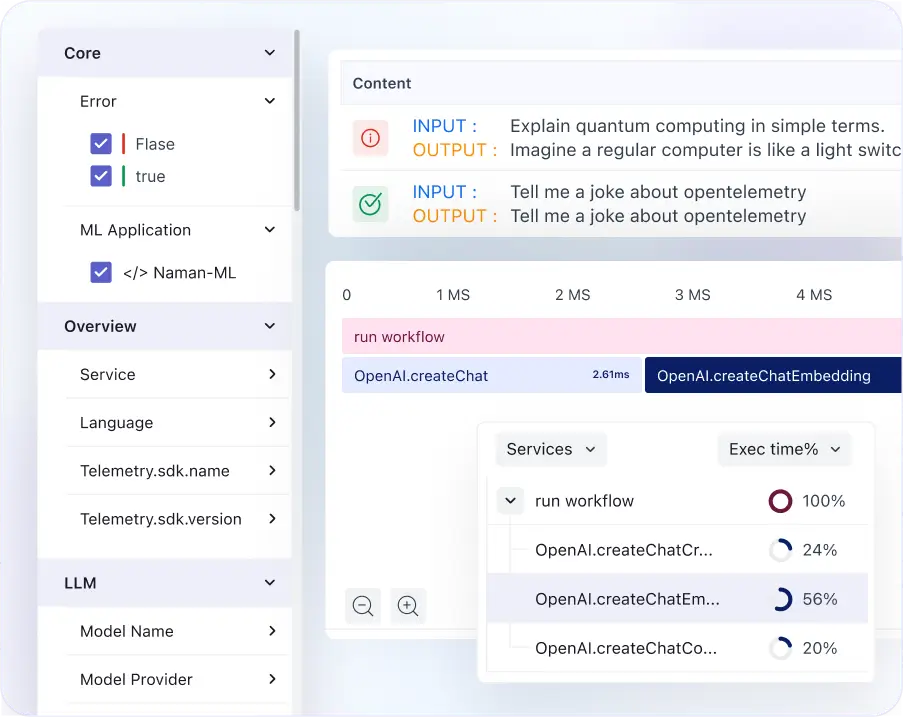
Deep visibility into LLM requests and AI workflows

Deep visibility into LLM requests and AI workflows

  • View total tokens per request, per-call cost, and model details alongside each trace.
  • Inspect span info and stack traces to pinpoint latency and failures at the function level.
  • Access full chat input and output history directly within the trace view.
  • Correlate traces with logs for faster root cause analysis without switching tools.
  • Automatically identify failed prompt executions and accelerate root cause analysis across complex AI pipelines.
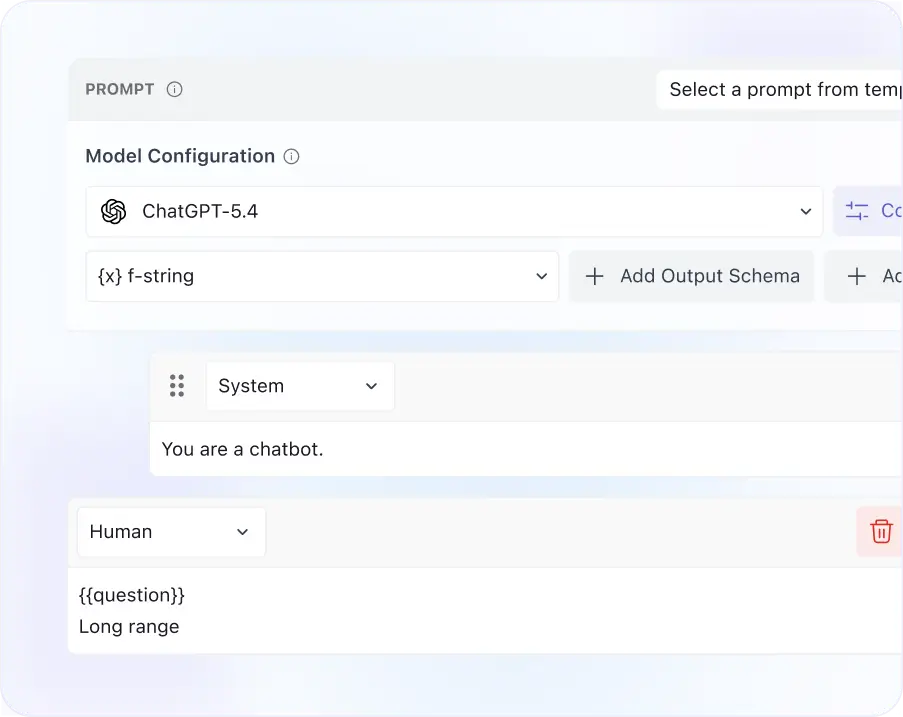
Test and validate AI agents before production

Test and validate AI agents before production

  • Switch between models and compare outputs side by side for the same input.
  • Define output schemas to test structured response formats and validate JSON behavior.
  • Add tools and function definitions to see how the model routes calls in real time.
  • Experiment with sample prompts without touching production infrastructure.
  • Validate prompt changes, tool calling, and agent workflows before deployment.
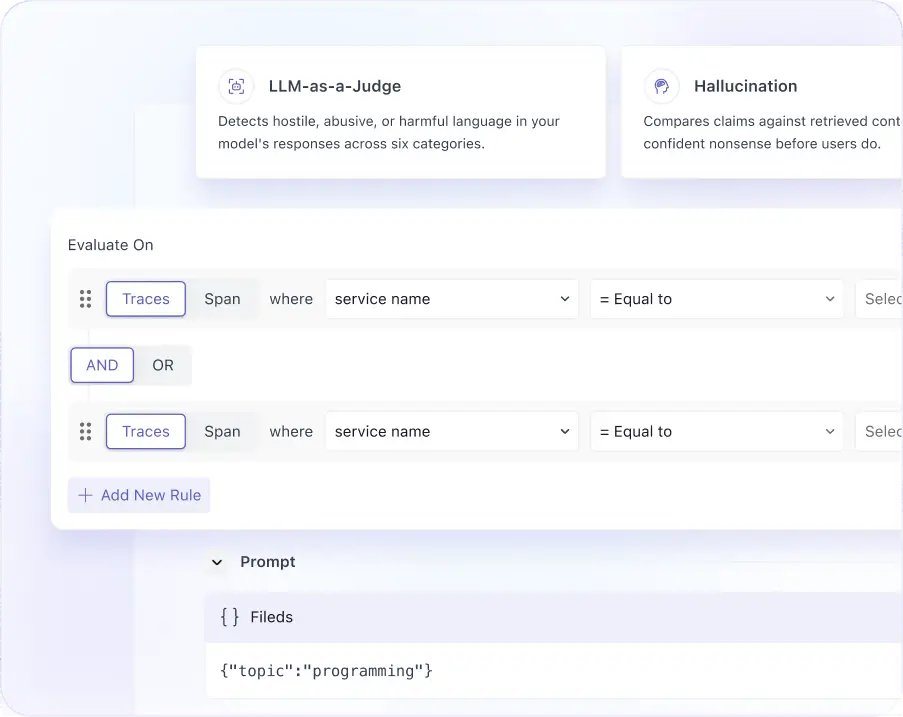
Automated evaluation with LLM-as-a-judge

Automated evaluation with LLM-as-a-judge

  • Use a language model as the evaluator — define scope, model, and custom rules.
  • Set acceptance criteria and let the judge score each prompt automatically.
  • Track evaluation results over time to detect hallucinations, response drift, and quality regressions before they affect users.
  • Reduce reliance on manual QA for high-volume LLM applications.
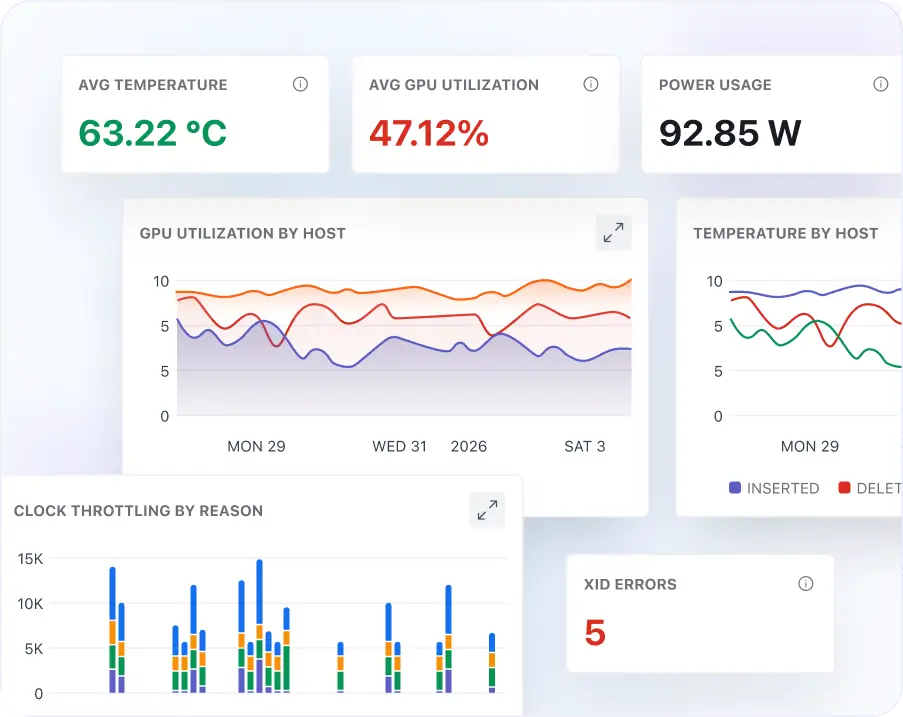
Monitor GPU infrastructure alongside your LLM workloads

Monitor GPU infrastructure alongside your LLM workloads

  • Track GPU utilization, occupancy, and memory usage at the device and host level.
  • Monitor temperature, power usage, and bandwidth to prevent resource saturation.
  • View running processes per GPU to correlate LLM inference load with hardware behavior.
  • Correlate GPU metrics with LLM traces and AI agent execution to understand the infrastructure cost of every inference call.
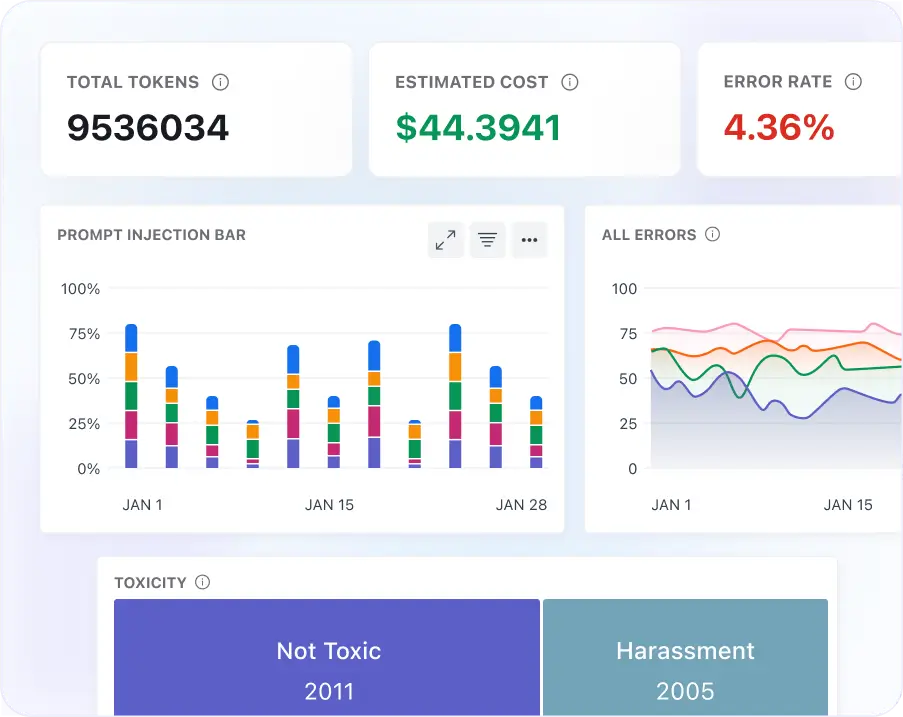
50+ metrics in one unified LLM performance dashboard

50+ metrics in one unified LLM performance dashboard

  • View token consumption, cost trends, error rate, and LLM call volume at a glance.
  • Monitor evaluation scores, response quality, latency percentiles, tool usage, and AI agent performance in real time.
  • Use pre-built LLM-specific graphs without any manual dashboard configuration.
  • Share dashboards across teams to align engineering, product, and finance on LLM spend.

Start monitoring your LLM applications and AI agents in minutes.

Hear it from the best: Why top companies trust Middleware

Middleware has played a very good role in transforming our observability and application performance. For instance, we reduced our total observability costs by 50%.

Take an interactive tour of LLM Observability

Explore traces, prompts, evaluations, dashboards, GPU monitoring, and AI agent observability in an interactive walkthrough.

Middleware Demo

Integrate in A Snap

Instrument your LLM applications and AI agents with OpenTelemetry-native observability. Start collecting traces, prompts, logs, token usage, evaluations, and GPU metrics in minutes.

LLM SDK

View Docs

Traceloop

View Docs

Openlit

View Docs

Cookbooks

View Docs

Evaluations

View Docs

Have Questions About LLM Monitoring?

Contact us

FAQs

Get comprehensive insights into your LLM applications with real-time monitoring and optimization capabilities.

What is LLM observability?

LLM observability is the practice of monitoring, debugging, evaluating, and optimizing production AI applications. It provides visibility into prompts, responses, token usage, latency, traces, model performance, GPU utilization, and infrastructure so engineering teams can quickly identify failures, improve response quality, reduce AI costs, and maintain reliable AI applications.

What types of issues can Middleware's LLM observability detect?

Middleware detects both infrastructure and quality failures across your LLM applications. On the infrastructure side: latency spikes, token cost overruns, API errors, timeouts, and GPU resource saturation. On the quality side: hallucinations (via LLM-as-a-judge evaluation), response drift after model or prompt changes, evaluation score regressions, poor tool call behavior, and excessive token consumption per request. Unlike generic APM tools, Middleware captures these issues at the span and trace level so you can pinpoint which model call, prompt step, or tool invocation caused the failure.

Which LLM providers and frameworks does Middleware integrate with?

Middleware integrates with any LLM provider or framework that supports OpenTelemetry, including OpenAI, Anthropic, Google Gemini, and open-source models like Llama and Mistral. Native integrations are available for OpenLIT and Traceloop, both of which follow OpenTelemetry GenAI semantic conventions. If your stack uses LangChain, LlamaIndex, or similar frameworks, you can instrument them with OTel-compatible SDKs and send traces directly to Middleware, no proprietary agent required.

Can I test LLM outputs before they reach production using Middleware?

Yes. The Middleware Playground lets you experiment with LLM behavior in a safe, isolated environment before deploying. You can switch between models, define output schemas to validate structured responses, add tool and function definitions to test calling behavior, and run sample prompts all without touching production infrastructure. It is designed for teams iterating on prompt engineering, model selection, or tool configuration who need fast feedback without deployment risk.

How does Middleware's LLM dashboard work and what does it show?

The Middleware LLM dashboard provides a real-time summary of your entire LLM application's performance across 50+ pre-built graphs. You can monitor token consumption, cost trends, error rate, LLM call volume, evaluation scores, latency percentiles, and tool usage all in one view without any manual configuration. The dashboard is available from day one and updates in real time, making it useful for both live incident triage and longer-term cost and quality trend analysis.

How does LLM-as-a-judge evaluation work in Middleware?

Middleware's LLM-as-a-judge feature lets you use a language model as the evaluator for your LLM application's outputs. You define the scope, choose the judge model, and set custom rules and acceptance criteria. Middleware then automatically scores each prompt against your configuration and flags responses that fall outside the defined criteria, giving you continuous quality monitoring without manual review.

Does Middleware support GPU monitoring for LLM workloads?

Yes. Middleware monitors GPU hosts and devices alongside your LLM application metrics. You can track GPU utilization, memory usage, occupancy, temperature, power consumption, bandwidth, and running processes, all correlated with LLM trace data. This lets you understand the hardware cost and resource impact of each inference call without a separate GPU monitoring tool.

Can I use the Middleware Playground to test LLM outputs before deploying?

Yes. The Middleware Playground lets you test LLM behavior in a controlled environment before it reaches production. You can switch between different models, define output schemas to validate structured responses, add tool definitions to test function calling, and run sample prompts all without touching your production infrastructure. It's designed for teams that need to iterate on prompts and model configurations quickly.

Can Middleware monitor AI agents?

Yes. Middleware provides observability for AI agents and agent-based workflows by capturing traces, prompt execution, tool calls, token usage, evaluations, logs, and GPU metrics. Teams can troubleshoot agent execution, optimize response quality, and monitor production AI applications from a unified platform.

Optimize More. Worry Less. With Middleware.