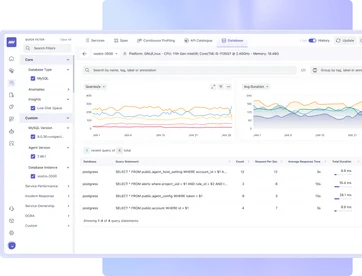
Real-Time Query Analysis
- Monitor and analyze SQL queries in real time across all database environments.
- Correlate database queries with related metrics and traces for faster analysis and troubleshooting.
- Monitor and optimize query rewrites, schema changes, and indexes.
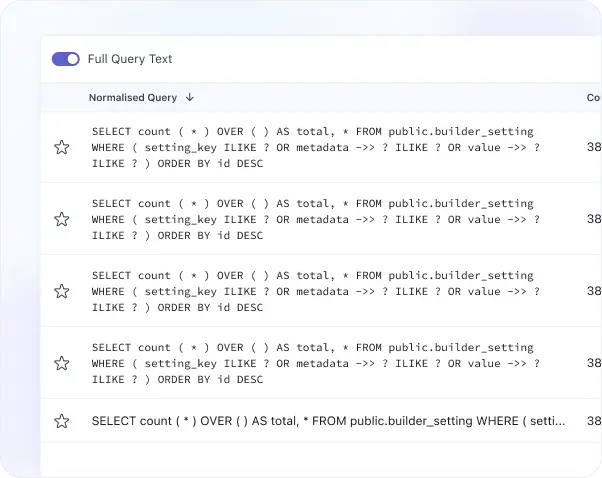
Query Optimization
- Quickly identify long-running queries to accelerate root-cause analysis.
- Track query performance using key metrics such as average latency, execution time, rows scanned, and rows returned.
- Get actionable recommendations to optimize SQL queries and improve performance.
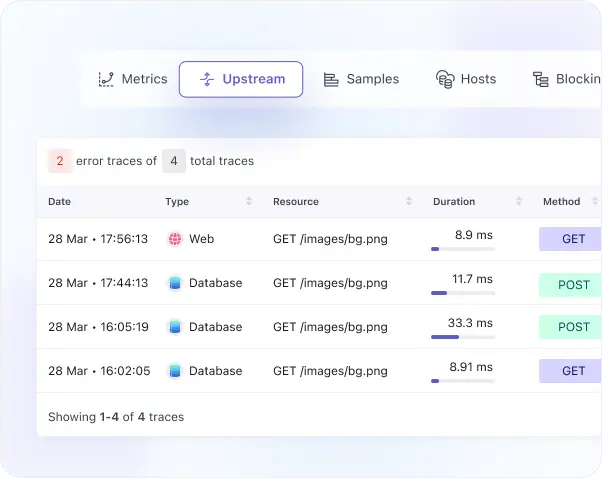
Faster Troubleshooting & Optimization
- Investigate query latency regressions, identify root causes, and automate remediation with OpsAI.
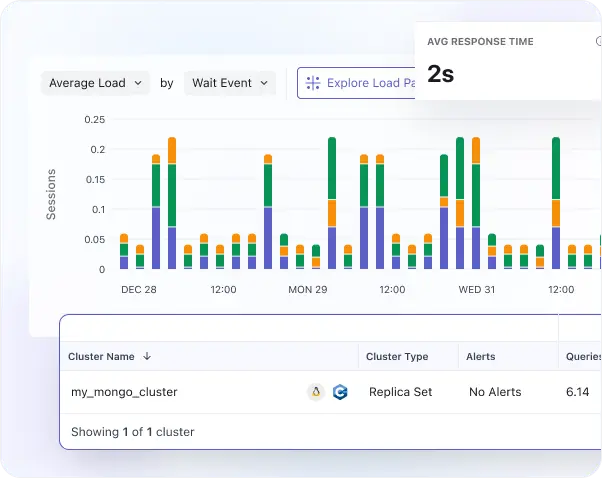
- Identify resource bottlenecks and determine which users, services, and applications are generating database load.
- Identify and resolve database locks by analyzing blocking queries.
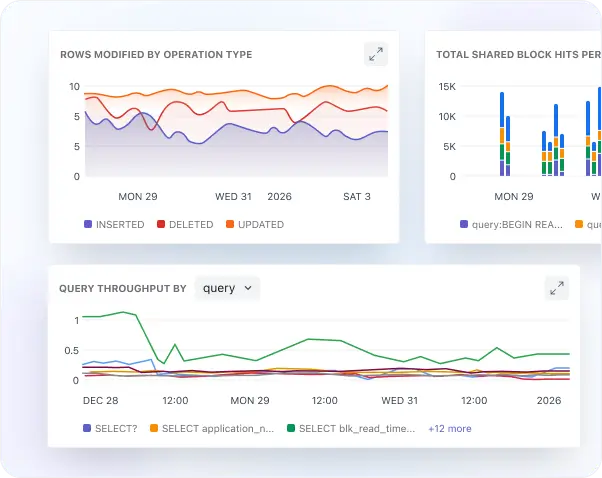
Database Performance Monitoring & Insights
- Monitor workload, throughput, resource utilization, and errors to optimize database performance.
- Analyze blocking queries, query samples, attributes, and schema details to gain deeper performance insights.
- Analyze database errors to identify and resolve issues quickly.
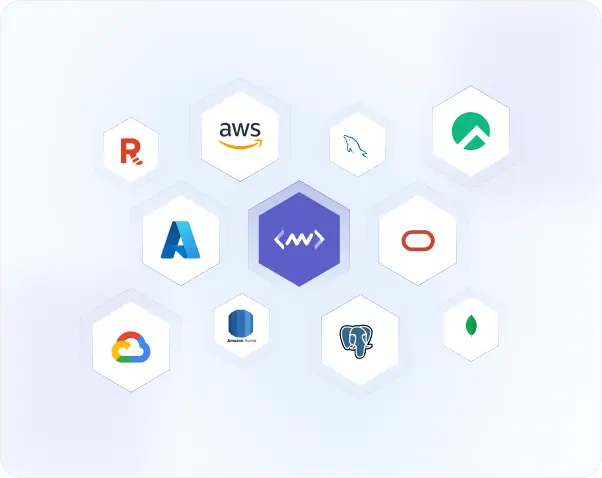
Multi-Vendor Database Support
- Monitor Oracle Database, Microsoft SQL Server, MySQL, and PostgreSQL.
- Monitor MongoDB, Cassandra, and Couchbase.
- Monitor managed cloud databases such as Amazon Aurora, Google Cloud SQL, and Azure SQL Database.