









The Better New Relic Alternative
Full-Stack Observability with an SRE Agent Built In

Tired of per-user licensing, Compute Capacity Units, NRQL lock-in, and an AI that stops at the summary? Switch to Middleware, a unified, OpenTelemetry-native observability platform with predictable pricing, one-minute setup that comes with OpsAI, an SRE Agent that ships the fix as a pull request.

Trusted By The Best Teams From

Why You Should Replace New Relic with Middleware

Full Feature Parity

APM, infrastructure, logs, distributed tracing, RUM, synthetics, database monitoring, containers, serverless, browser testing, and LLM observability—all bundled in one platform with predictable pricing.

  • Every observability capability included in one plan
  • No separate SKUs for APM, RUM, Log management
  • LLM observability included at no extra cost
  • One platform for every telemetry signal

New Relic delivers comprehensive observability, but pricing is spread across multiple products, user licenses, and platform meters. As adoption grows, costs increase across several billing dimensions.

  • Multiple pricing meters for the same platform
  • Per-user licensing across plans
  • Compute Capacity Units add another billing layer
  • Extended retention requires additional add-ons
No Vendor Lock-In

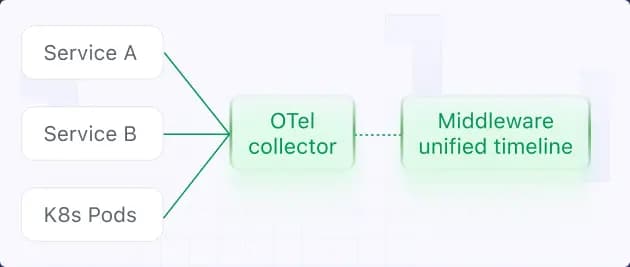
Built on OpenTelemetry from day one. Your instrumentation stays portable, your telemetry remains open, and logs, metrics, traces, and events correlate automatically in one timeline.

  • 100% OpenTelemetry-native architecture
  • OTel instrumentation works without changes
  • Cloud, BYOC, hybrid, and on-prem deployments
  • No proprietary agents or query language required
Built on OpenTelemetry from day one. Your instrumentation stays portable, your telemetry remains open, and logs, metrics, traces, and events correlate automatically in one timeline.

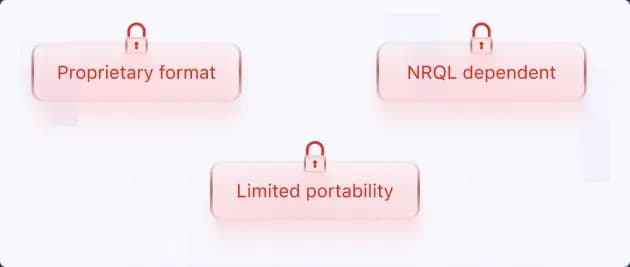
New Relic supports OpenTelemetry, but the platform still relies on proprietary agents, NRQL, and proprietary storage. Migrating often means rebuilding queries and dashboards.

  • OpenTelemetry data stored in a proprietary format
  • NRQL required for advanced investigations
  • Migration requires rebuilding dashboards
  • Proprietary platform limits portability
New Relic supports OpenTelemetry, but the platform still relies on proprietary agents, NRQL, and proprietary storage. Migrating often means rebuilding queries and dashboards.

Better Support and Experience

Every customer receives the same high-touch support experience, regardless of plan size, with direct access to engineers when production issues occur.

  • One-hour critical issue SLA on every plan
  • Dedicated Slack and Microsoft Teams support
  • Real engineers respond directly
  • No enterprise-only support tiers

Support quality depends on your subscription tier. Faster response times and dedicated support are reserved for Enterprise customers.

  • One-hour SLA available only on Enterprise
  • Pro plans receive longer response targets
  • Standard plans rely primarily on ticket support
  • Dedicated support requires premium plans

Predictable Pricing, No Per-User Tax

Simple usage-based pricing with no hidden meters. Pay only for the data you send while every user gets access to the full platform.

  • Pay only for data ingested
  • No per-user or CCU charges
  • Unlimited users included
  • 180-day retention included

New Relic combines data ingest, user licensing, Compute Capacity Units, and retention upgrades into one pricing model, making costs harder to forecast.

  • Per-GB ingest plus per-user pricing
  • Compute Capacity Units billed separately
  • Data Plus required for longer retention
  • Usage spikes can significantly increase costs

Zero Config

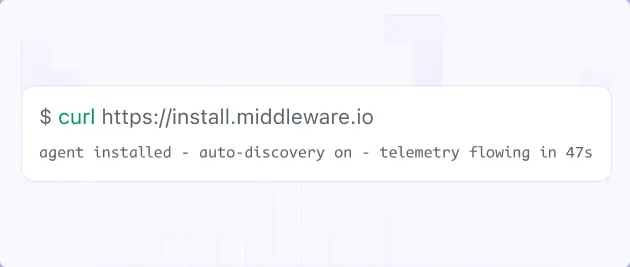
Deploy with one script and start monitoring immediately. No proprietary query language or complex onboarding required before teams become productive.

  • One-minute installation
  • Automatic service and dependency discovery
  • Visual query experience for everyday workflows
Deploy with one script and start monitoring immediately. No proprietary query language or complex onboarding required before teams become productive.

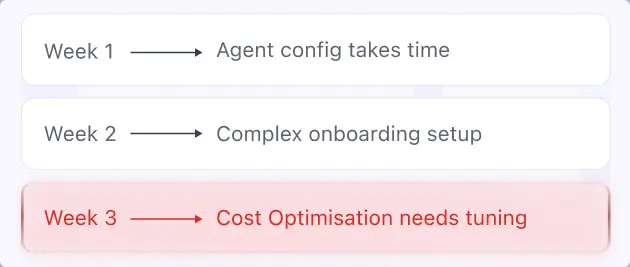
New Relic provides powerful capabilities, but many workflows depend on NRQL, agent configuration, and ongoing telemetry tuning.

  • Agent configuration and tagging take time
  • Onboarding can require significant setup
  • Cost optimization needs continuous tuning
New Relic provides powerful capabilities, but many workflows depend on NRQL, agent configuration, and ongoing telemetry tuning.

Telemetry Patterns

Every signal is automatically connected, making investigations faster without relying on custom tagging or proprietary workflows.

  • Service-level alerting built in
  • Search across every stored span
  • Native logs-to-traces correlation
  • High-cardinality queries without additional complexity

New Relic supports advanced telemetry, but several workflows depend on NRQL, consistent tagging, and platform-specific configuration.

  • Span search depends on retention settings
  • Correlation relies on tagging consistency
  • NRQL required for advanced querying
  • Configuration overhead grows with scale

Point existing New Relic alerts to Middleware & switch gradually

The first observability platform built around AI,
not bolted onto it

AI Dashboards

Describe what you want in plain English. Middleware builds the dashboard, picks the charts, and writes the queries. No PromQL, no custom query language, no template gallery to comb through.

AI Alerts

Alerts that learn what "normal" looks like for each service and surface only the deviations that matter. Anomaly detection that doesn't drown your on-call rotation in noise.

OpsAI · SRE Agent

An AI SRE that pinpoints root cause, identifies the offending line of code, and opens a pull request with the fix while you're still reading the alert. Auto-resolves issues with 80% accuracy.

AI K8s Root Cause Finder

Auto-structuring, severity detection, and pattern recognition built into log ingestion. No manual regular expressions, no parsing pipelines to maintain.

Auto-Fix · 60% Time Saved

Auto-fix across infrastructure and application layers with 80% accuracy. Engineers spend 60% less time on issue resolution — and the rest on shipping product.

Customer Stories

Aceturtle

Middleware has played a very good role in transforming our observability and application performance. For instance, we reduced our total observability costs by 50%.

Read the story

Vivek Gupta

Founder & CEO

Hotplate

We're heavy users of RUM and have tried many tools before discovering Middleware. We've been using OpsAI for the past few weeks, and it has automatically resolved about 60% of our production issues.

Read the story

Rangaraj Tirumala

Founding Engineer at Hotplate

Feature-by-Feature Comparison: Middleware vs New Relic

Evaluate on your own. Here's how Middleware stacks up against New Relic, capability by capability.

Bottom line

Who each tool is really built for

Cost-conscious, OpenTelemetry-native, cloud-native teams

Large enterprises with complex monitoring requirements

SRE Agent

(detect → fix → PR)

Auto-remediation

(code + K8s)

PR generation

BYOC deployment

Cloud, BYOC & On-prem

Primarily SaaS

Value for money

Pay only for the data that you send

Users, ingest, CCUs, and add-ons

OpenTelemetry architecture

Built natively on OpenTelemetry

Combination of proprietary agents & NRQL.

Migration

No re-instrumentation

Platform-specific migration

Query language

Visual UI + PromQL + SQL-like logs

No proprietary syntax required

NRQL

Advanced investigations rely on a proprietary language

Per-user pricing

None

Unlimited users on every plan

Per-user licensing

User count impacts total cost

Ingestion control

Built In

Drop noisy telemetry before storage

Basic filtering

Cost optimization depends on usage management

Unified investigations

One timeline

Logs, metrics, traces, and events automatically correlated

Cross-product experience

Correlation depends on New Relic services.

Logs-to-traces correlation

Native

Jump directly from logs to related traces

Supported

Available with proper instrumentation

Search across telemetry

Search every stored Span

No platform-specific limitations

Retention dependent

Search varies by plan and stored data

AI operations

OpsAI included

Investigates, remediates, and creates pull requests

AI assistance

Helps investigate and summarize incidents

Auto-remediation

Built in

Code fixes and Kubernetes remediation

Not available

Remediation remains manual

LLM observability

Included

No separate pricing

Available

Included within AI monitoring capabilities

Data retention

180 days included

No additional retention charges

Plan dependent

Longer retention requires upgrades

APM, Infrastructure, Logs & RUM

One platform, one pricing model

Broad coverage

Available across multiple platform capabilities

Dedicated technical support

On all plans

Real support, even on the entry tier

Enterprise plans

Premium SLAs and dedicated support reserved for higher tiers

The numbers after the switch

Averages across customers who migrated from New Relic to Middleware.

4×

Troubleshooting

Faster mean-time-to-detect with unified signals on one timeline.

75%

Cost Reduction

Predictable, usage-based billing replaces high-watermark host fees and the custom-metric tax

1hr

Issue response SLA

Critical-issue response SLA on every plan

80%

Auto fixes with accuracy

OpsAI resolves issues end-to-end, saving 60% of engineer time.

You Don't Have to Rip Out New Relic on Day One

Already running New Relic Alerts? Forward it to OpsAI and let it investigate & fix incidents against your existing stack without re-instrumentation

Zero Re-instrumentation

Incremental Adoption

100% Data Continuity

Read the Migration Docs

Email is required

Company name is required

Please enter monthly bill amount
Features Used in New Relic
Minimum 3 characters required

Minimum 3 characters required

FAQs

Everything you want to know about the New Relic Alternative

What's the main difference between Middleware and New Relic's pricing models?

Middleware uses a single transparent meter — pay for the data size you send. New Relic uses three meters at once: per-GB ingest, per-user, and Compute Capacity Units, plus add-ons like Data Plus.

Will I pay extra for users on Middleware?

No. Middleware has no per-user fees. Add as many teammates as you want.

Is Middleware really free to try?

Yes. Use log monitoring, infrastructure monitoring, APM, and every other feature free for 14 days. No credit card, no time limit beyond the trial.

How does Middleware compare to New Relic on data ingest cost?

Middleware charges $0.30/GB for metrics, logs, and traces after the trial. New Relic charges $0.30/GB on Standard, $0.40/GB on the Original data option, and $0.60/GB on Data Plus after the 100 GB free tier. For 1 TB of ingest a month, customers save roughly 22% on raw ingest alone — and more once user fees and CCUs are factored in.

Will I save money switching from New Relic?

Most customers see 50–75% reductions. Send us your New Relic invoice and we'll show you the exact number.

What happens if my data spikes? Will my bill 10x like it can on New Relic?

No. Middleware bills on actual usage, not peak, and the Ingestion Control feature lets you drop high-volume telemetry sources in two clicks before they hit your bill. Custom events and custom metrics are included — not metered separately.

Is Middleware OpenTelemetry-native?

Yes. OTel is the foundation, not an afterthought. Your instrumentation stays portable across vendors — no proprietary agent lock-in, no NRQL dependency.

Do I need to learn a new query language to use Middleware?

No. Middleware's UI is designed so most workflows don't require any query language. For advanced cases, the query interface is built around OTel attributes you already know.

Can I deploy Middleware on-premises or BYOC?

Yes. Cloud, on-prem, BYOC (bring your own cloud), or hybrid — your choice, for cost, security, or compliance reasons.

What happens to my New Relic dashboards when I migrate?

Middleware has its own dashboard builder, and our team provides onboarding support to help you recreate your critical New Relic dashboards in Middleware during migration.

Can I keep my existing New Relic OTel instrumentation?

Yes. If you're already sending OpenTelemetry data, you can repoint your collectors at Middleware and start ingesting immediately. No re-instrumentation required.

Optimize More. Worry Less. With Middleware.