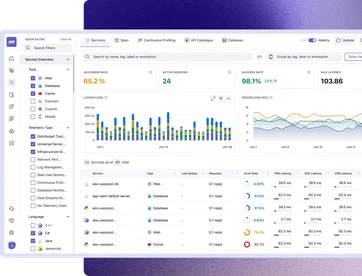
Track End-point Performance
- Automate synthetic checks for APIs and endpoint performance tracking at set time intervals.
- Monitor service performance and receive alerts for poor performance or downtime.
- Support for multiple protocols (HTTP, SSL, DNS, TCP, Websocket, UDP, ICMP, and gRPC).
Improve MTTR
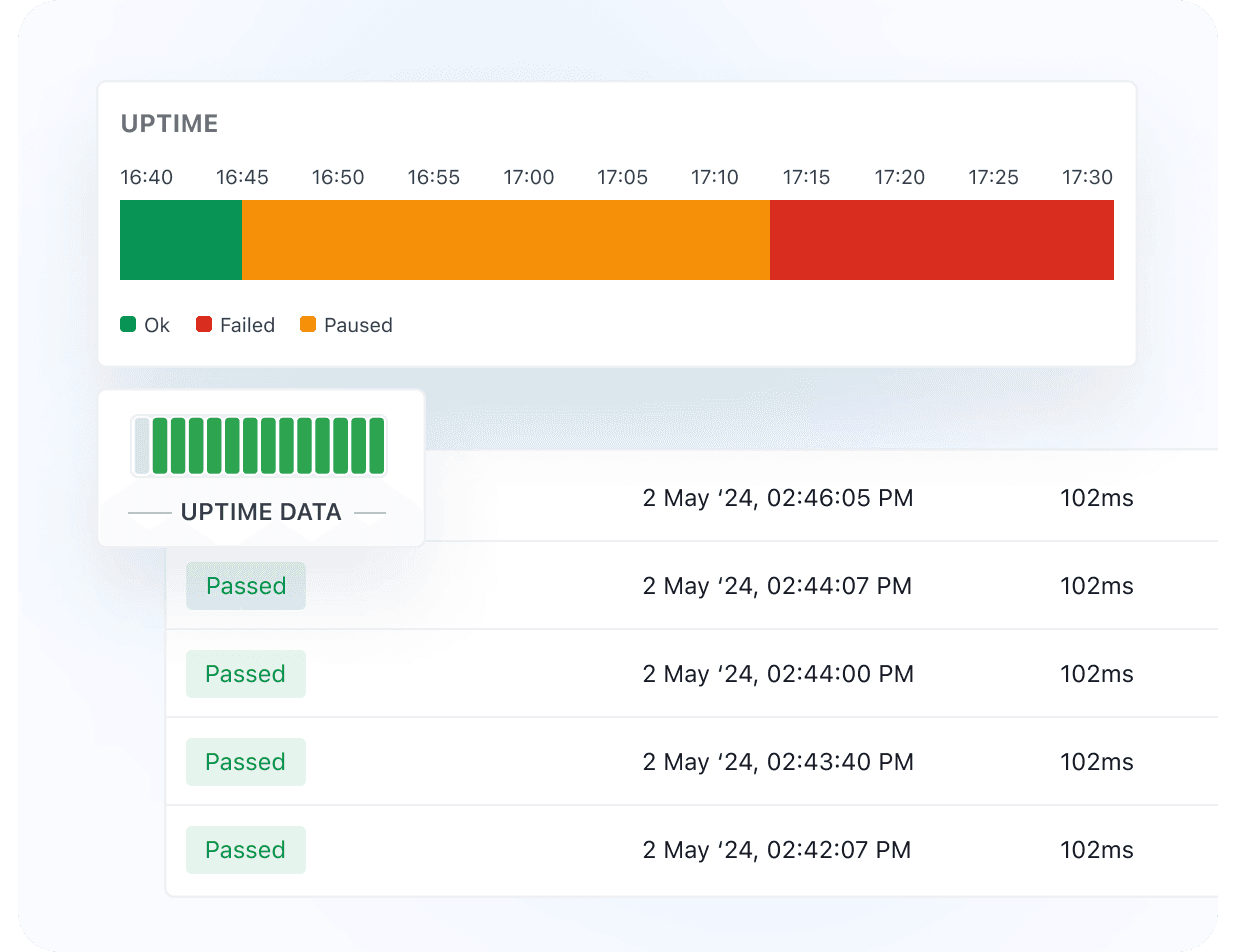
- Receive instant alerts when synthetic tests fail or performance drops.
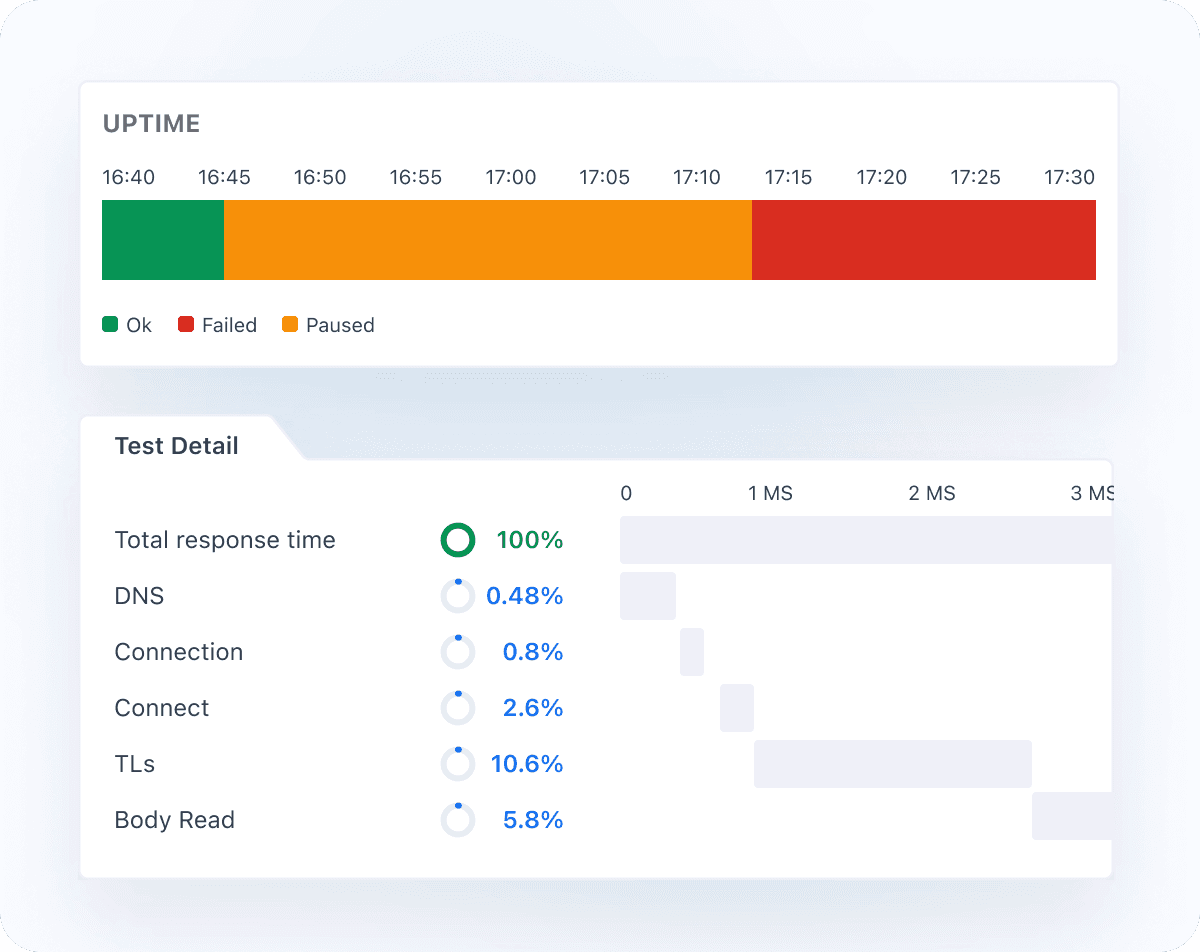
- Identify performance issues with detailed time graphs to quickly identify the root cause
- Visualize application uptime and performance data alongside key business metrics, helping you track your SLAs and SLOs.
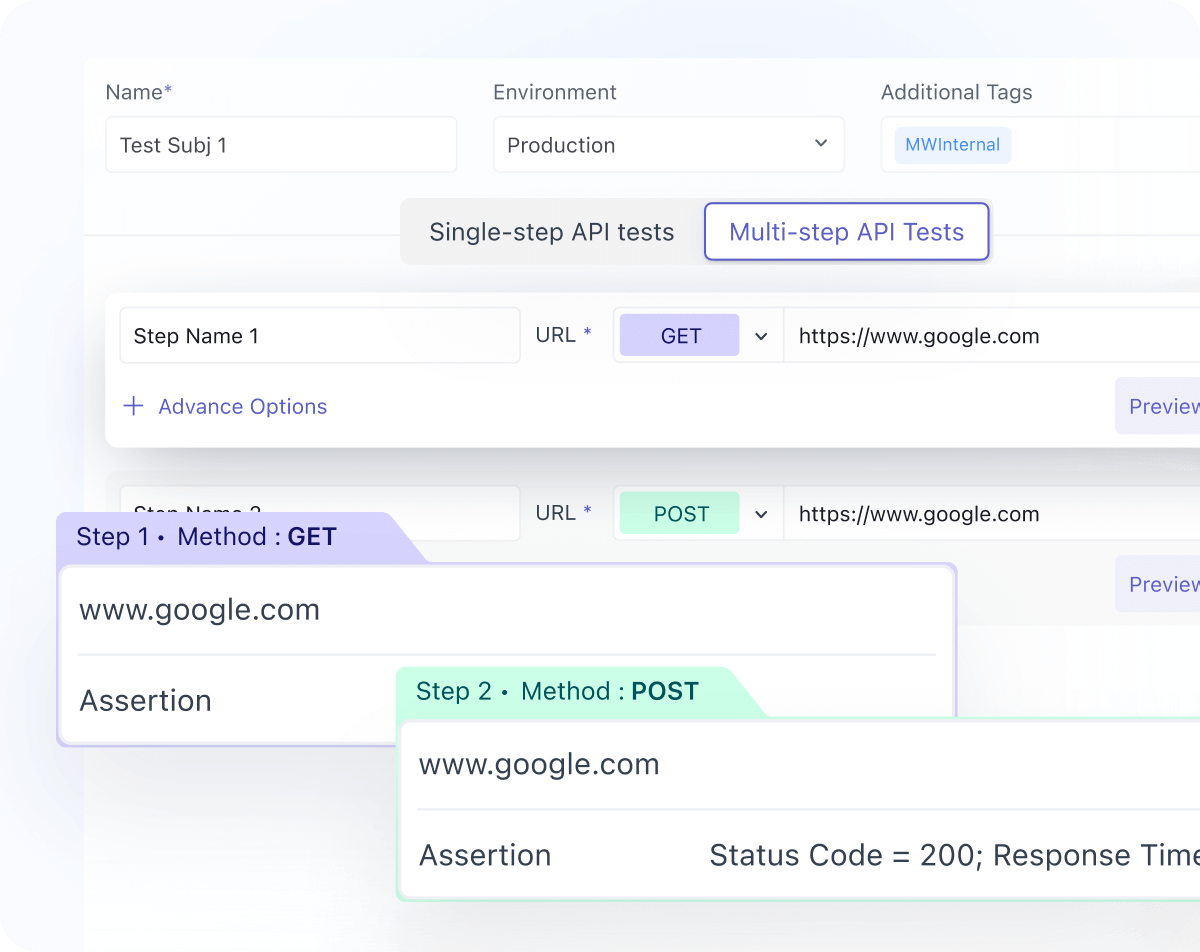
Multi-Step API Monitoring
- Verify key user flows at the API level by chaining API requests together in multistep tests.
- Chain steps together using response information from previous calls.
- Support for authentication and complex API workflows.
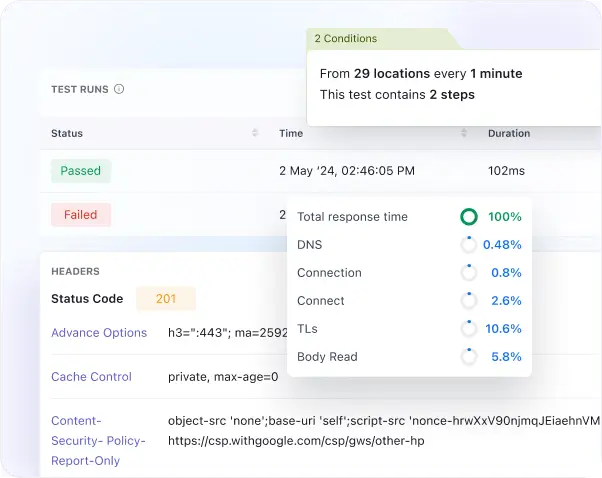
Debug Faster
- View breakdown of network timing data and response time by location.
- Run browser-based tests to simulate real user interactions and validate end-to-end journeys.
- Add meaningful assertions to confirm user experience.
- Identify performance issues with detailed time graphs.
Visibility and Insights
- Visualize application performance and uptime data alongside key business metrics.
- Monitor and maintain SLAs with proactive performance tracking.
- Get complete visibility into application performance and uptime.
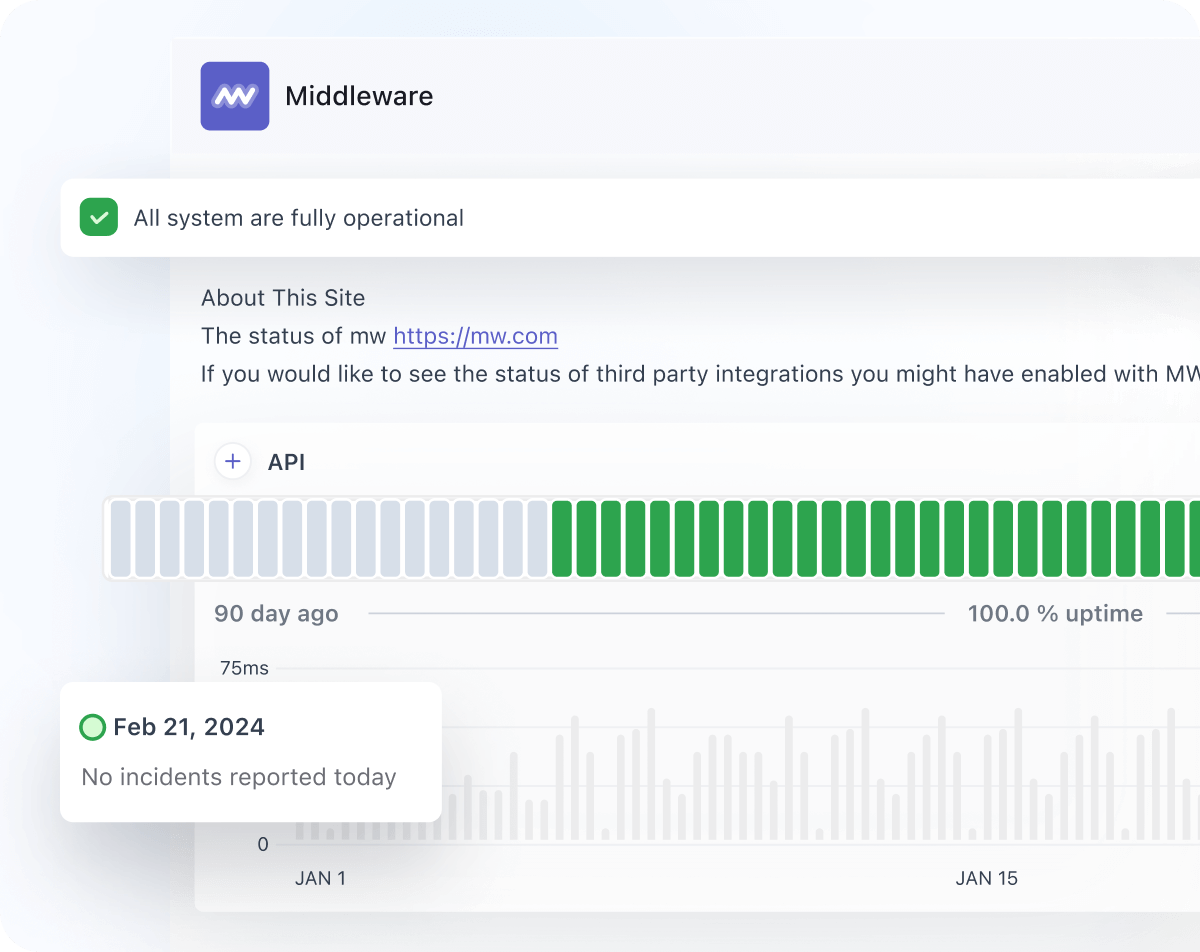
Public Status Page
- Share real-time service uptime and availability with customers through a public status page.
- Track API and webpage performance across locations and alert on degraded performance.
- Build transparency and trust by publishing service health updates.