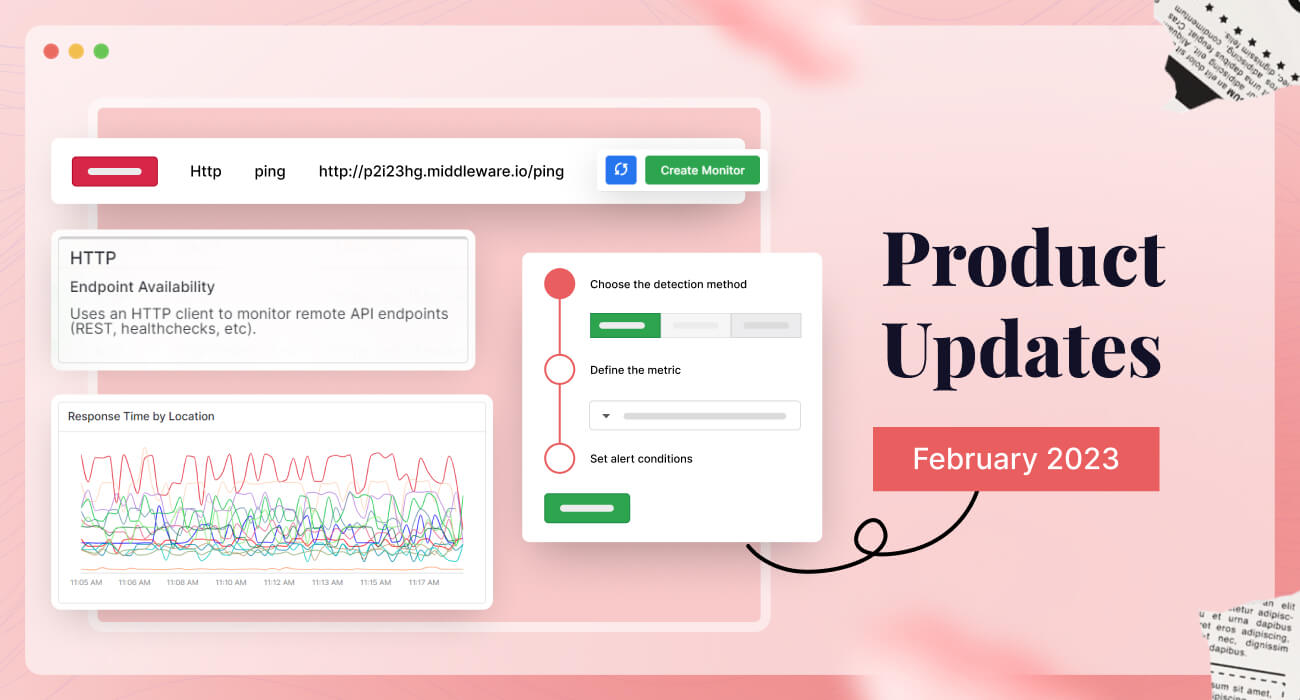
We have released key features, including synthetic monitoring, performance enhancements, and UX improvements.
See what’s new in February 2023!
1. Synthetic monitoring
You can use synthetic monitoring to see how your systems and applications are performing by simulating requests and actions from around the world.
This monitors the performance of your webpages and APIs from the backend to the frontend, as well as at various network levels (HTTP, SSL, DNS, WebSocket, TCP, UDP, ICMP, and gRPC), alerting you to faulty behavior such as regressions, broken features, high response times, and unexpected status codes.
How to set up API tests & synthetic tests in Middleware
Step 1: Create a new monitor (Test)
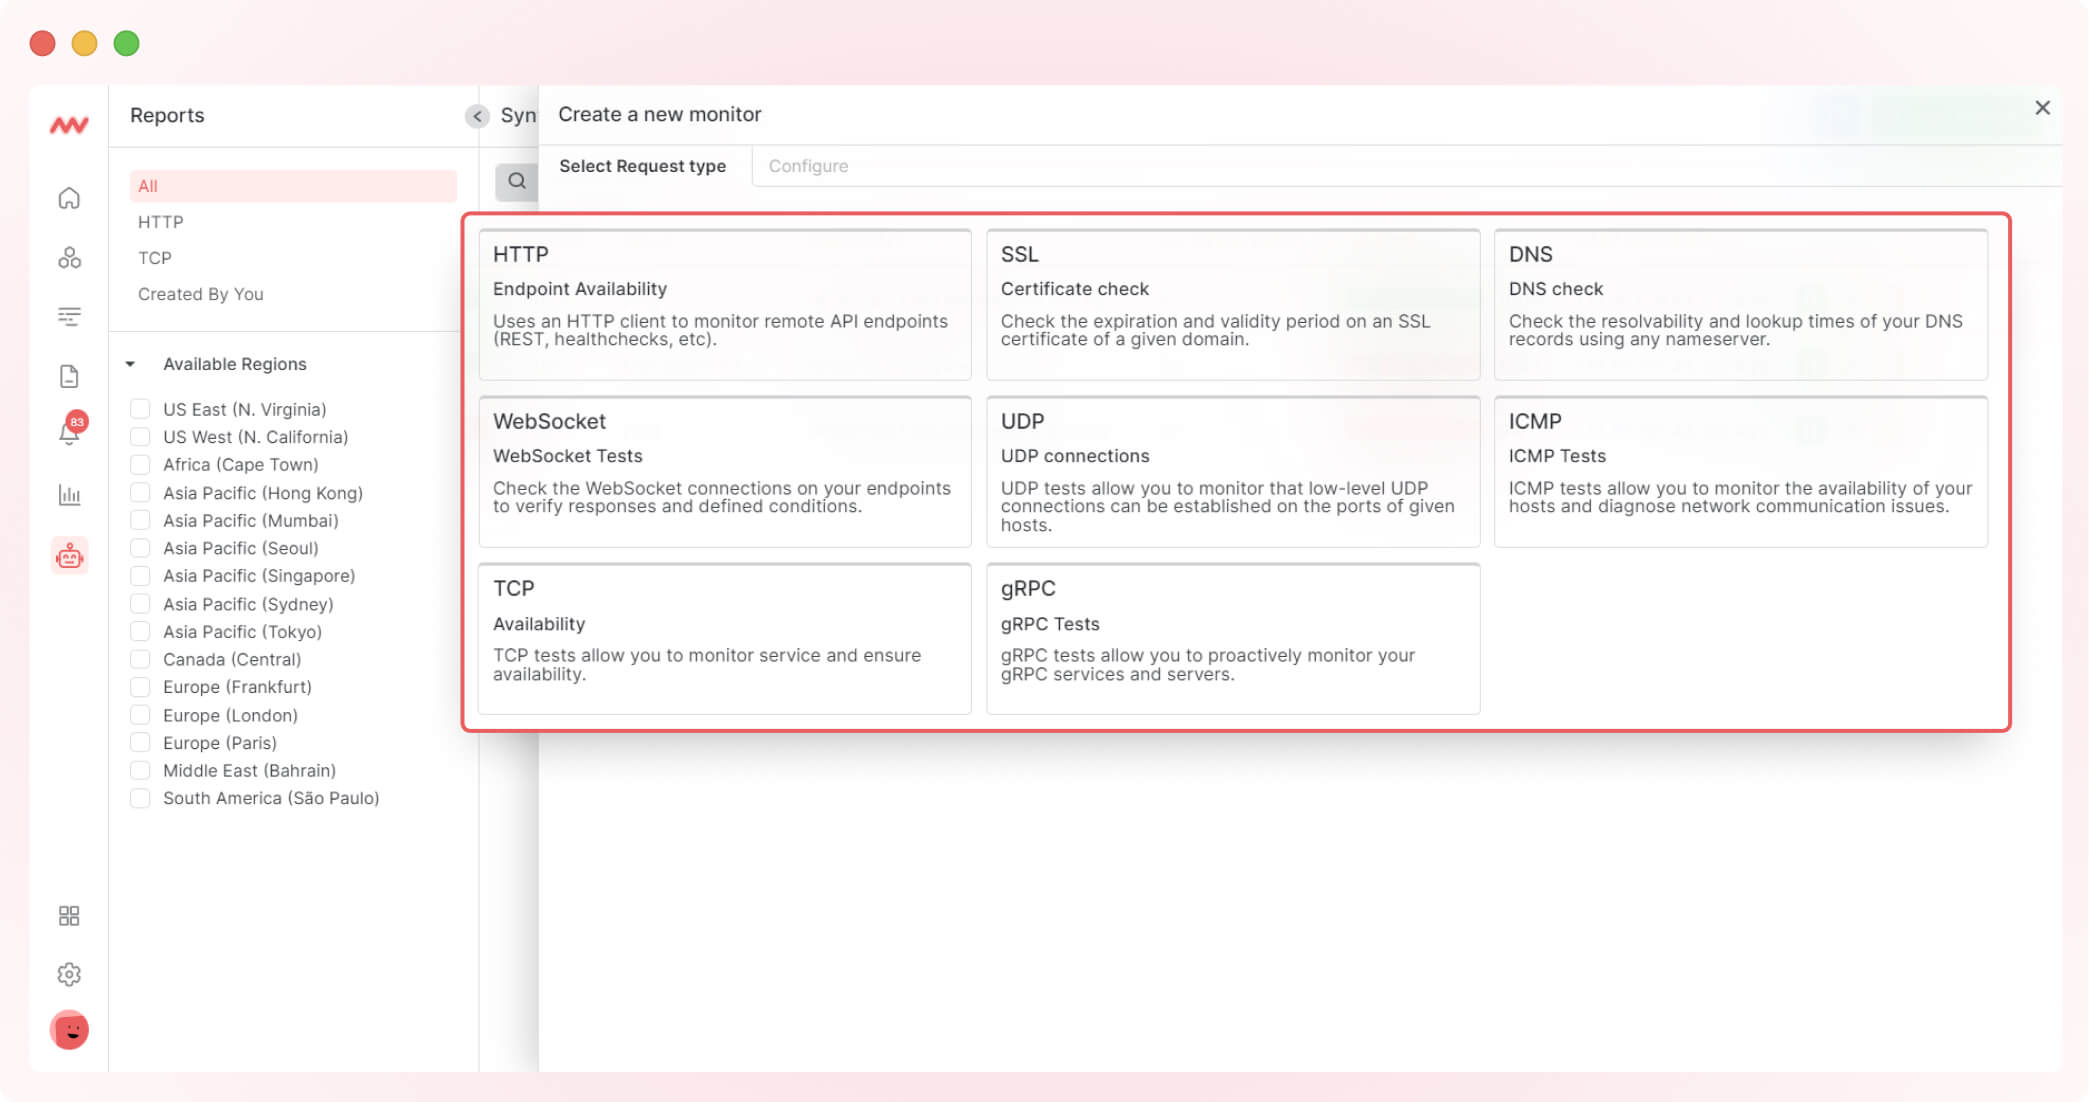
Synthetic monitoring allows you to launch single or chained requests to perform verifications on your key systems at various network levels: HTTP test, SSL test, DNS test, WebSocket test, TCP test, UDP test, ICMP test, and gRPC test. You can create a new monitor by clicking on the ‘Create Monitor’ button:

Now, select the request type to create the monitor:
Step 2: Define the request
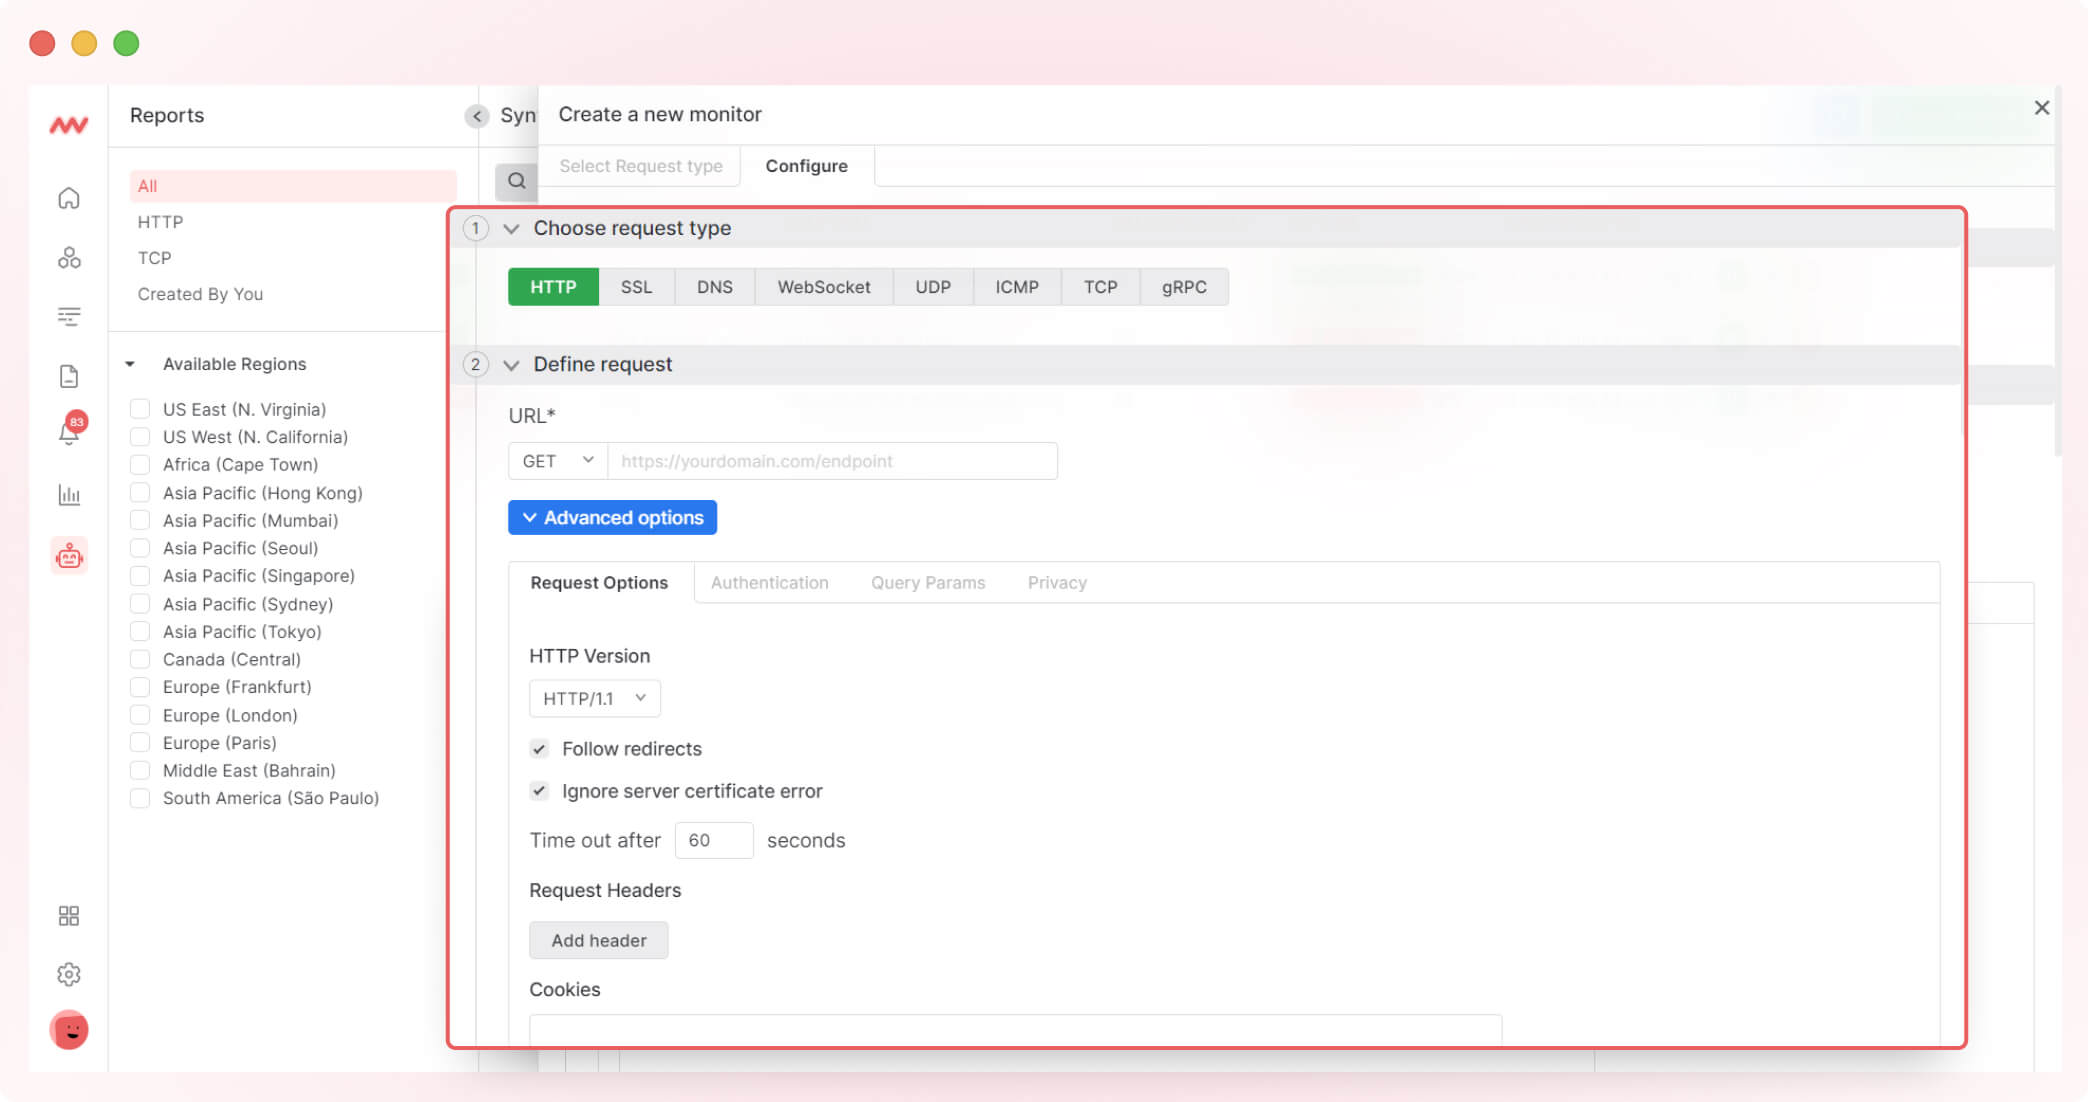
Define the request with a name and an environment, then enter the URL where you want to run the test. With an advanced setting option, you can add put request headers, authentication, and query parameters.
Step 3: Define assertions and select the location
Add as many assertions as you need for your request. If you need more specific testing, assertions can help (for example, the status code should be 200 only).

You can choose where you want this test to run. Location selection is useful when you have global users, and your API is accessed worldwide
Step 4: Specify test frequency and setup retry rules
You can specify the test frequency by selecting a time interval such as every 1m, 5m, etc., or you can define a custom time interval with a day selection (ex: every Monday at 09:00 AM)
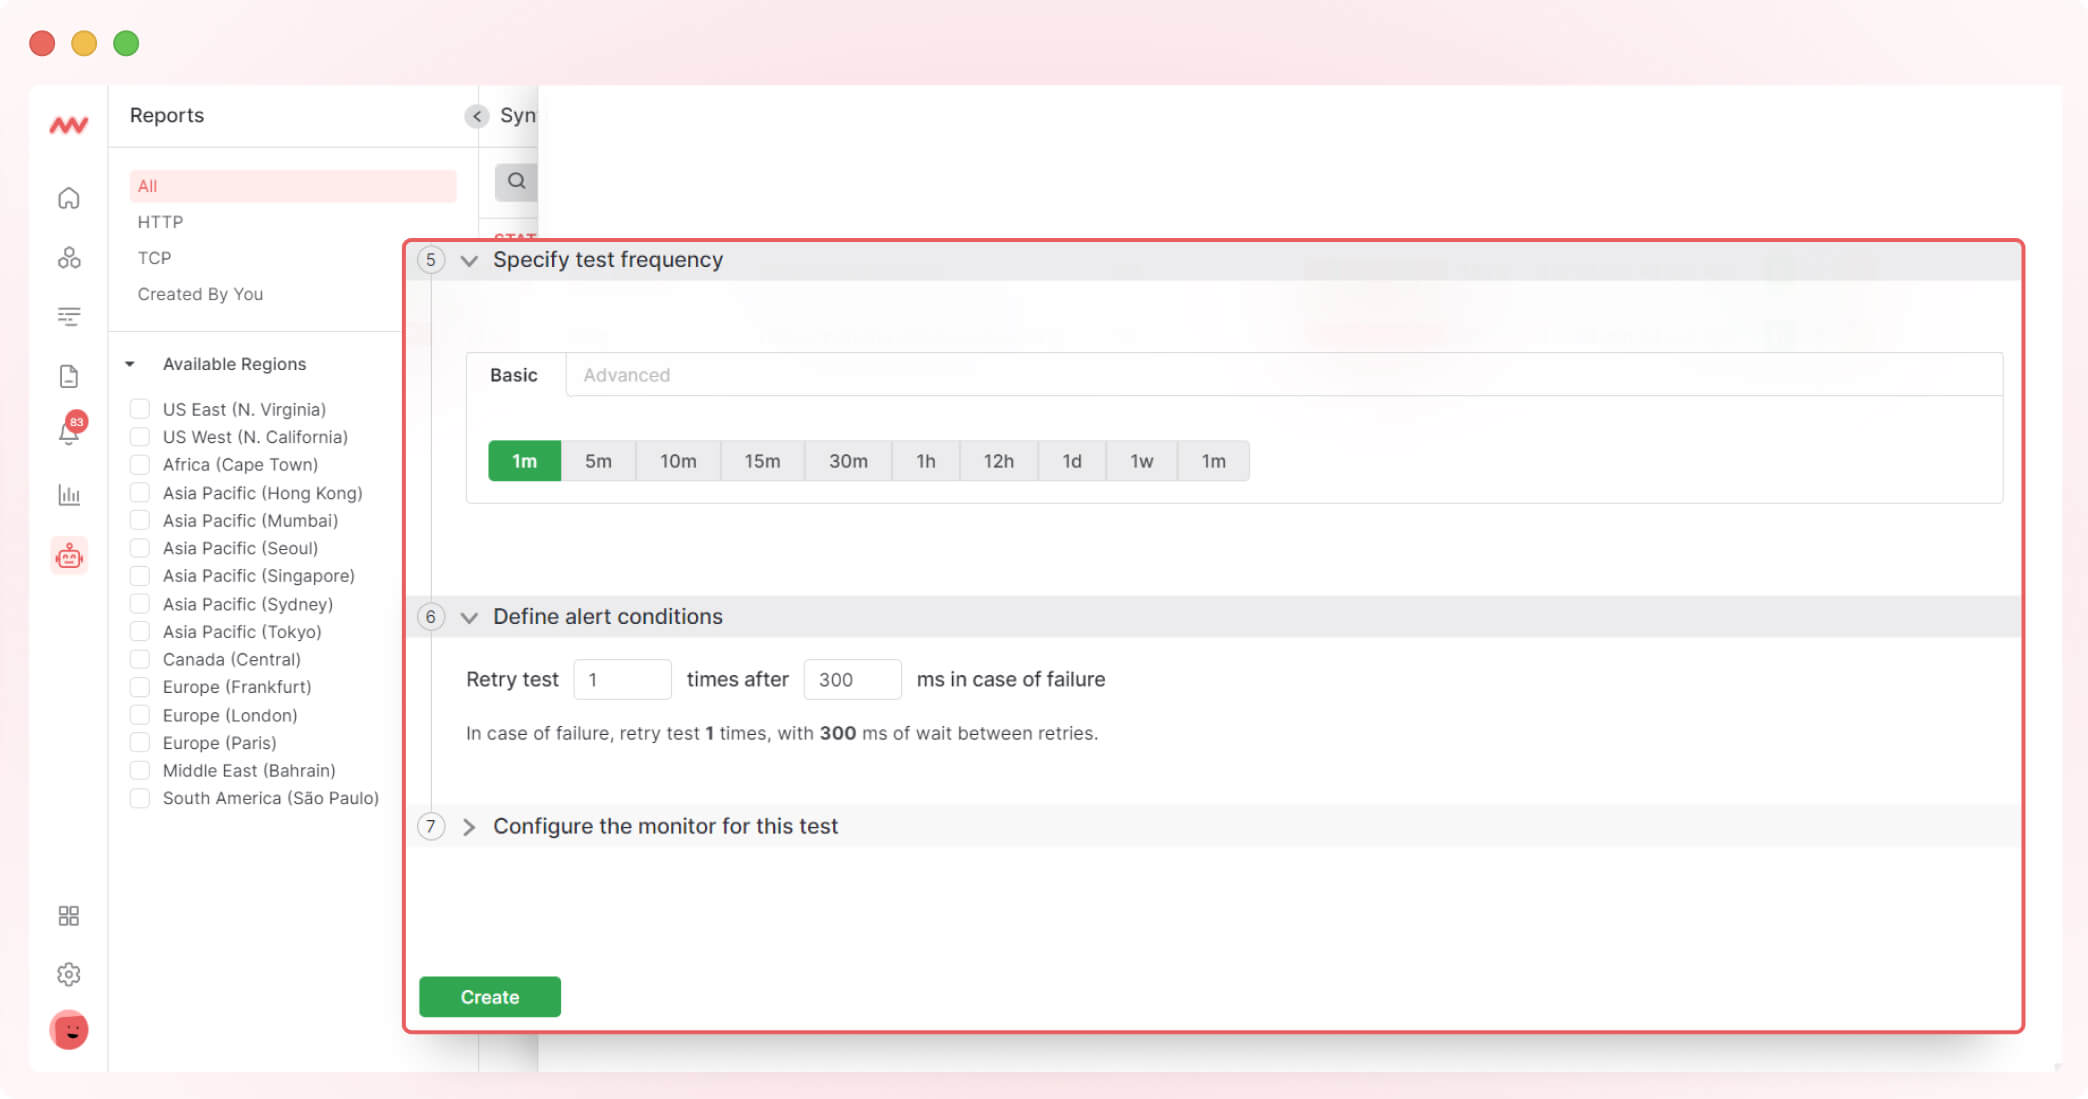
You can configure when the system should retry the test if it fails.
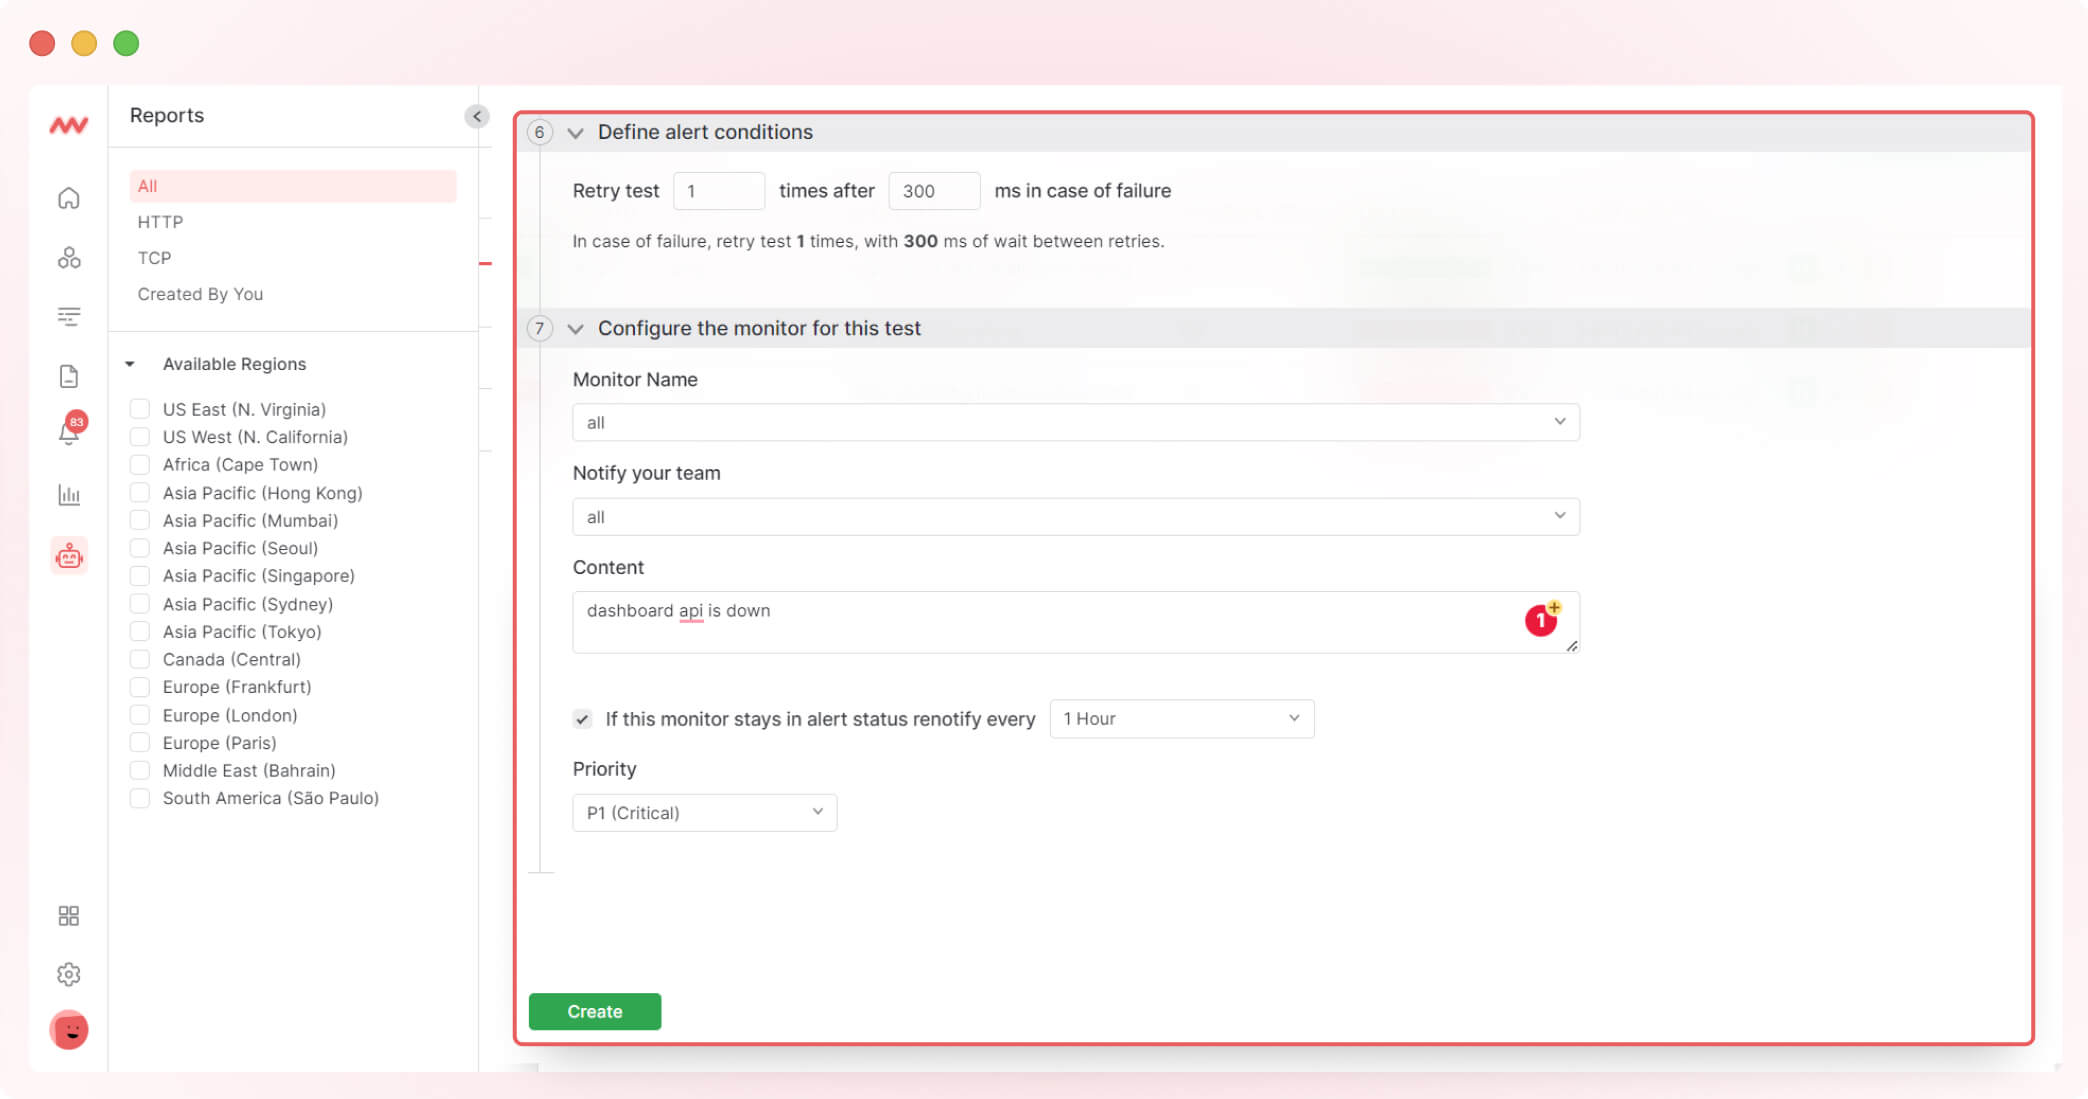
Step 5: Configure the alert monitoring for the test
You can choose who to notify and what to notify about your test.
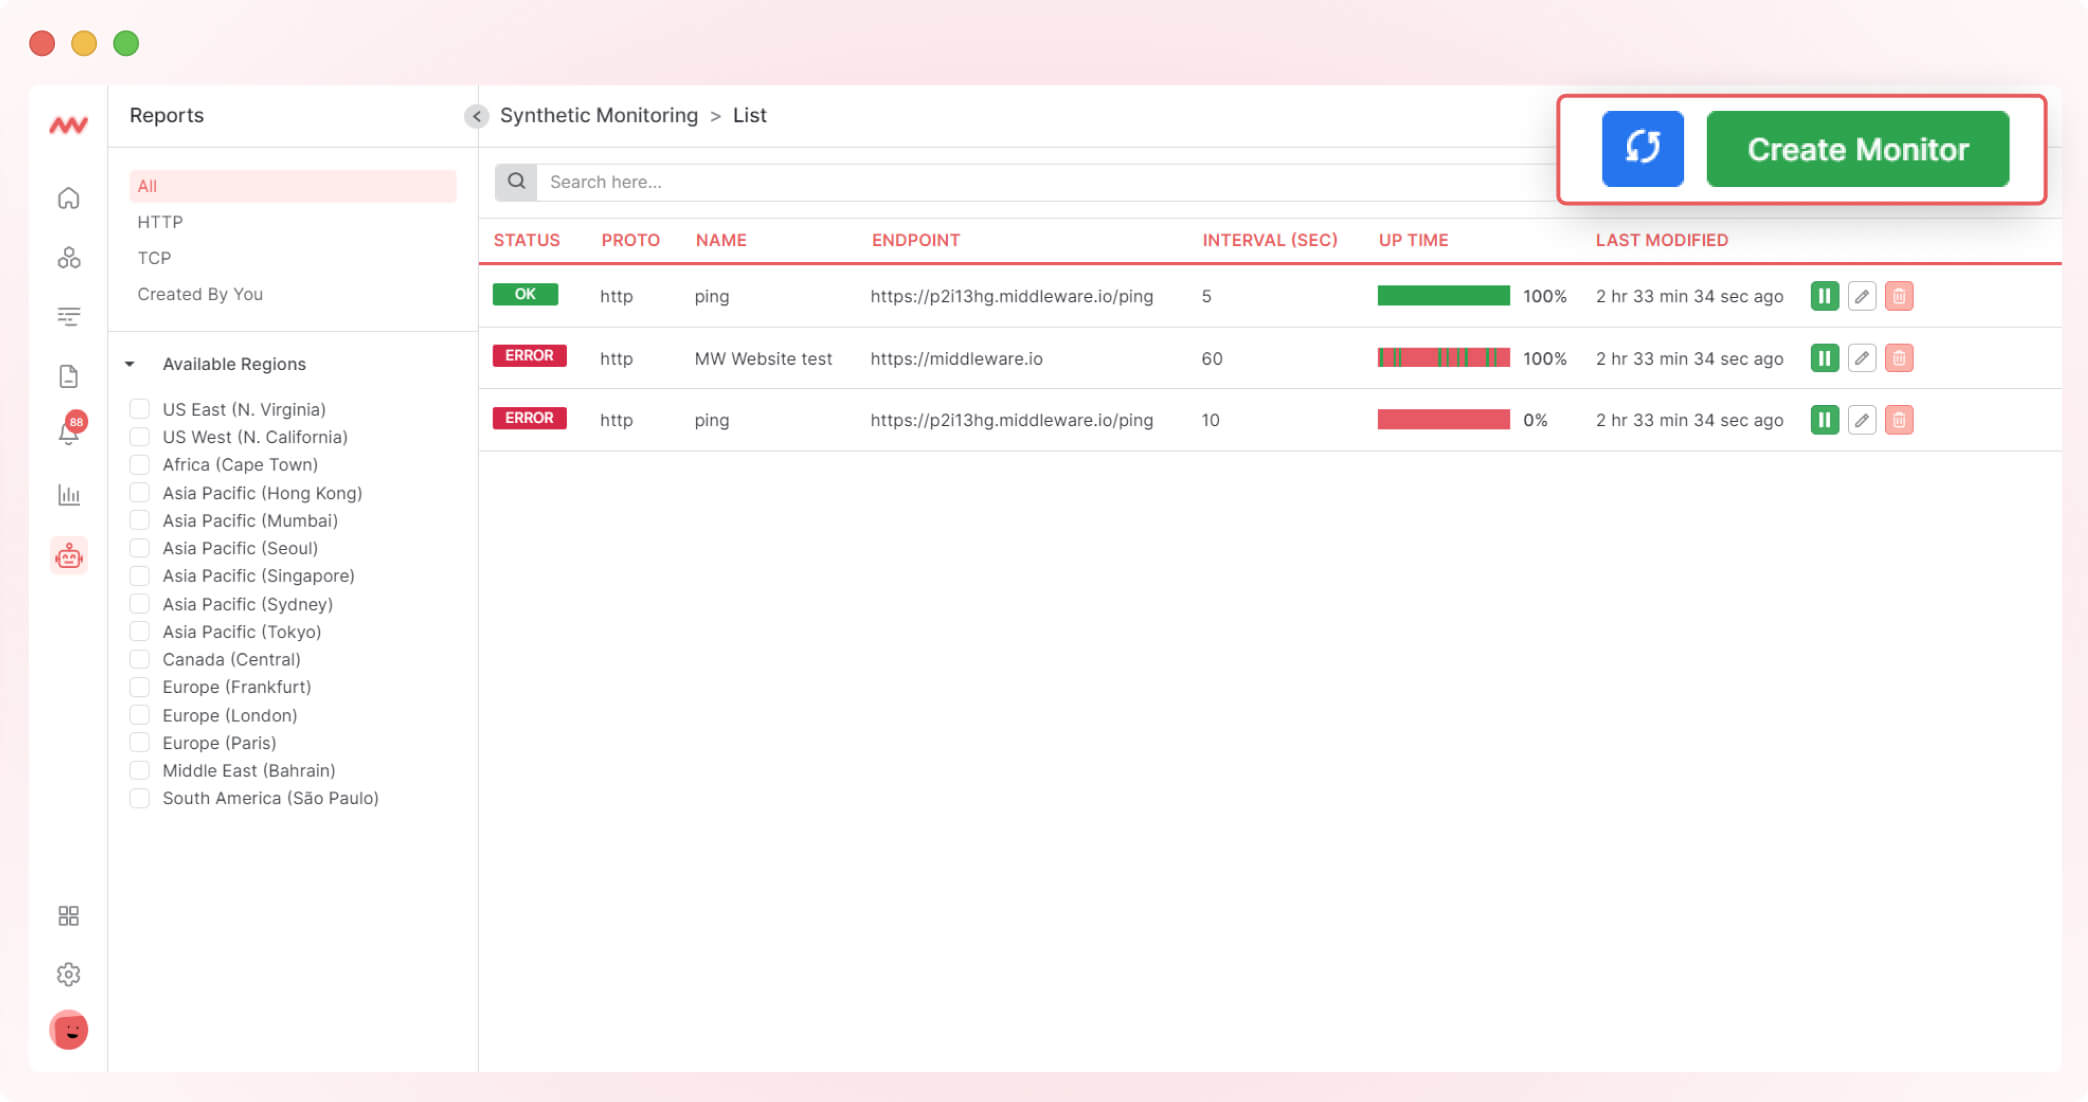
View your tests and their details
List of all created monitors
View a list of all monitors with information such as uptime, interval, status, and the ability to pause/start, edit, or delete the test.
You can also filter the list by request type or location.
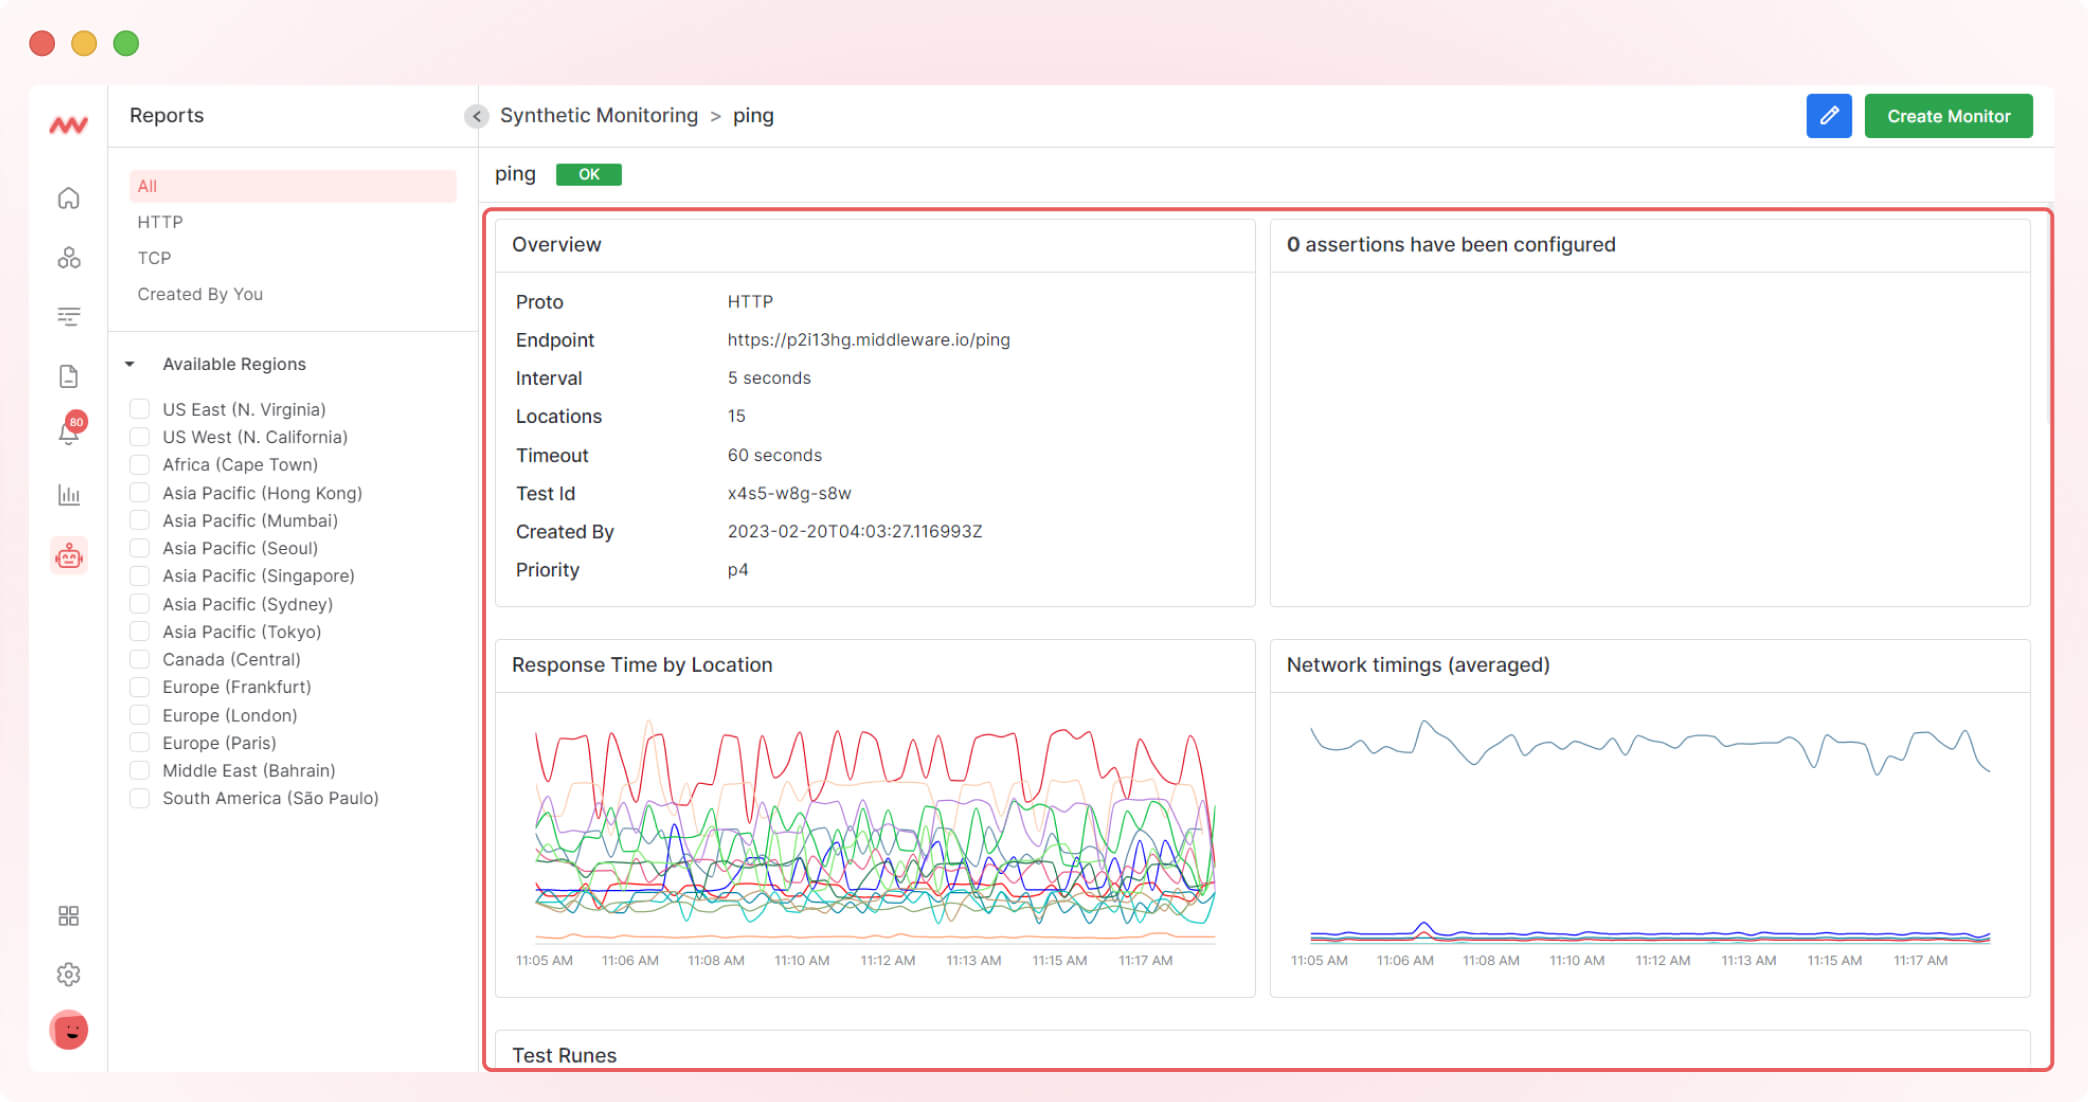
View details of specific test
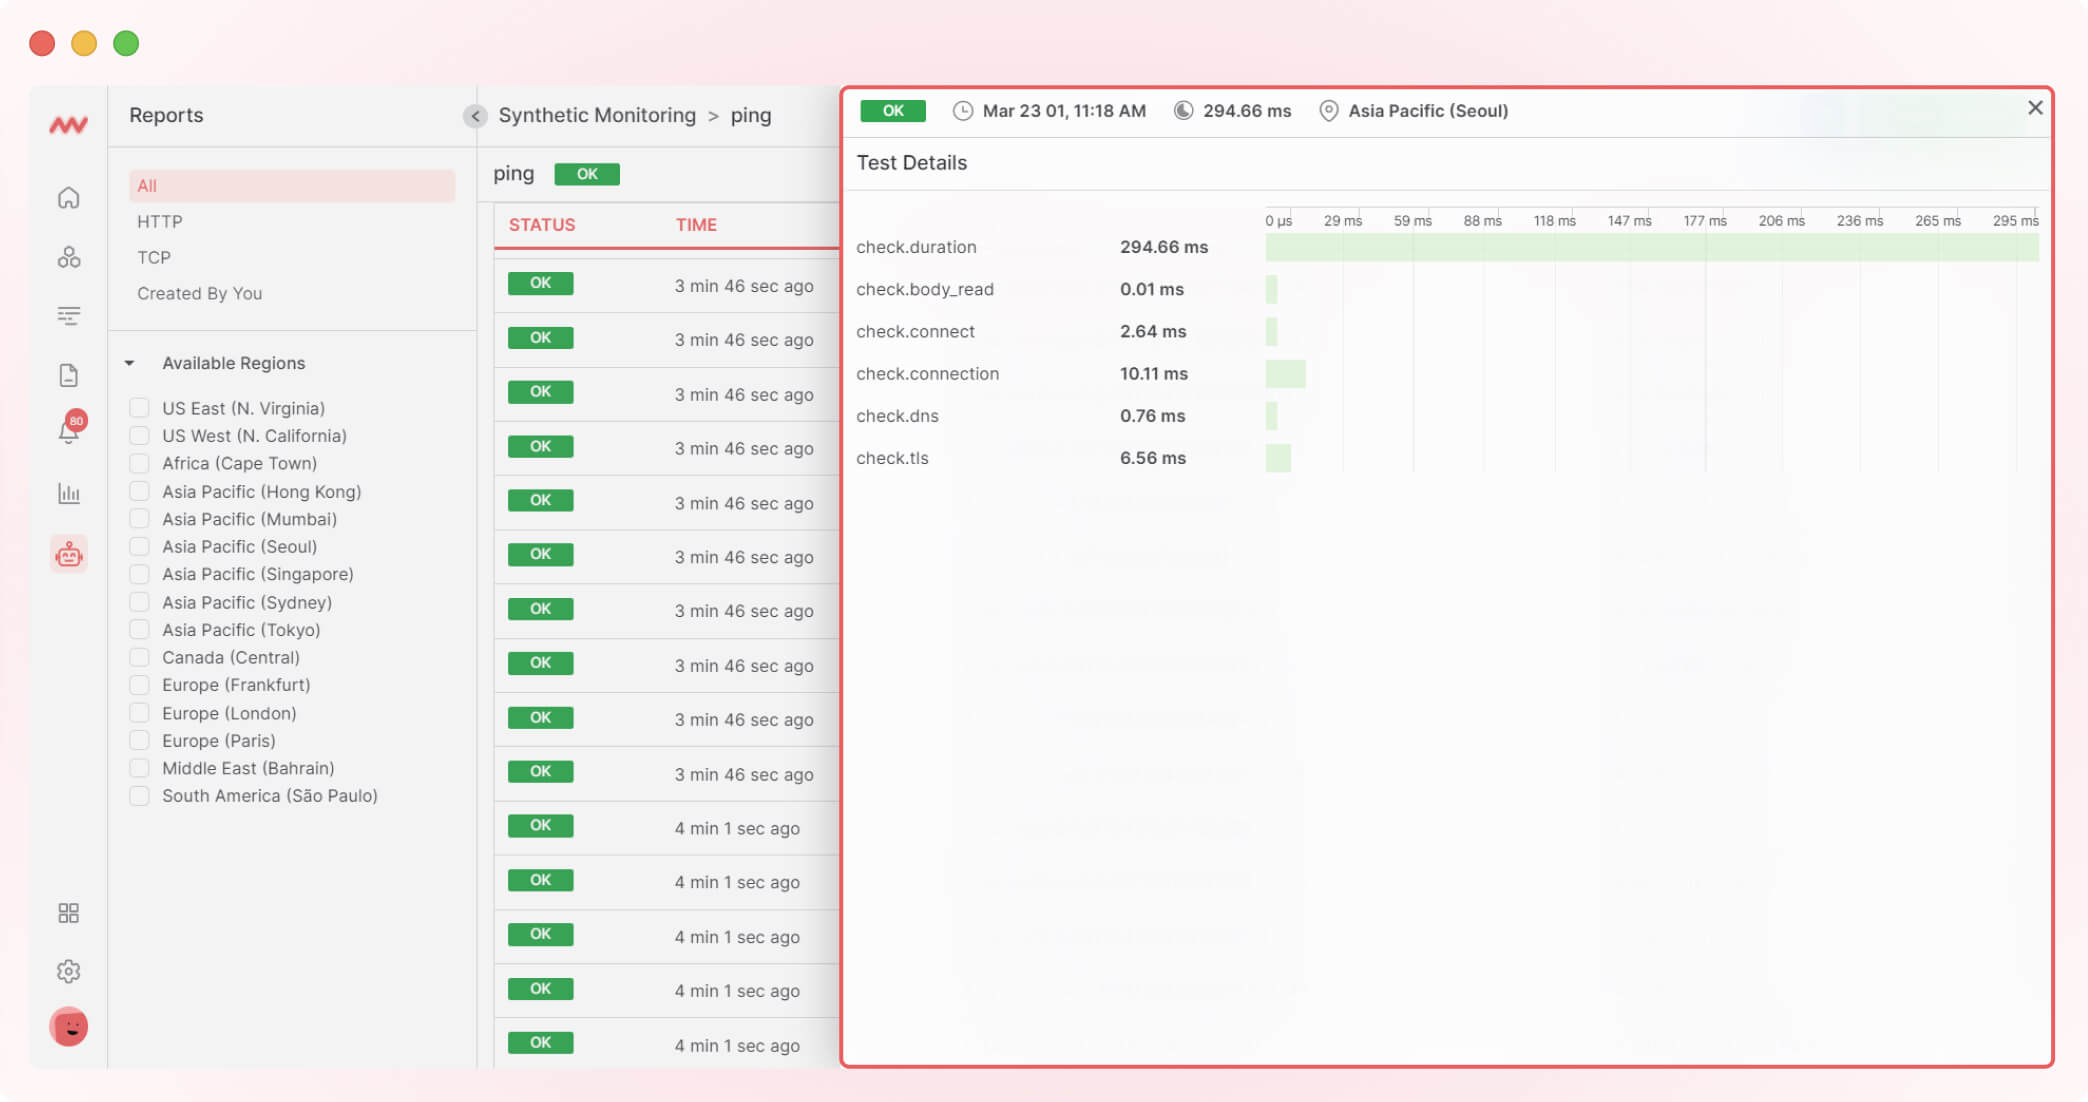
Select the test from the list to view all the details, including response time by location, network timing, and test run results.
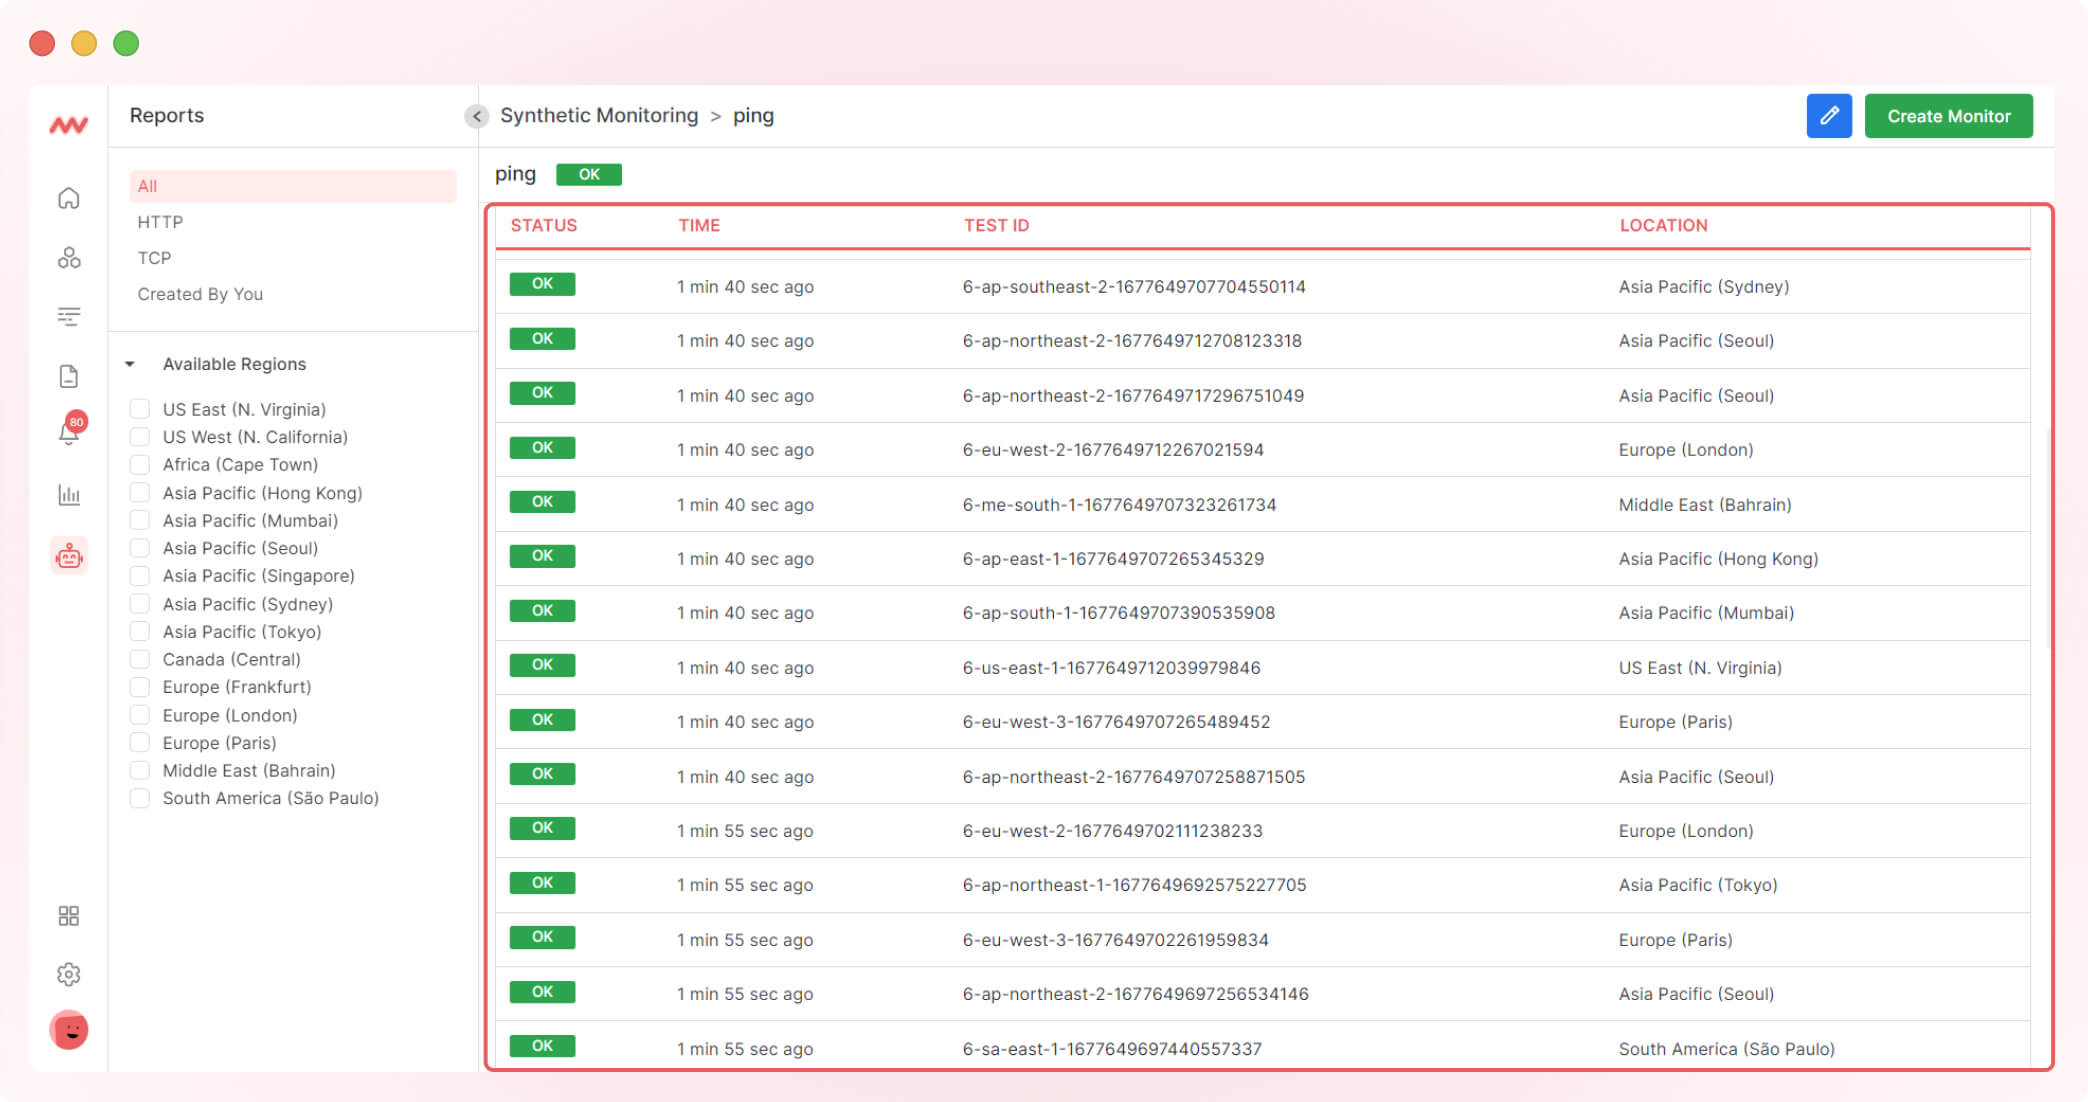
View details of a specific result
You can view the response time timeline for each test result.
2. APM updates
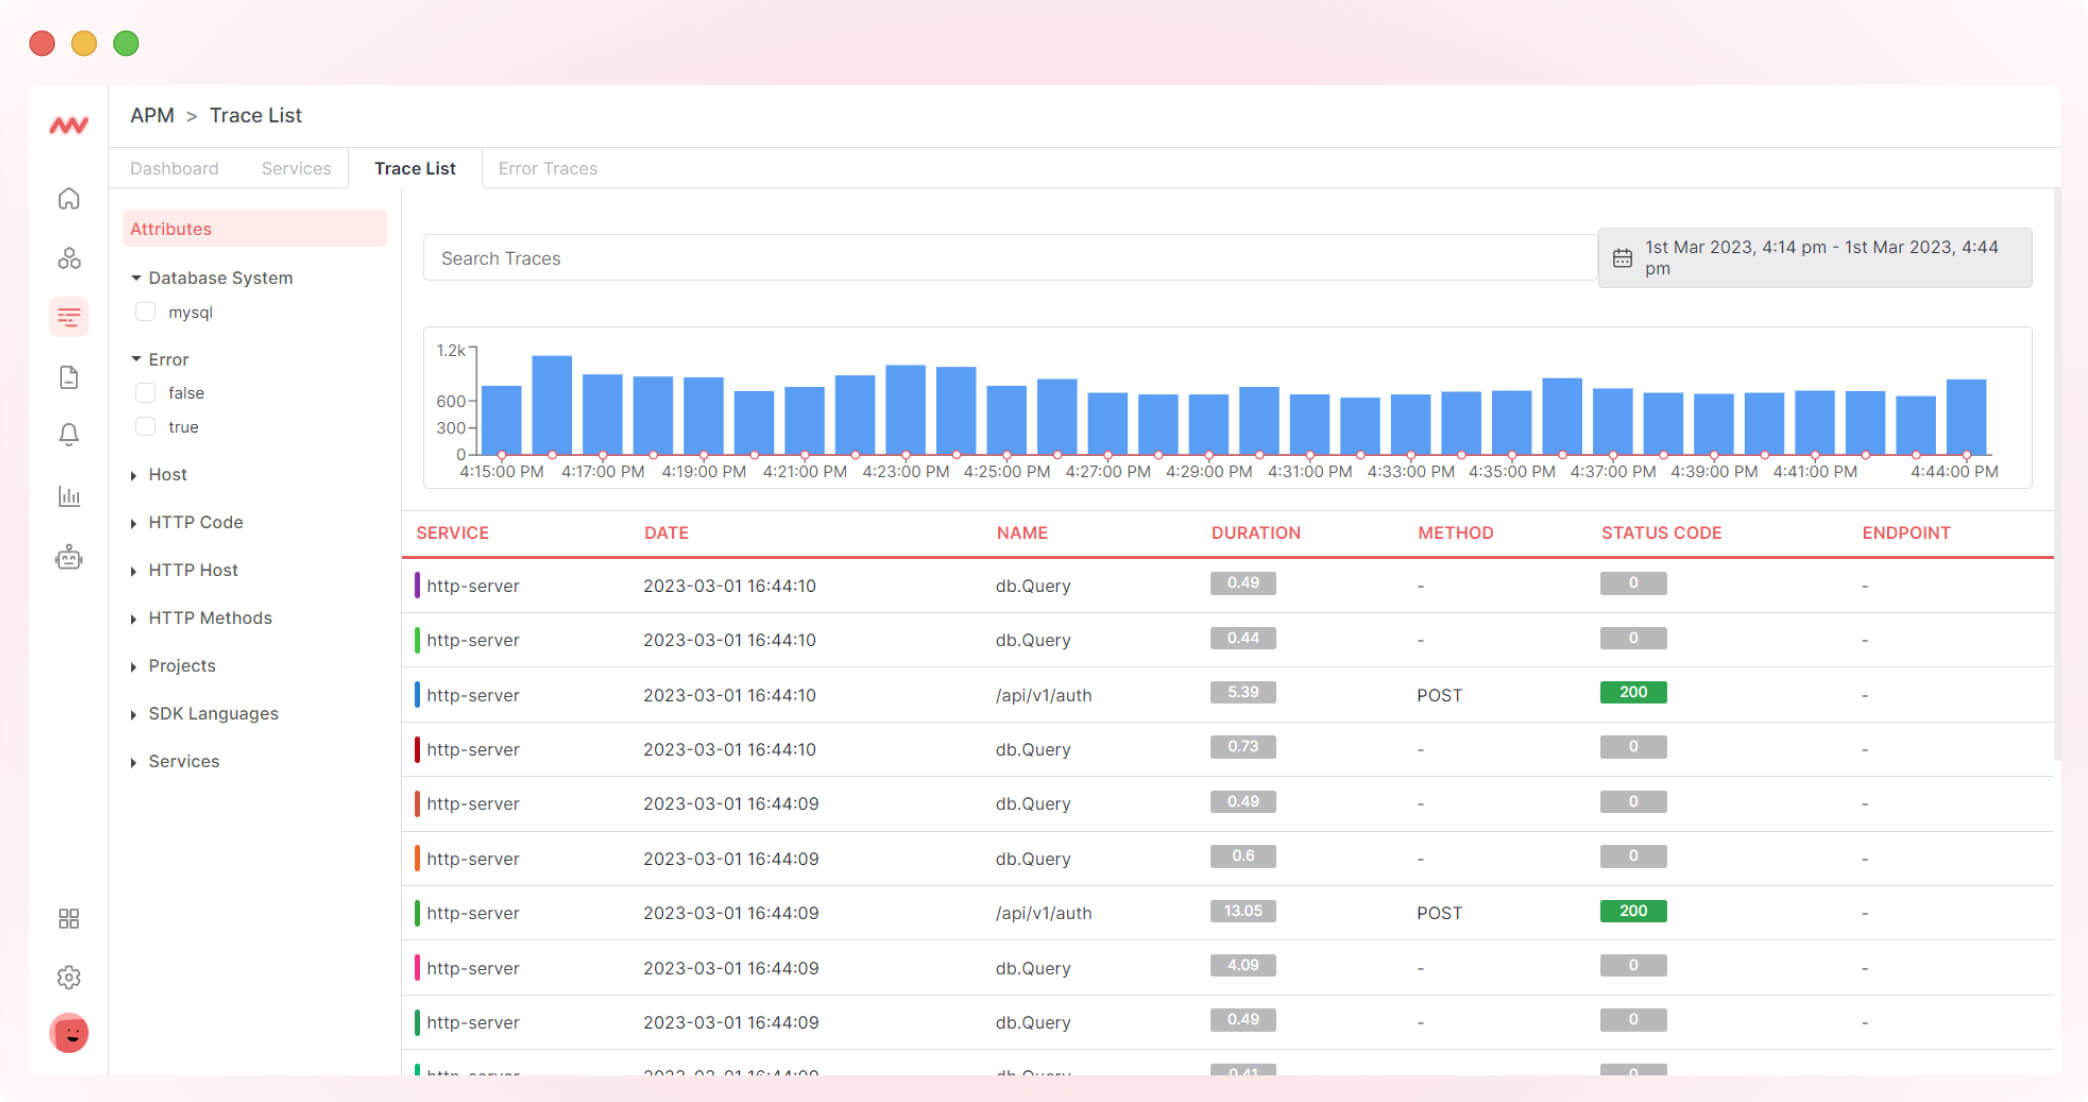
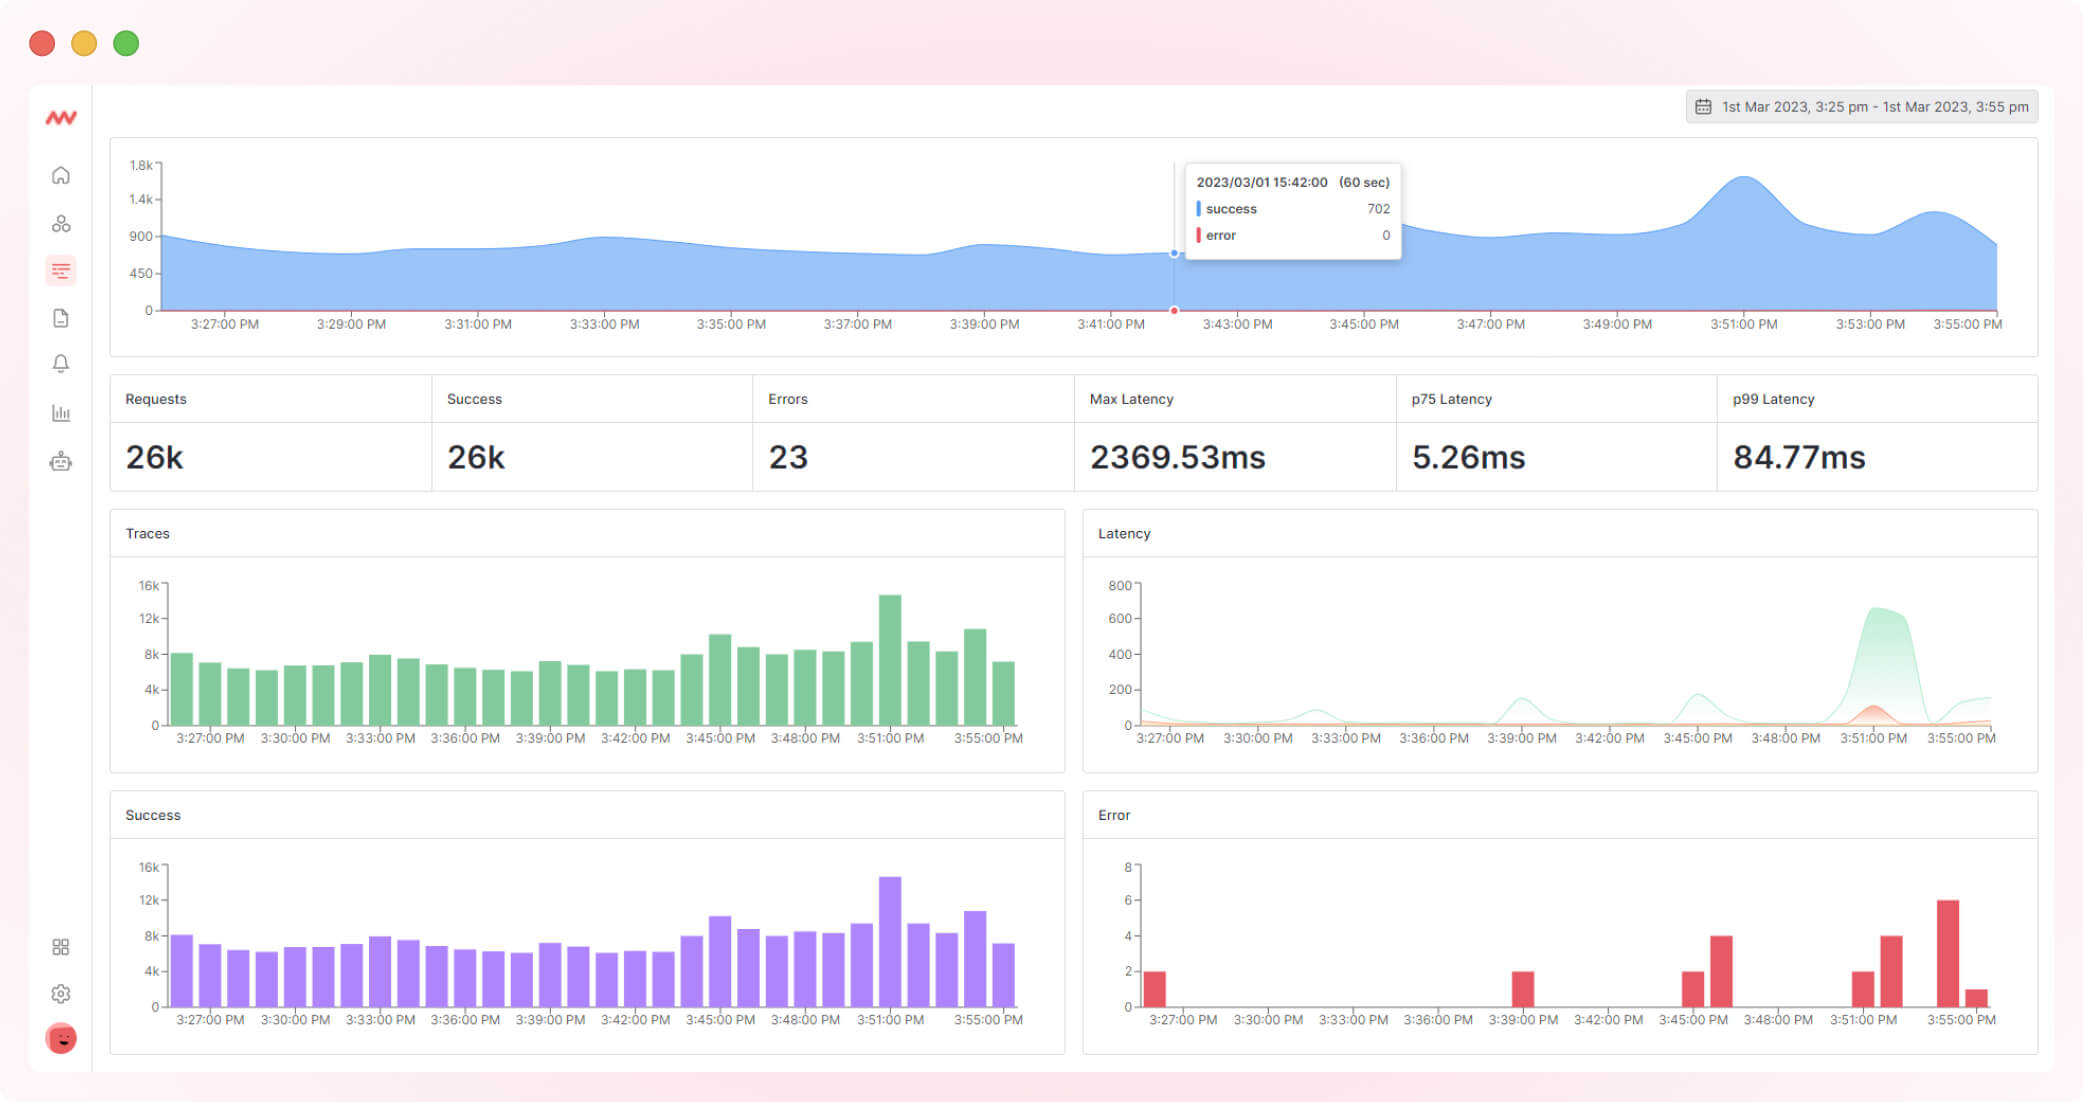
APM with an improved user interface and charts for better visibility of traces and other data.
3. Alert update
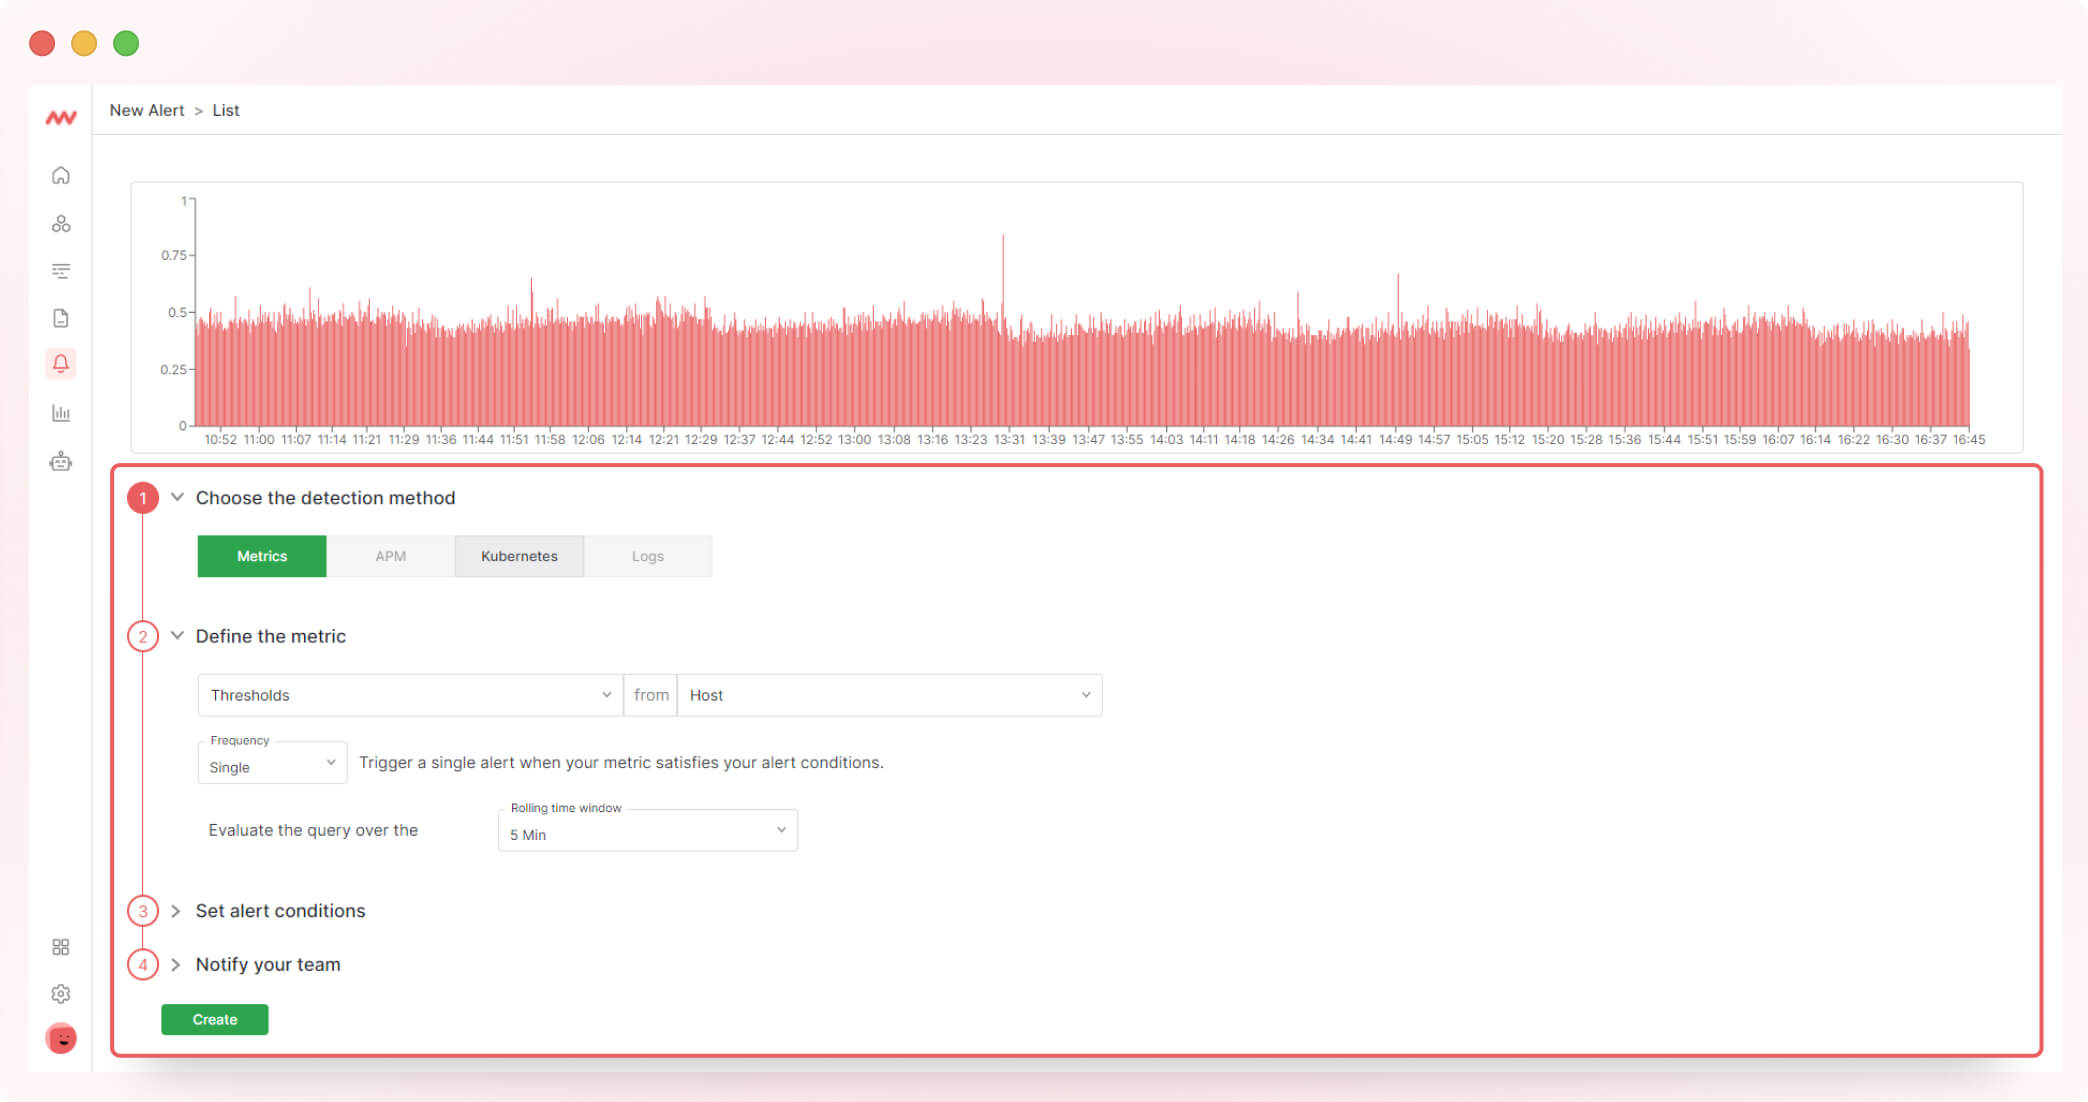
With this updated Alert UI, you can define the rule and set the alert condition all in one screen. The chart data will be filtered based on your selected criteria, giving you a better idea of your data so you can set alerts accordingly.
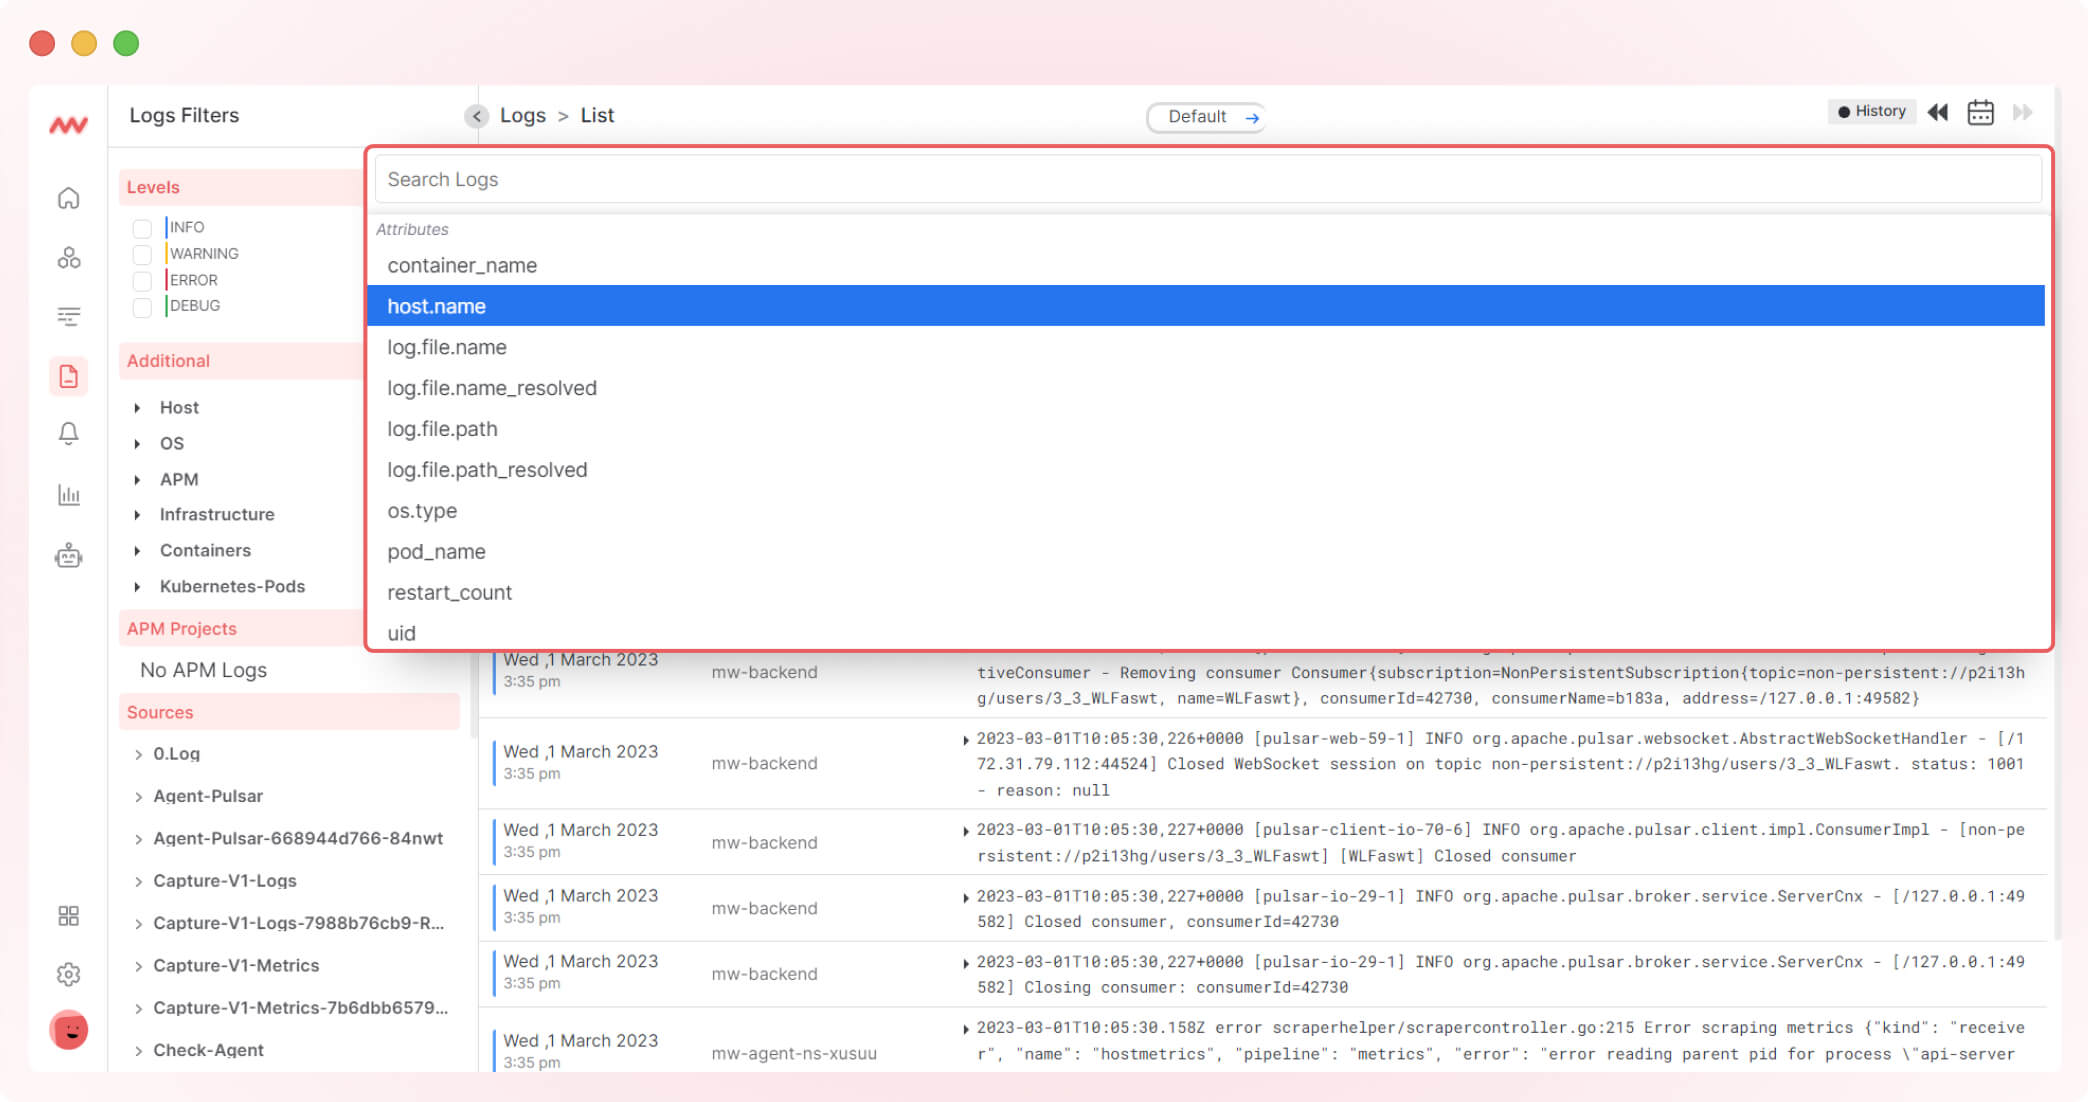
4. Log filters
Use filters and advanced search for logs to get log data. In the search bar, select multiple parameters as per your need and get the data accordingly.
That’s it from our February updates! Stay tuned by subscribing to our newsletter for more updates.
