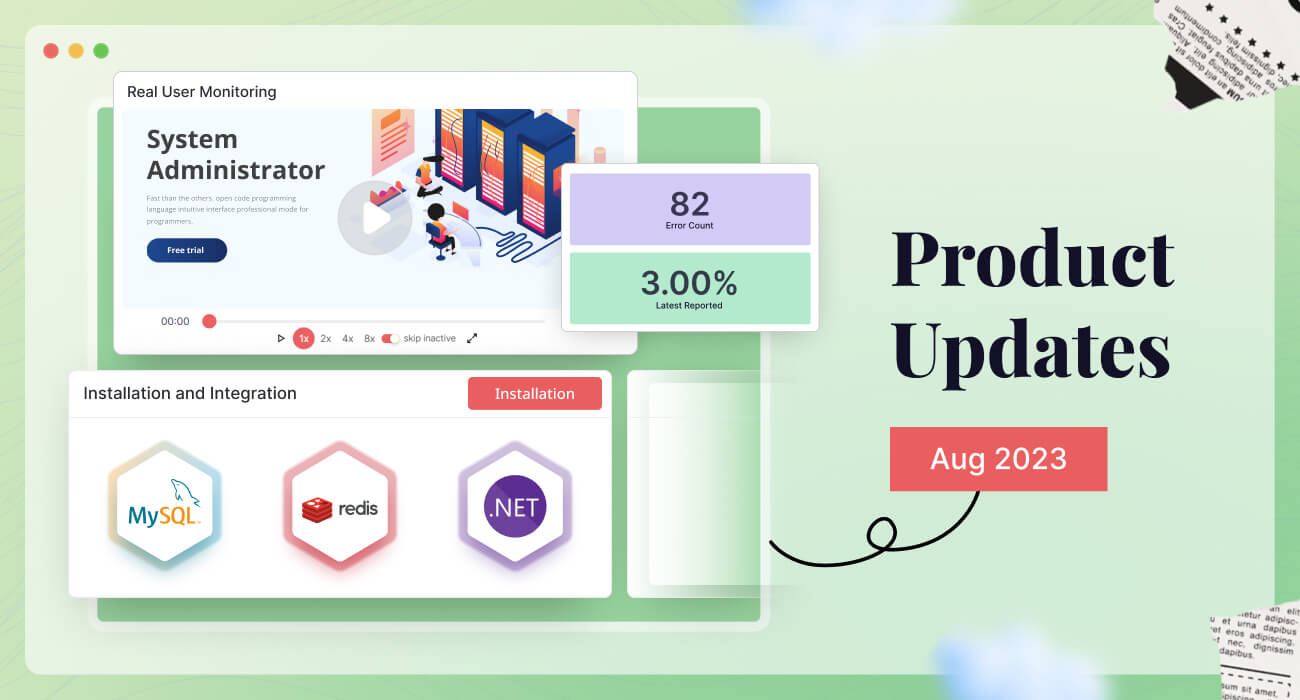
We’re constantly evolving based on customer feedback and are excited to share the progress we’ve made over the past month!
We have new integrations with databases and APM. We also launched the much-awaited feature for frontend monitoring, RUM.
See below for more details.
Product Features
1. Real User Monitoring (RUM)
Get end-to-end visibility into the user journey for web applications. Collect data such as clicks, page loading, and time spent, visualize it in the RUM Dashboard, and view session replays to understand user behavior.
Set up RUM in no time by reading our official docs or by following along with this video:
2. MySQL Database Integration
Track the performance of your MySQL database with Middleware for enhanced insights into query performance and database health.
You can monitor database operations, DB objects such as schemes, tables, etc., and view key SQL events in Middleware.
3. .NET APM Integration
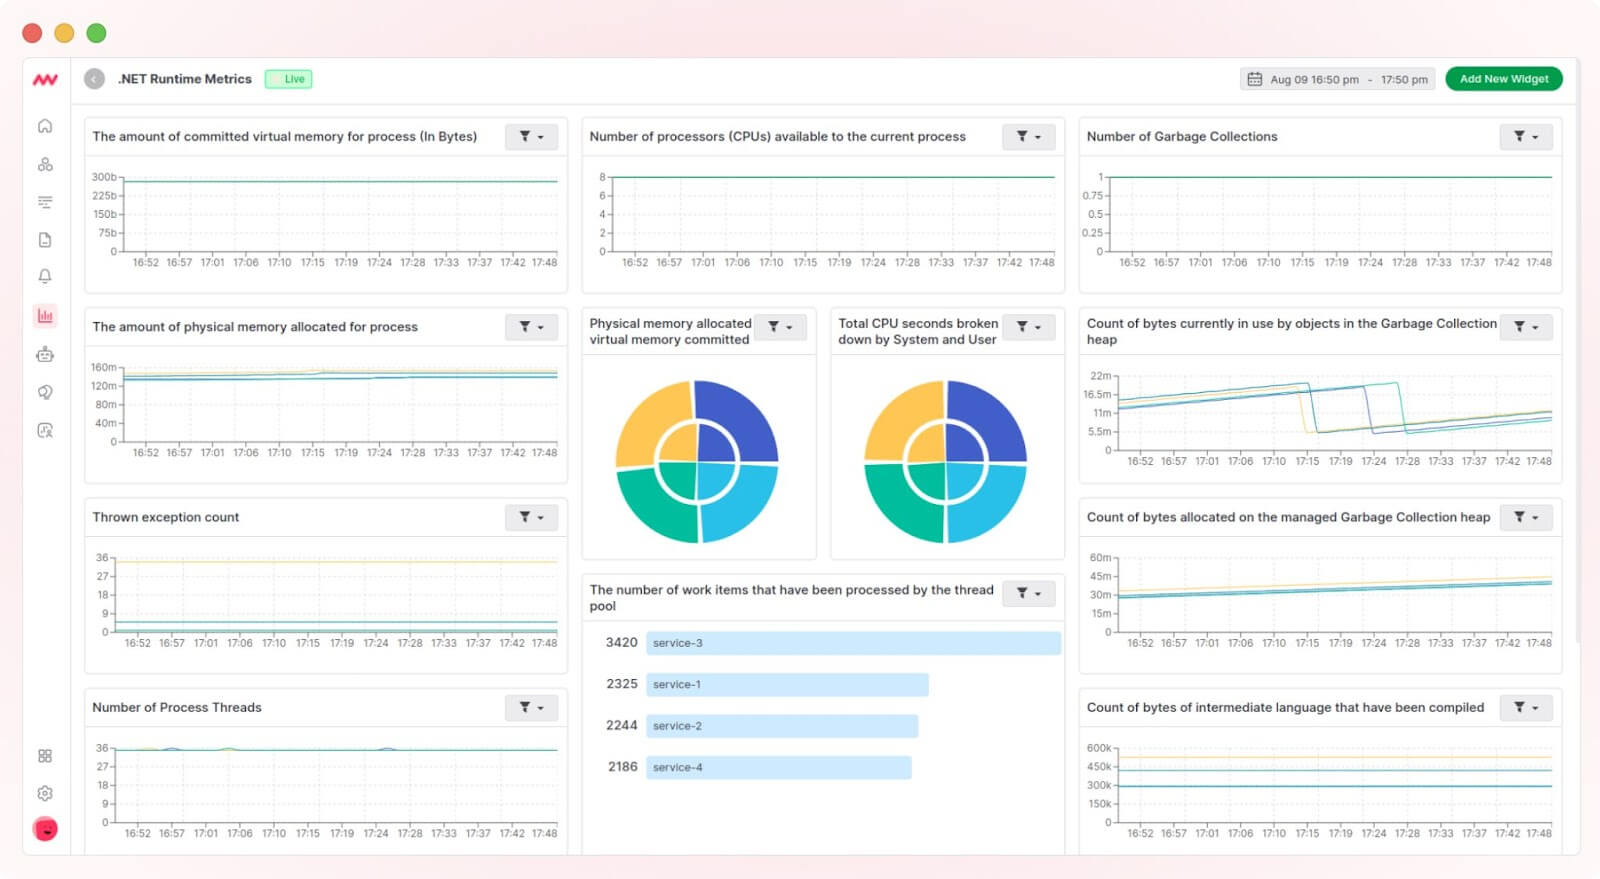
Get end-to-end visibility into your .NET application with our .NET APM integration.
You can collect application metrics, profiling information, logs, and traces and improve application performance.

4. Redis Integration
With this integration, you can store, visualize, and correlate metrics between Redis and the rest of your stack, improving visibility into your infrastructure’s performance.
Improvements
Multiple routes in alerting
You can now use a single APM alerting rule for multiple HTTP/GRPC routes simultaneously, so you won’t need to create duplicate alert rules for each of your HTTP/GRPC routes.
Improvements in logs
Now you can search logs with queries and filter logs by time frames for easy access.
That’s all from last month. Subscribe to our newsletter for weekly product updates and recommended reads from us.
