We’re constantly evolving based on customer feedback and are excited to share the progress we’ve made over the past month!
From new integrations with Prometheus Kubernetes to simplified pricing and the launch of our much-awaited LLM Observability feature, here’s everything you need to know:
Product Features
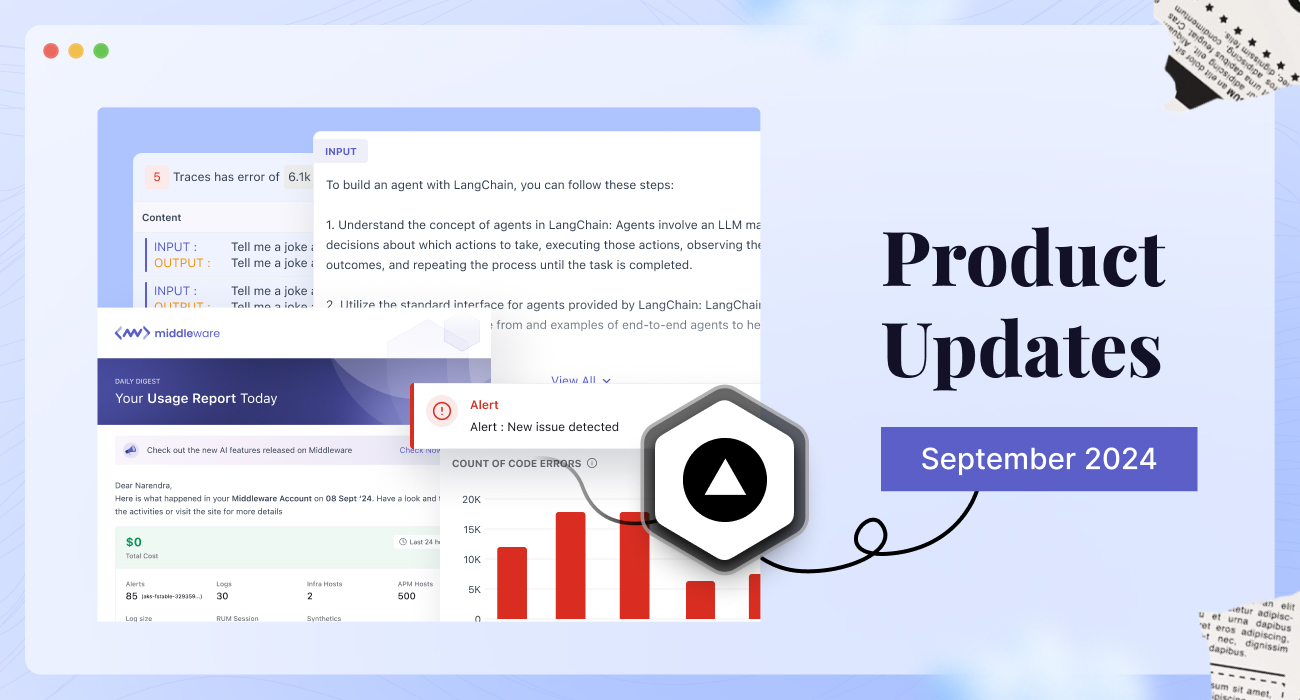
- LLM Observability
- Monitor your LLMs with detailed traces and key metrics. View all critical metrics in a single dashboard to improve your LLM’s performance. Read more about how to enable it and use it.
- Simple Pricing
- We’ve streamlined our pricing model! With our pay-as-you-go plan, you get access to all features under one plan—with no hidden costs. New pricing: $0.3/GB for metrics, logs, and traces. Read more about our updated pricing here.
- Daily Digest Email
- Stay informed with a daily summary of your infrastructure and application health, delivered straight to your inbox. Never miss an important update again.
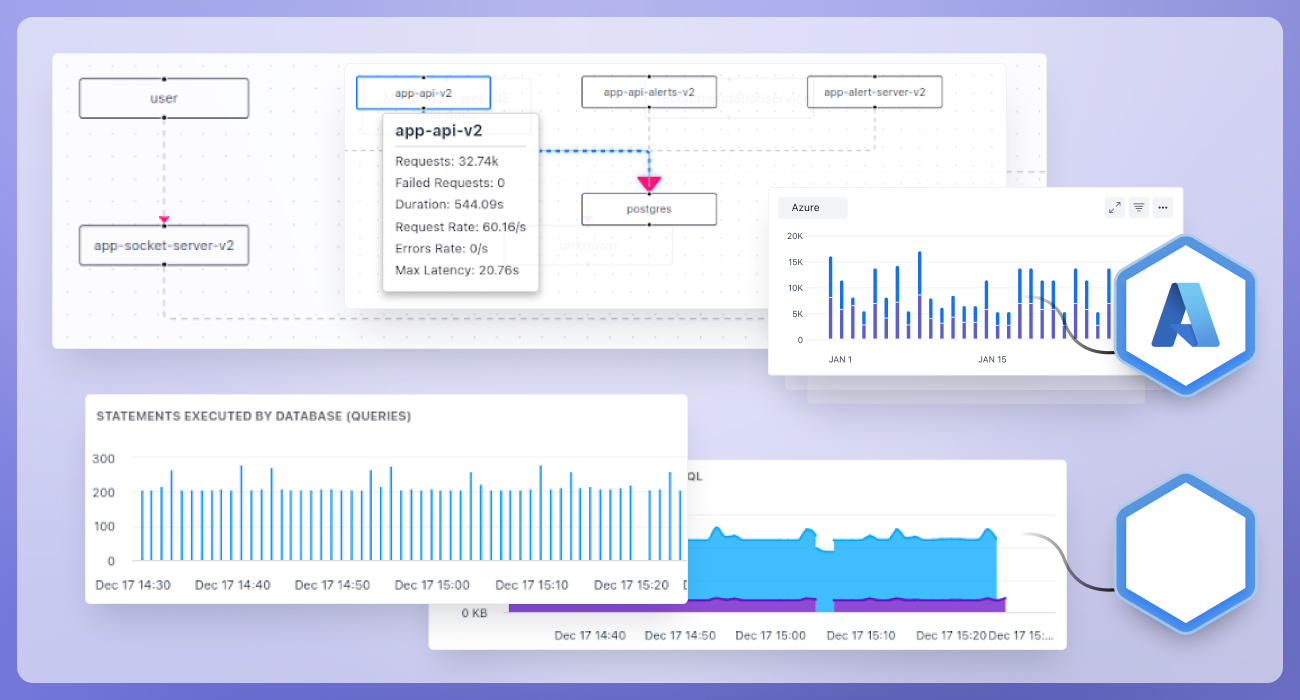
- Prometheus Kubernetes Integration
- Integrate seamlessly with Prometheus Kubernetes using our new common Prometheus scraper. This eliminates the need to add sidecars to each deployment or Daemonset, making integration much easier.
Improvements
- Vercel Integration
- Middleware now supports firewall log drains for improved Vercel integration.
- Kubernetes Monitoring
- Expanded data and metrics for better Kubernetes performance monitoring.
- View YAML for K8s nodes and pods, and compare two YAML files from different points in time.
- UI Improvements
- APM: New views for flame graphs, waterfall views, and service maps for improved span and trace request analysis.
- Ability to filter spans by parent and child span types.
- Live Data Mode
- Live data streams are now available for the past 15, 30, and 60 minutes, directly in the date filter.
- Usage-based Alerts
- Monitor usage effortlessly with alerts triggered by data sizes for metrics, logs, and traces.
That’s all for last month! Subscribe to our newsletter for weekly product updates and expert recommendations from our team.


