We’re constantly evolving based on your feedback and are thrilled to share our progress this past month! From new features like Status page, Agent pipeline to enhanced integrations and performance improvements across our platform, here’s what’s new:
🚀 New Product Features
Status page
You can now create a status page for your services to monitor uptime and communicate more effectively with your users. Keep your customers informed about incidents, outages, and maintenance using built-in incident management tools.
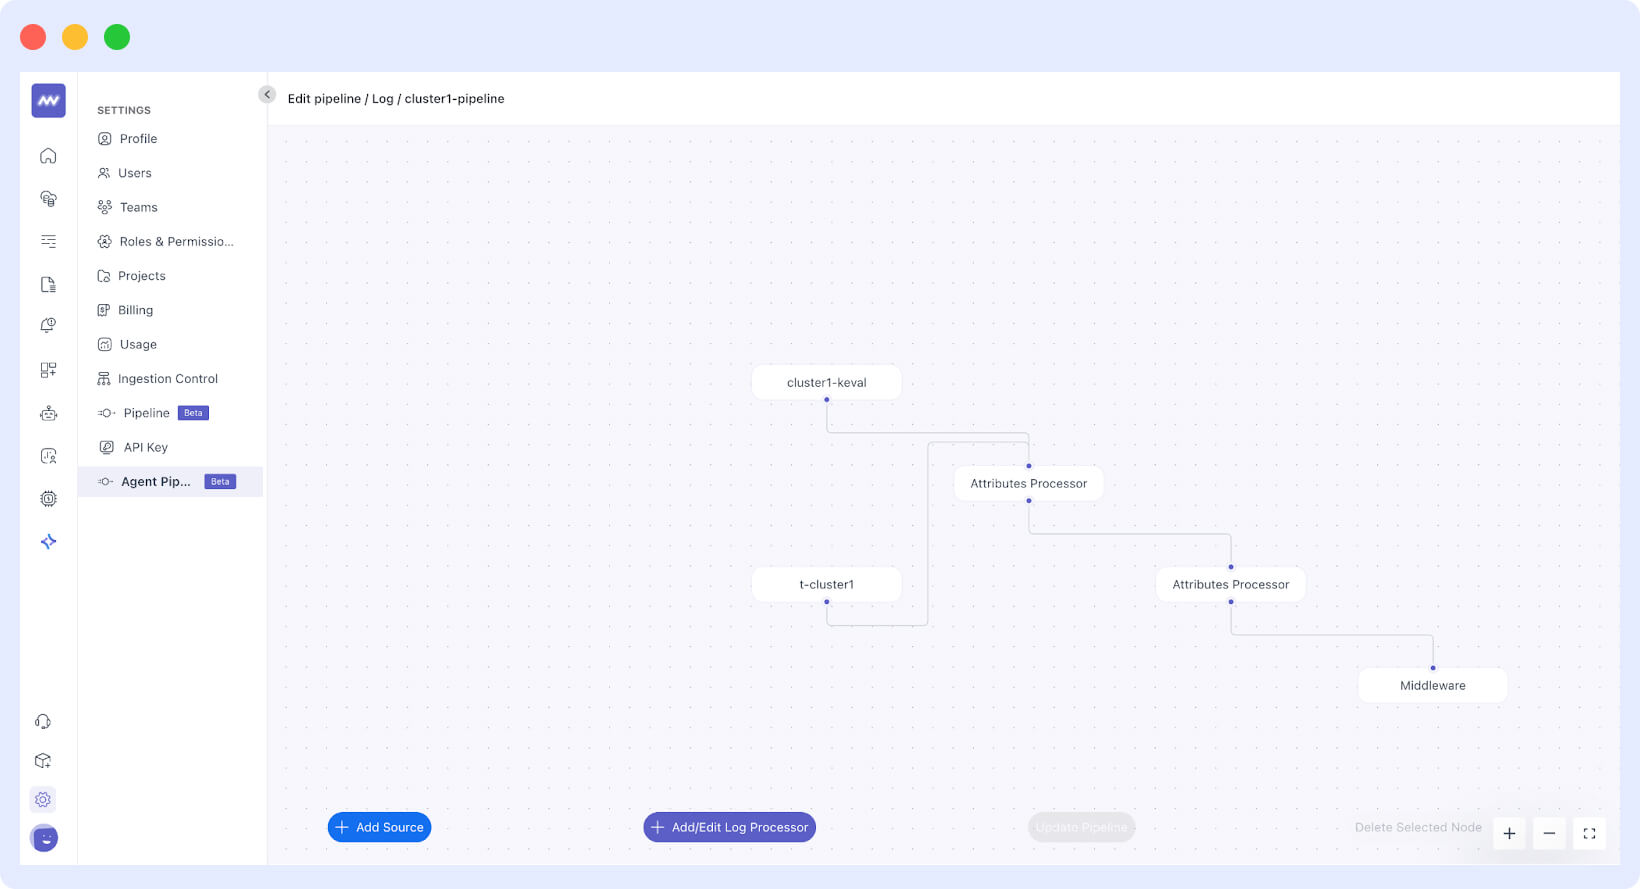
Agent Pipeline for logs
We’ve added support for creating agent pipelines. You can now select a source, add or edit log processors, and define what logs, metrics, or traces should be collected from the agent side.
To get started, go to: Settings → Agent Pipeline
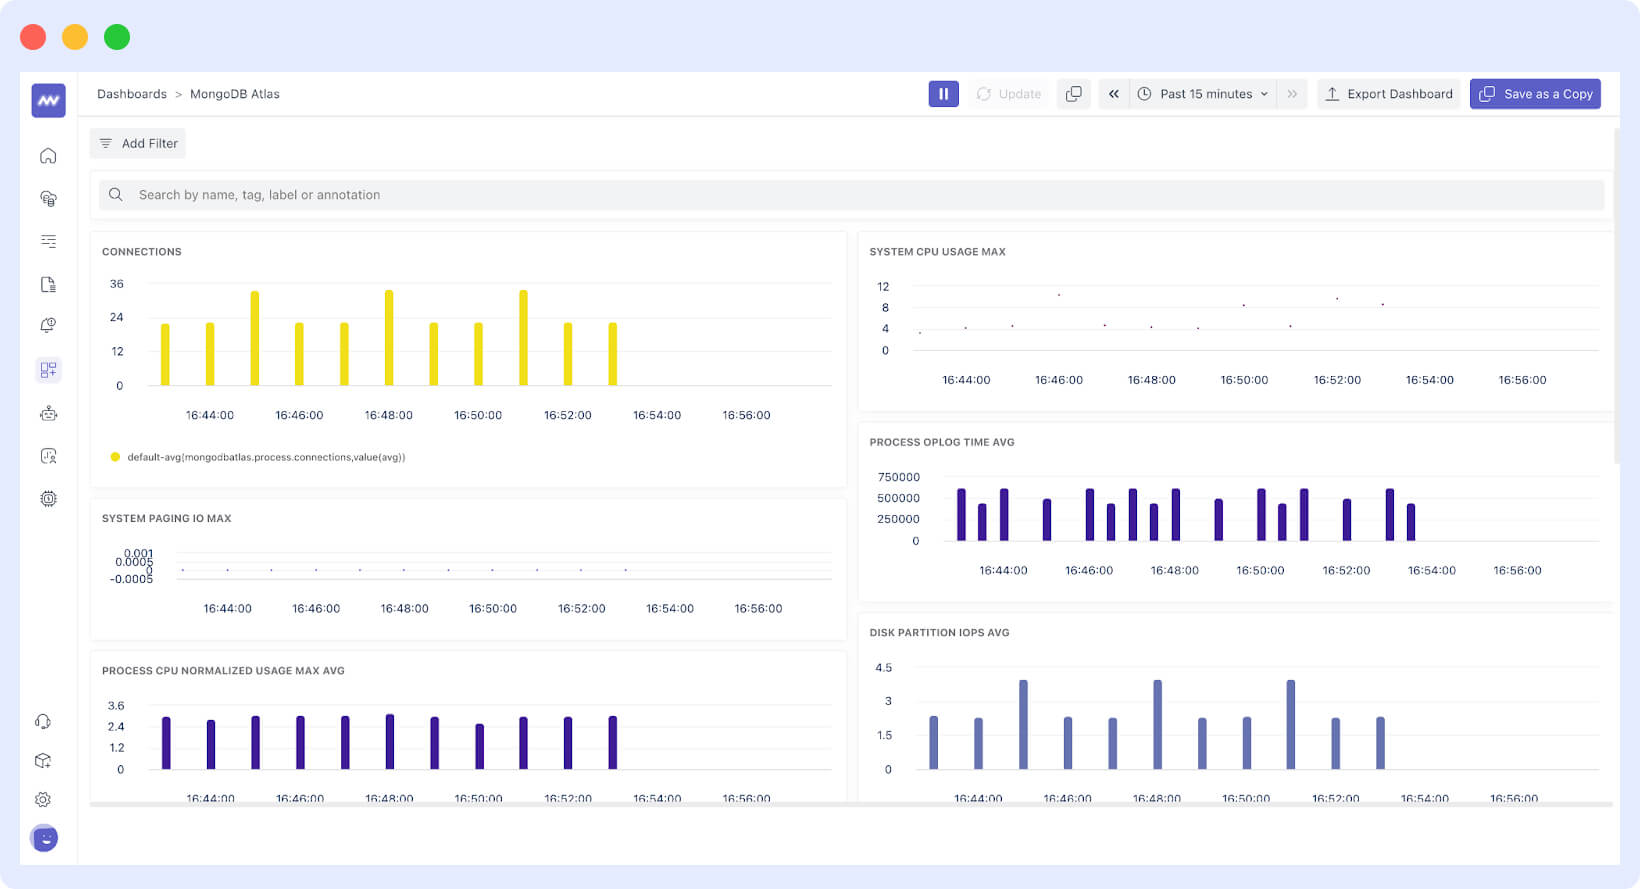
MongoDB Atlas integration
You can now collect performance and health metrics from your MongoDB Atlas database. Integration is simple—check the documentation for steps and start monitoring your MongoDB Atlas data quickly.
Downstream service graphs in APM
We’ve added visual graphs for downstream services in APM. You can now view total time spent, total requests, and average time per request for downstream services.
Find this under: APM → Service → [select a service] → Downstream Services tab
🛠 Improvements & Enhancements
Alerts
- You can now customize access for each alert rule, giving better control over who can view or modify them.
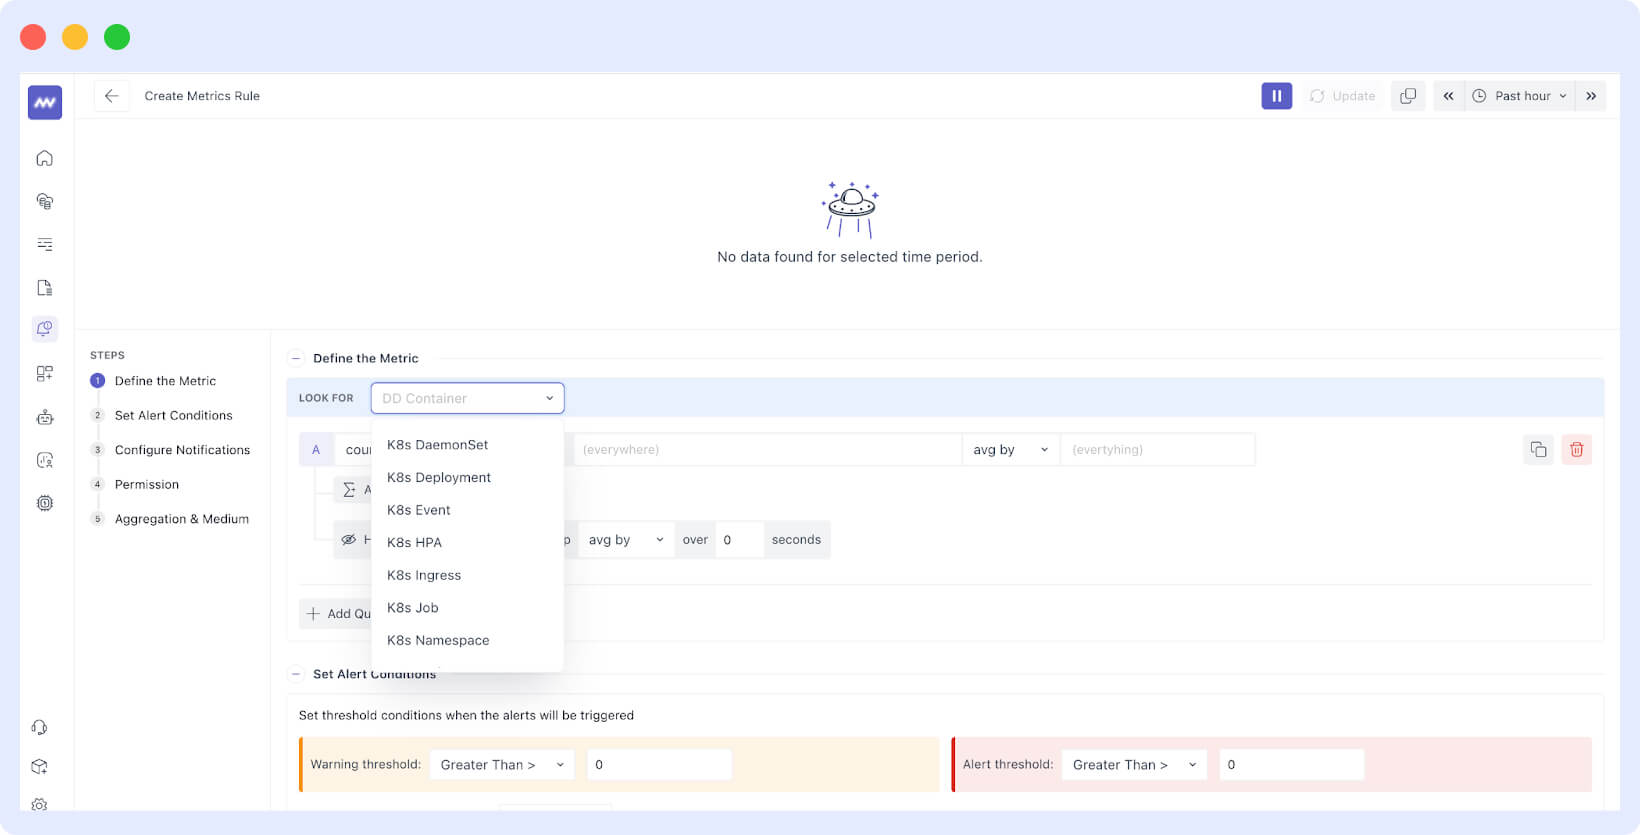
- We’ve added the ability to select a category to help you quickly find related metrics when setting up alerts.
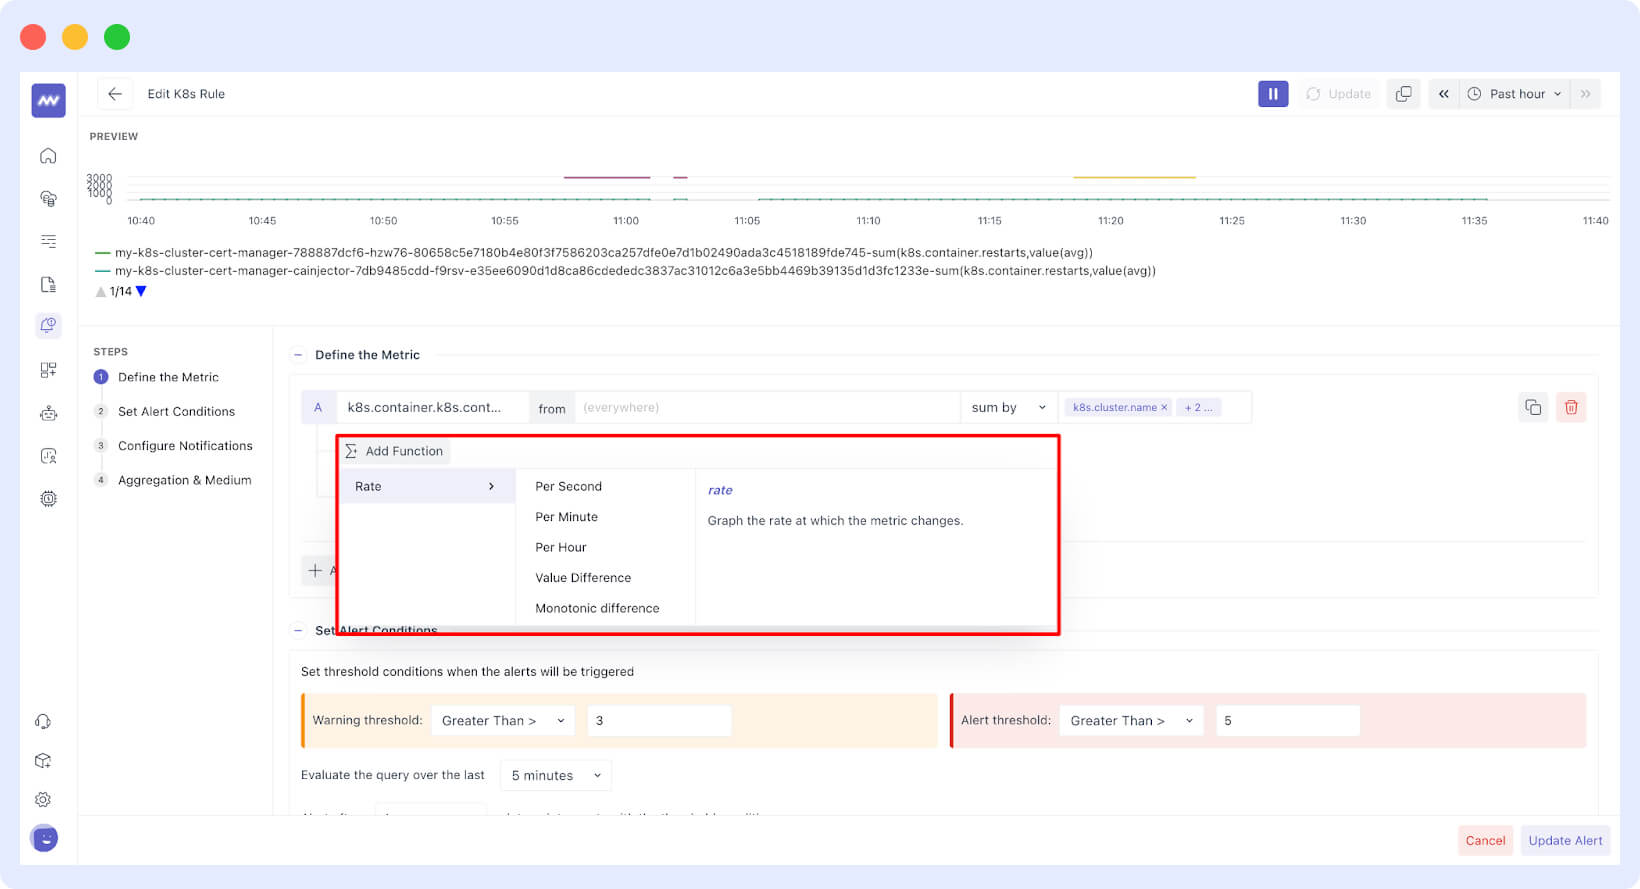
- A new rate function is now available. It helps improve accuracy for alerts like pod restarts by tracking changes over time more effectively.
Metrics ingestion control
You can now monitor the size of each metric being ingested. This feature also allows you to enable or disable metrics based on your requirements.
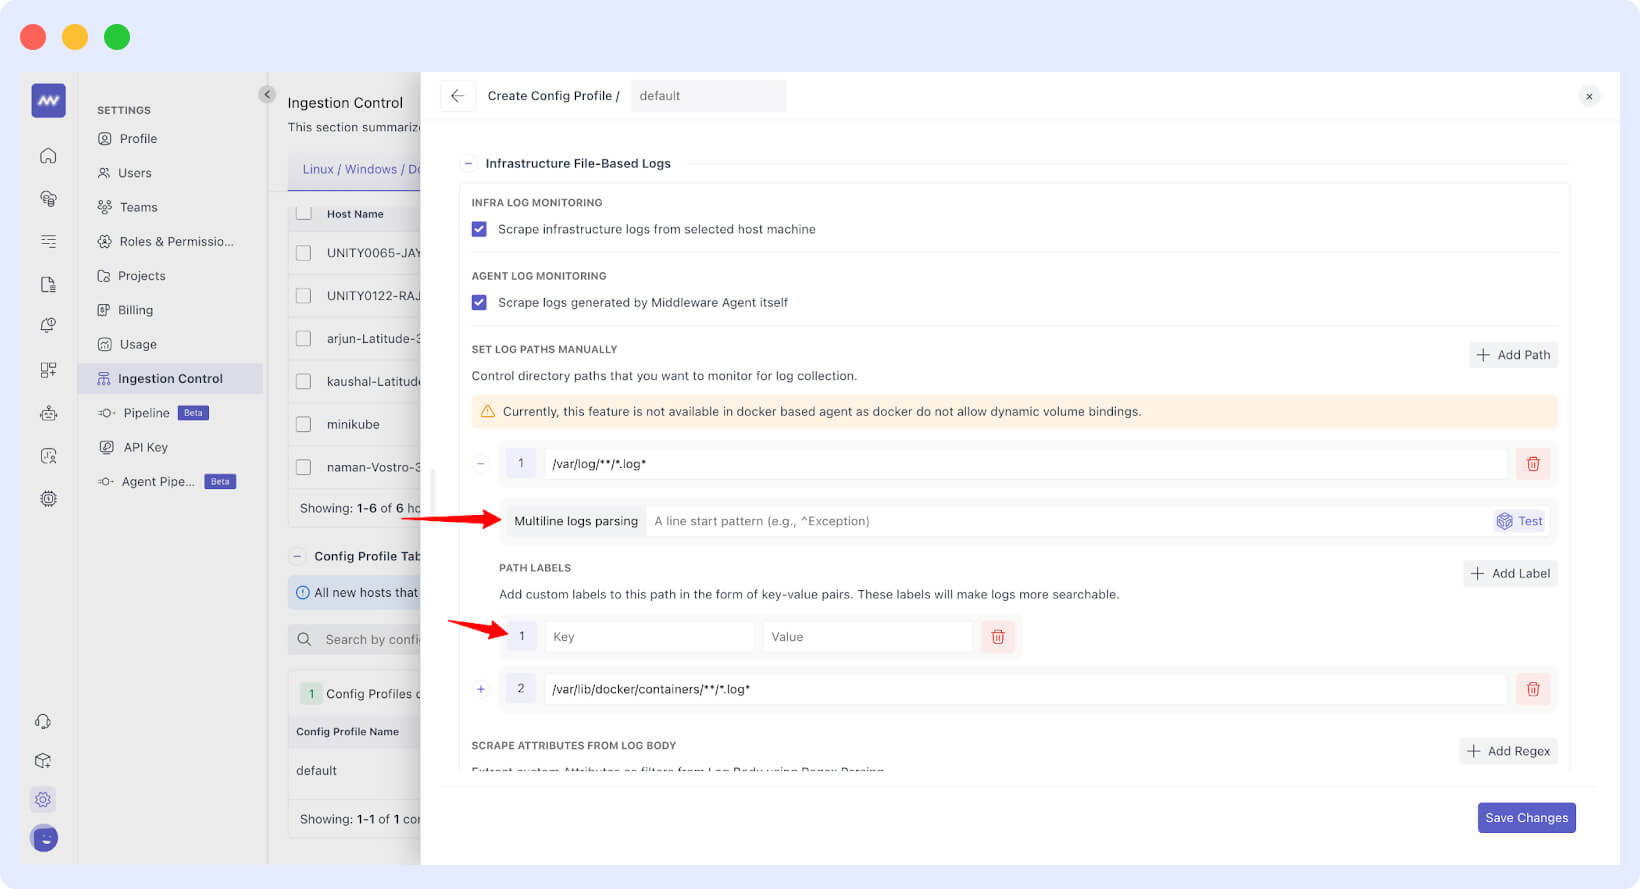
Added capability to add resource attributes in filelogs
Multiline log parsing is supported, and the path label can now be set at the log path level—giving you more flexibility when collecting logs.