
In the quest for software excellence, the devil is in the details. Every line of code, database transaction, and system event can significantly affect an application’s overall performance and reliability. The fine-tuning of these intricacies separates great software from the rest.
However, as software systems grow in complexity, managing and understanding these intricacies becomes more difficult due to the sheer volume of data generated.
This is where “log transaction queries” come into play.
Log Transaction Queries—a method used to access the historical records of events or database changes—provide valuable insights into application behavior for developers and analysts.
These queries facilitate transaction footprint tracing, swift bottleneck identification, and error pinpointing.
This article delves deeply into log transaction queries and provides insights into their role in process analysis.
Understanding Log Transaction Queries
Log transaction queries refer to the query operations performed on logs for extracting specific transactional information. Logs record transactions within software systems to assist IT experts in understanding user patterns, recovering files, identifying system bottlenecks, and conducting database audits.
Transaction logs typically record activities related to specific transactions, enabling the analysis of system behavior and performance.
These queries allow developers to identify specific transactions, trace their flow through various system components, analyze execution times, pinpoint errors or exceptions, and detect other patterns within transaction logs.
The language used for log transaction queries may vary depending on the log management system (LMS) used. For example, the SQL Server transaction log treats transaction log data as a string of log incidents and records them with a log sequence number (LSN) and an ID.
Each new user interaction with the database is recorded at the end of the transaction log with an incrementing LSN.
Log records associated with each transaction are then connected via a chain of backward pointers to expedite transaction roll-forward and rollback procedures.
However, in rare instances when auto-recovery fails, and cluster transaction divergence occurs, IT experts need insights from logs to perform a manual rollback on affected nodes.
How to Analyze Processes with Log Transaction Queries?
Log grouping involves categorizing log data based on specific criteria or shared attributes so that each log group, reflecting a specific end-to-end context, forms a transaction. A log group may consist of records of error-resulting or completed transactions.
By grouping logs, users gain insights into patterns of transactions within log data, allowing easier identification and analysis of related log entries.
Users can pinpoint the precise moment when one of the several complicated networks of services within their application throws an error or visualize the intricate flow of data through each system component.
This knowledge allows users to develop superior applications and resolve software malfunctions quickly. These are some foundational functions of log grouping.
Other functions of log grouping are listed below:
Identifying Common Patterns
Grouping logs based on specific fields or attributes can help identify patterns within the log data. For example, suppose a user has a sizable log of end-to-end activities within their database. In that case, they can define and group logs by user ID to form transactions that offer qualitative insights into individual customer behavior.
Log grouping also provides insights into numerical observables such as the number of users requesting specific services, the number of transactions per hour, times between transactions, or the number of minutes it took to complete particular transaction types.
Identifying Outliers
Log grouping helps highlight outliers or anomalies within the log data. By examining groups with significantly higher or lower values, you can identify potential performance issues or irregular behaviors.
For example, after defining numerical observables, a univariate outlier detection method can be applied to analyze odd occurrences within the application and remediate them.
Troubleshooting and Root Cause Analysis
When users group logs based on error type, timestamp, or originating system, usually via a log identifier, they can identify patterns related to specific issues, such as high latency or system errors. This helps streamline the troubleshooting and root cause analysis process.
Resource Optimization
Resource logs offer insights into the system infrastructure’s operation, health, and availability. Log grouping allows you to analyze and aggregate data related to resource usage, such as CPU or memory utilization. This helps you identify resource bottlenecks or areas where optimization is needed.
Log grouping is an immensely beneficial technique for analyzing processes using log transaction queries. However, for a more efficient visualization of system behavior, complement it with other relevant log query techniques depending on your organizational goals and requirements.
Steps Involved in Log Grouping
Here are steps to follow when grouping logs for analysis:
Understand the Purpose
Formulating appropriate queries for log evaluation, clarifying the specific processes to be analyzed, and defining the objective.
Identify Relevant Logs
Determine which logs contain the transactional information you need. Common log sources include application, system, and database logs. Simplify log identification by enabling only important logging levels, such as info, error, warning, and debug.
Formulate Queries
Use log format-appropriate query languages to craft log transaction queries and extract desired information. For instance, search for specific transaction codes, error messages, or execution times.
In modern, sophisticated logging tools like Middleware, users can achieve this (without code) by utilizing search functionalities to filter, search, and extract relevant information from logs.
Group, Filter, and Refine Logs
Group logs based on specific criteria or attributes meaningful for analysis to reduce the amount of data for processing and save time and effort.
For example, group logs by transaction ID, user ID, timestamp, or error code. Then, apply filters to narrow down logs to specific transactions or time frames.
Analyze Patterns
Analyze grouped logs to identify patterns or anomalies within the log data. For example, compare transaction times across instances or identify common error messages. Visualization tools can be helpful when analyzing large volumes of log data. Modern tools like Middleware provide a dashboard for end-to-end visibility into log data.
Identify Bottlenecks and Errors
Utilize log analysis results to pinpoint system errors, bottlenecks, and areas for optimization. This may involve tracing the flow of a specific transaction through different components of your system.
Take Action
Based on your analysis, determine the appropriate steps to address identified issues. This might involve debugging code, adjusting system configurations, or optimizing database queries.
Monitor and Iterate
Monitor relevant logs to track application performance and ensure changes have the desired effect. Regularly revisit your log transaction queries to adapt to changing requirements and investigate new issues.
Benefits of Log Grouping
Log grouping offers the following benefits:
End-to-End Context
Log grouping provides a comprehensive understanding of the journey, from the initial request to the final response. For example, when investigating a slow-performing API endpoint, you can follow the entire request lifecycle by grouping logs based on request ID and identifying existing and potential bottlenecks along the way.
Faster Troubleshooting of Production Incidents
In production incidents, time is crucial. Properly grouped logs allow users to quickly locate and analyze relevant logs, saving time and effort.
For instance, if an IT team receives reports of intermittent server errors, grouping logs related to those errors can ease the isolation of the error and identification of its root cause, such as misconfiguration or resource exhaustion.
Easy Identification of Key Logs from the Pile of Logs
In large-scale applications, the volume of logs can be overwhelming. Grouping logs based on specific attributes or metrics makes it easier to sift through the vast amount of data to identify the most important logs.
For instance, a developer looking to optimize a database query can group logs by execution time and pinpoint the slowest queries. This approach saves time and focuses on critical areas for optimization.
Efficient Log Aggregation
Log aggregation allows for easy metric calculation and insights into system behavior. For example, an SRE might group logs by error code to identify the most common errors and prioritize their resolution, increasing system stability.
Better Cross-team Collaboration
Log grouping promotes better collaboration between teams. By having logs grouped based on shared attributes, different teams can easily access and understand relevant logs. This shared understanding fosters collaboration, accelerates problem-solving, and facilitates knowledge transfer among teams.
For instance, developers and SREs can collaborate more effectively when investigating a performance issue by examining grouped logs to gain insights into the intricate interaction between code, infrastructure, and other components.
How to Group Logs in Middleware?
Middleware is a no-code observability tool that provides log grouping capabilities accessed through predefined keys and options.
To set up log transactions using Middleware, follow these steps.
1. Log in to the Profile
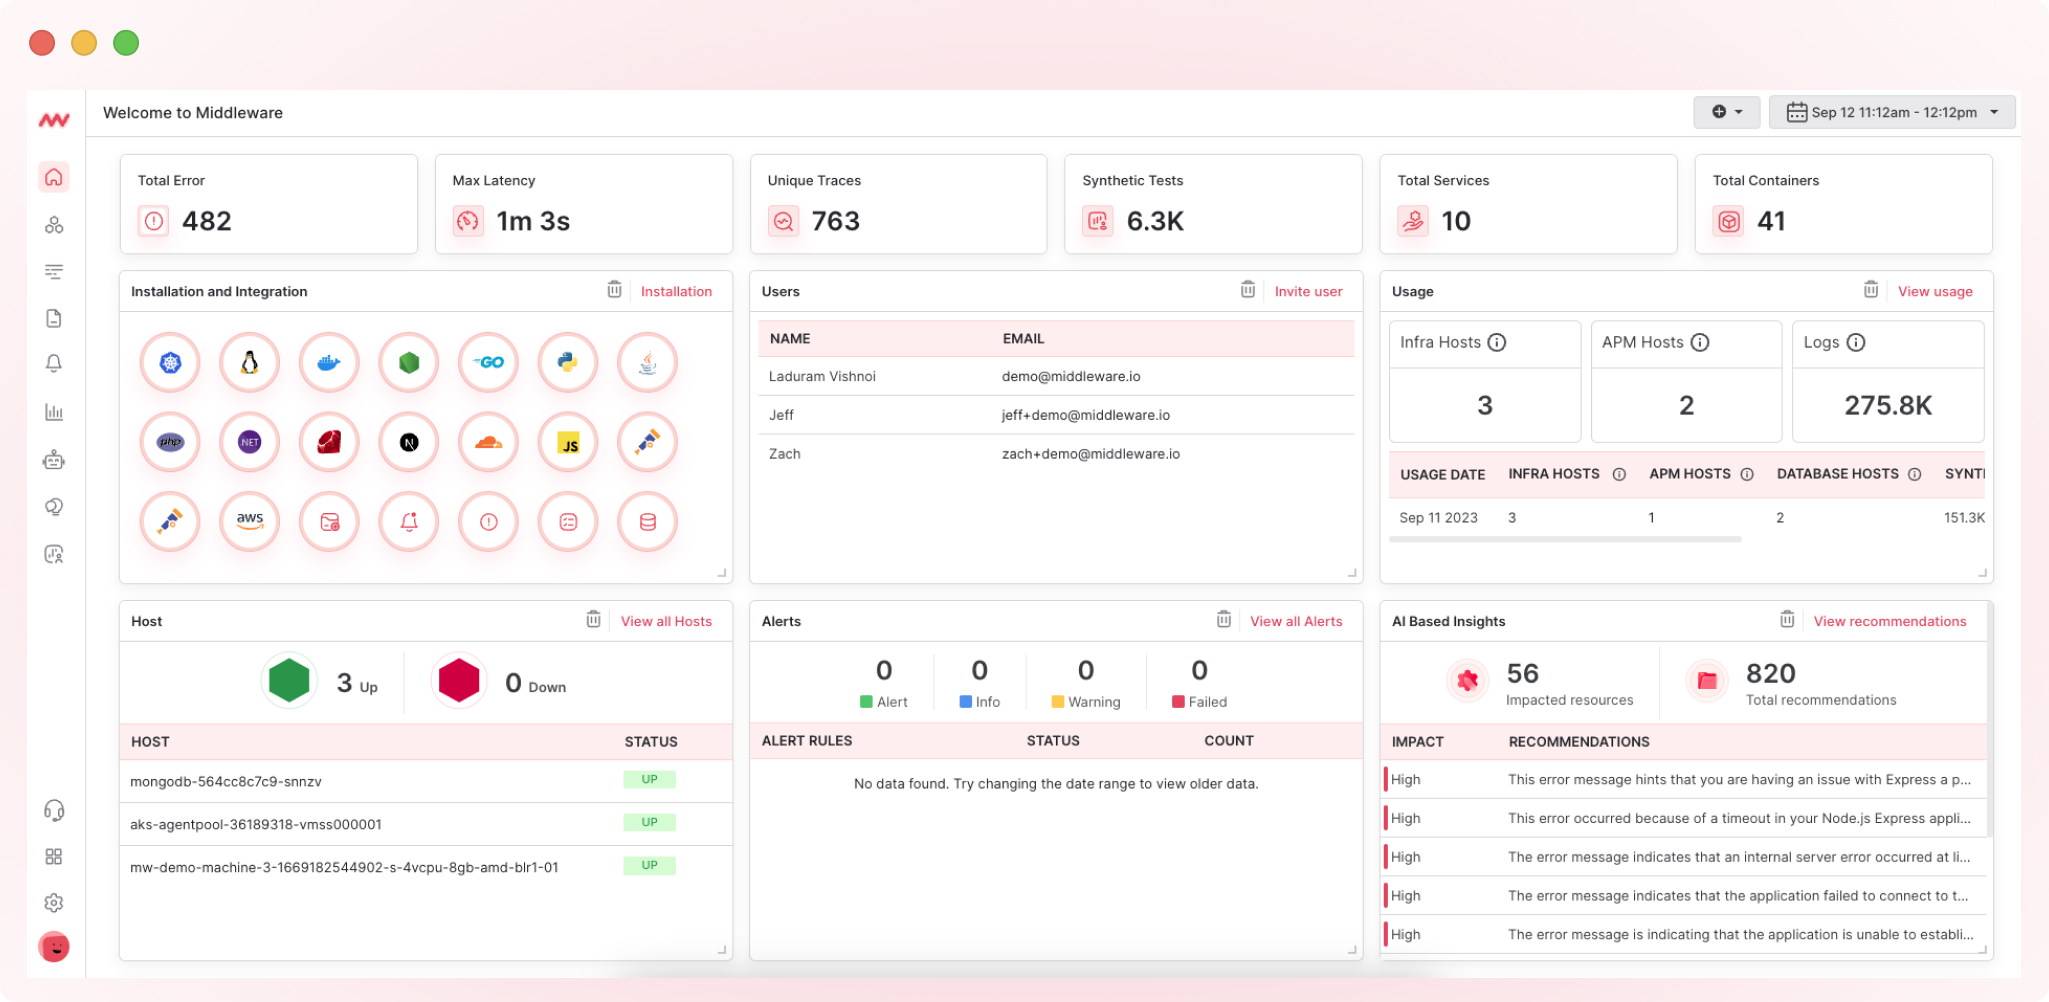
Visit middleware.io and click “Login.” Enter your username and password to access your account. After logging in, you will be directed to the Middleware homepage to view metrics, logs, and traces on a unified platform.
2. Go to Logs
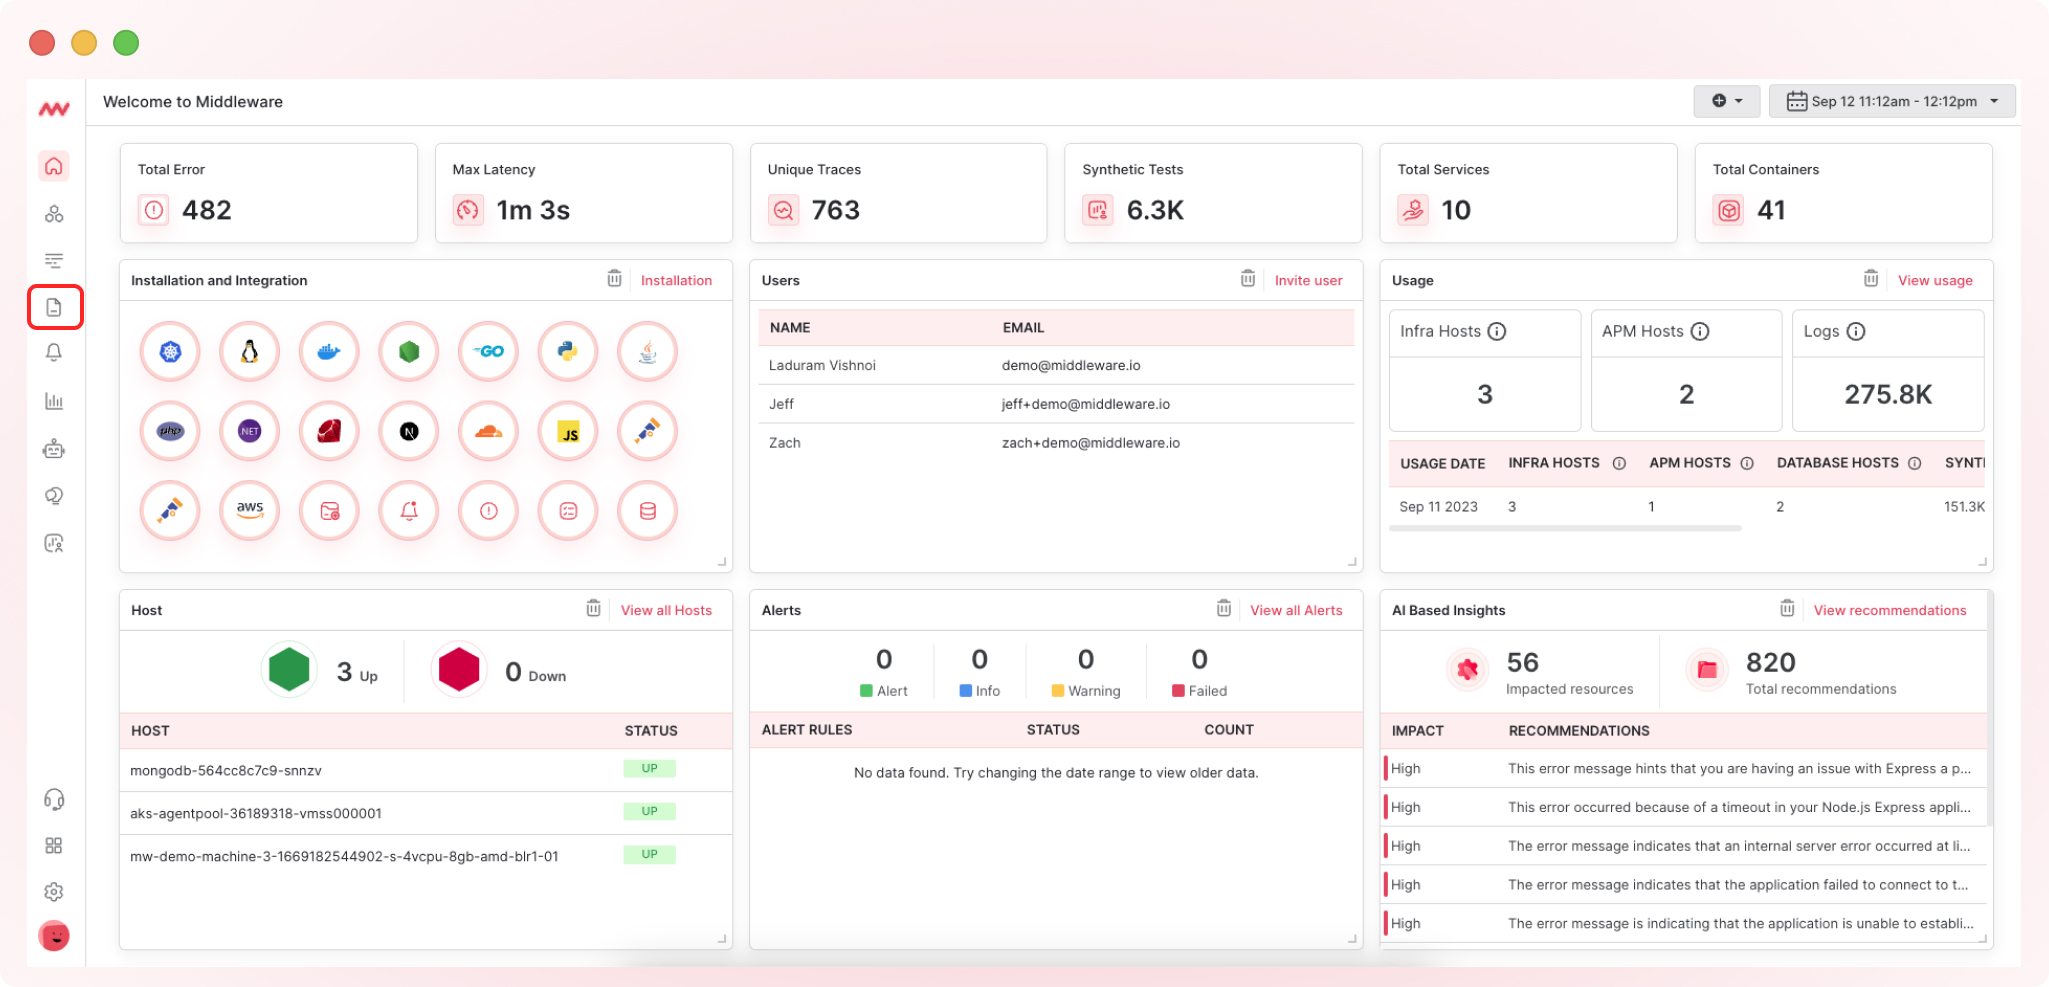
On the left side of the dashboard, click on “Logs.”
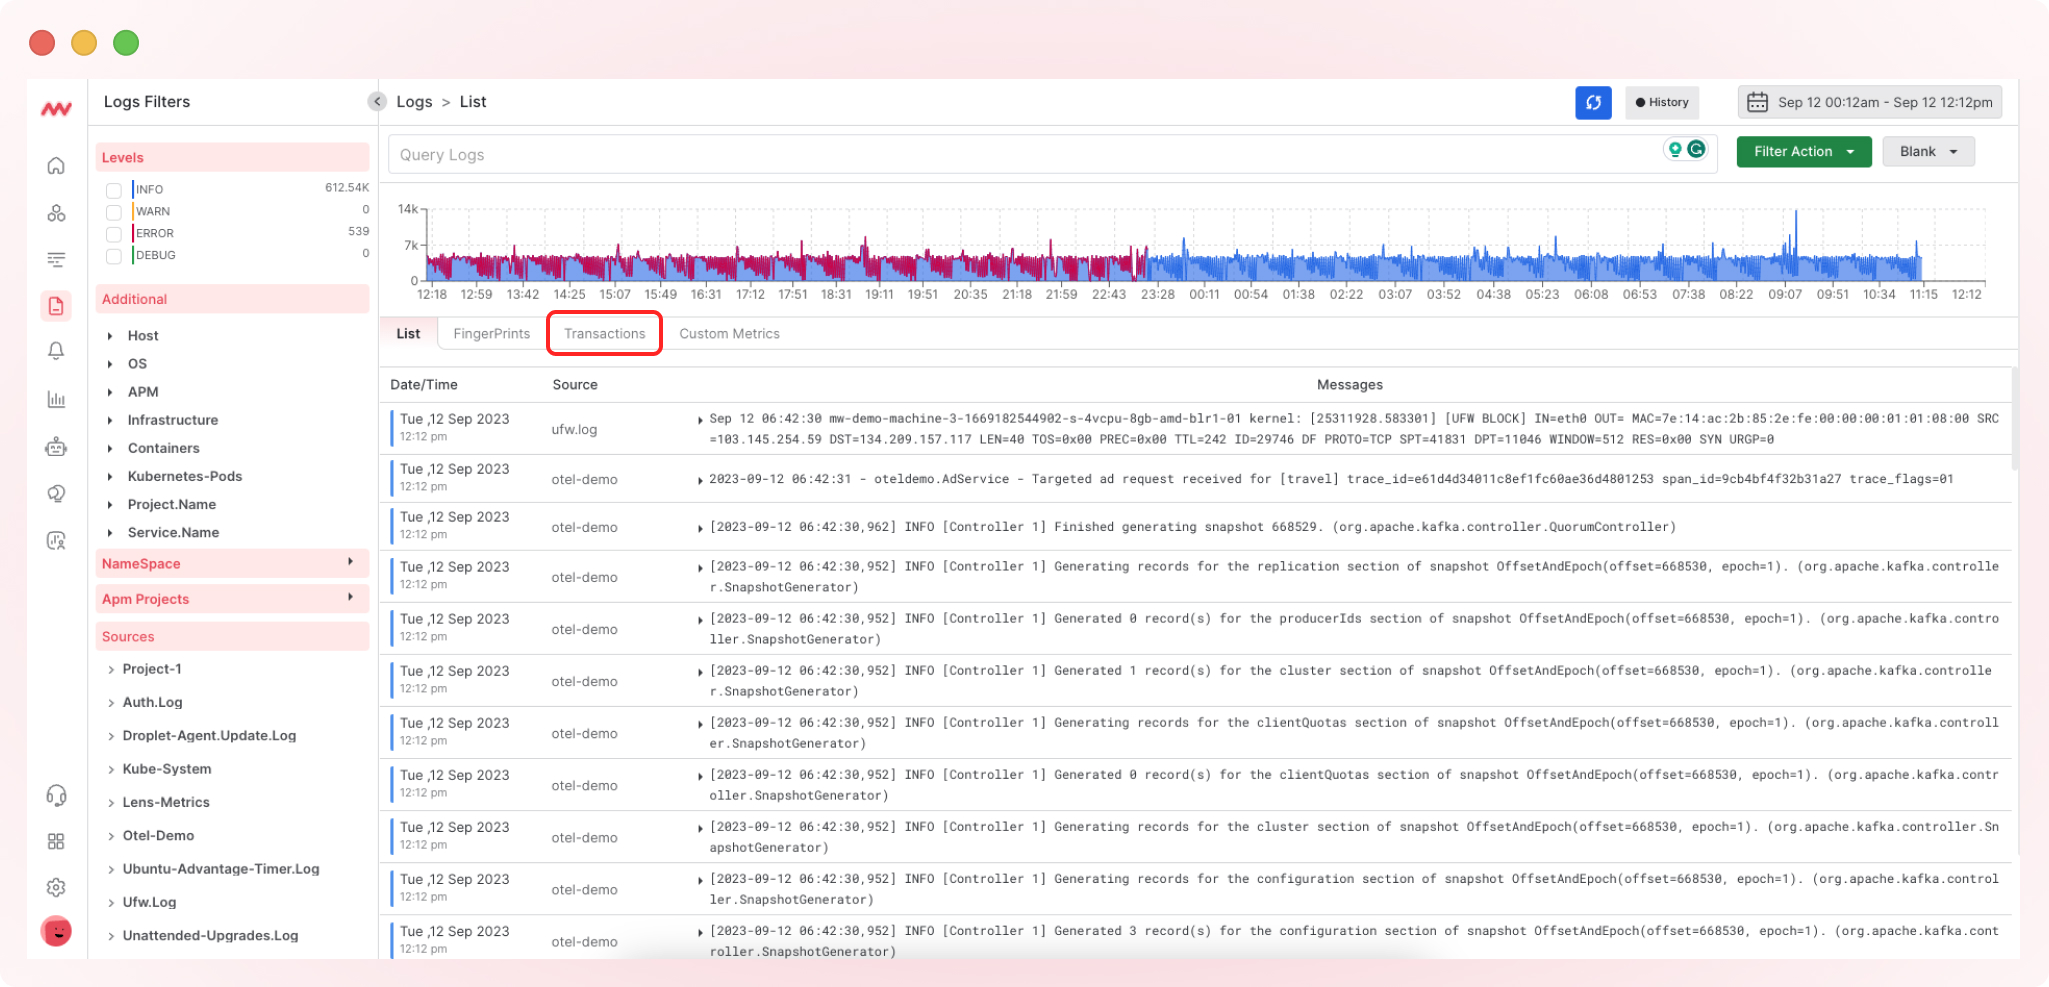
3. Proceed to Transactions
Within the logs section, find and click on “Transactions.”
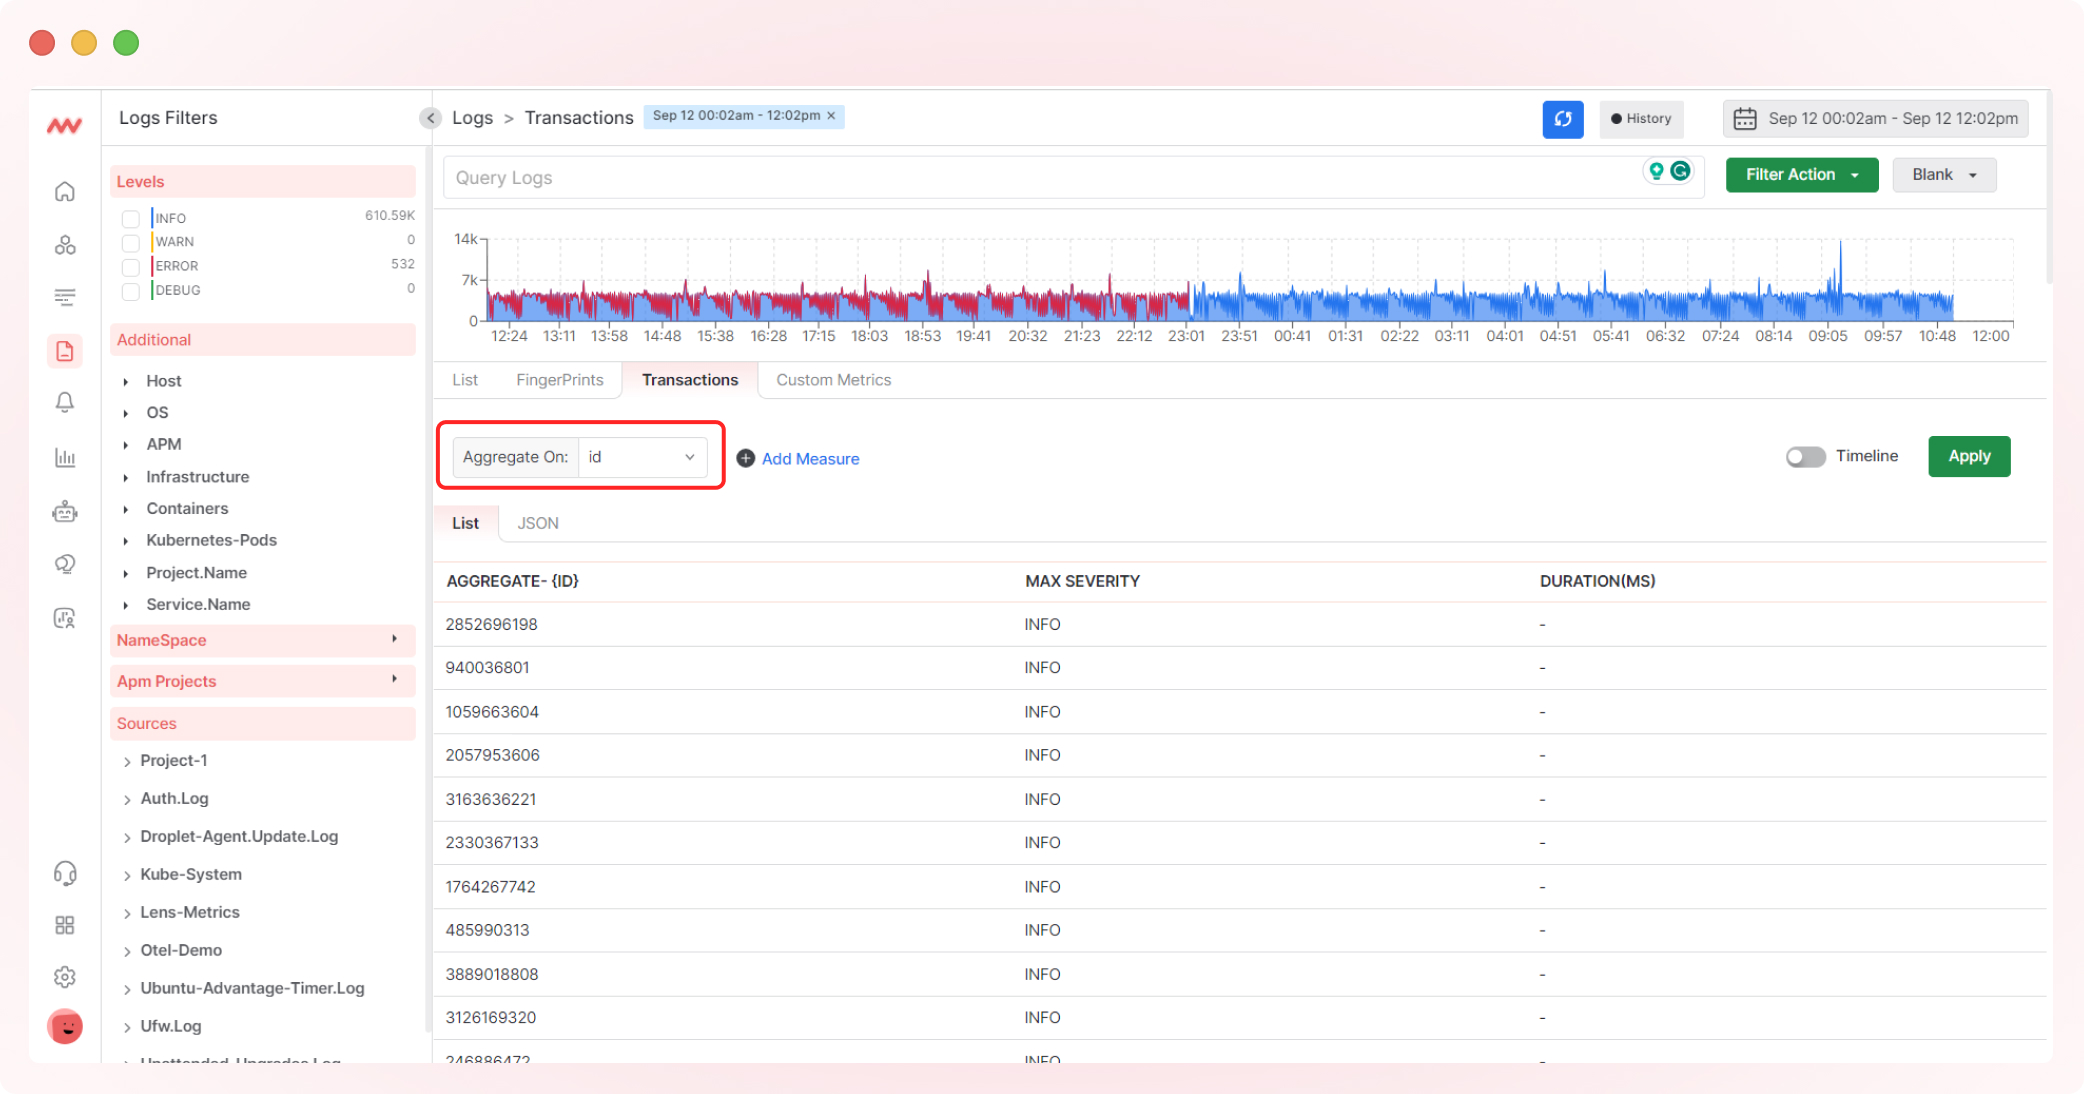
4. Define Transaction Boundaries
To group log transactions, select the transactions you want to aggregate by clicking “Aggregate.” Choose from a dropdown list, such as user requests or background jobs, and modify grouped logs with transaction identifiers like request, job, or user IDs.
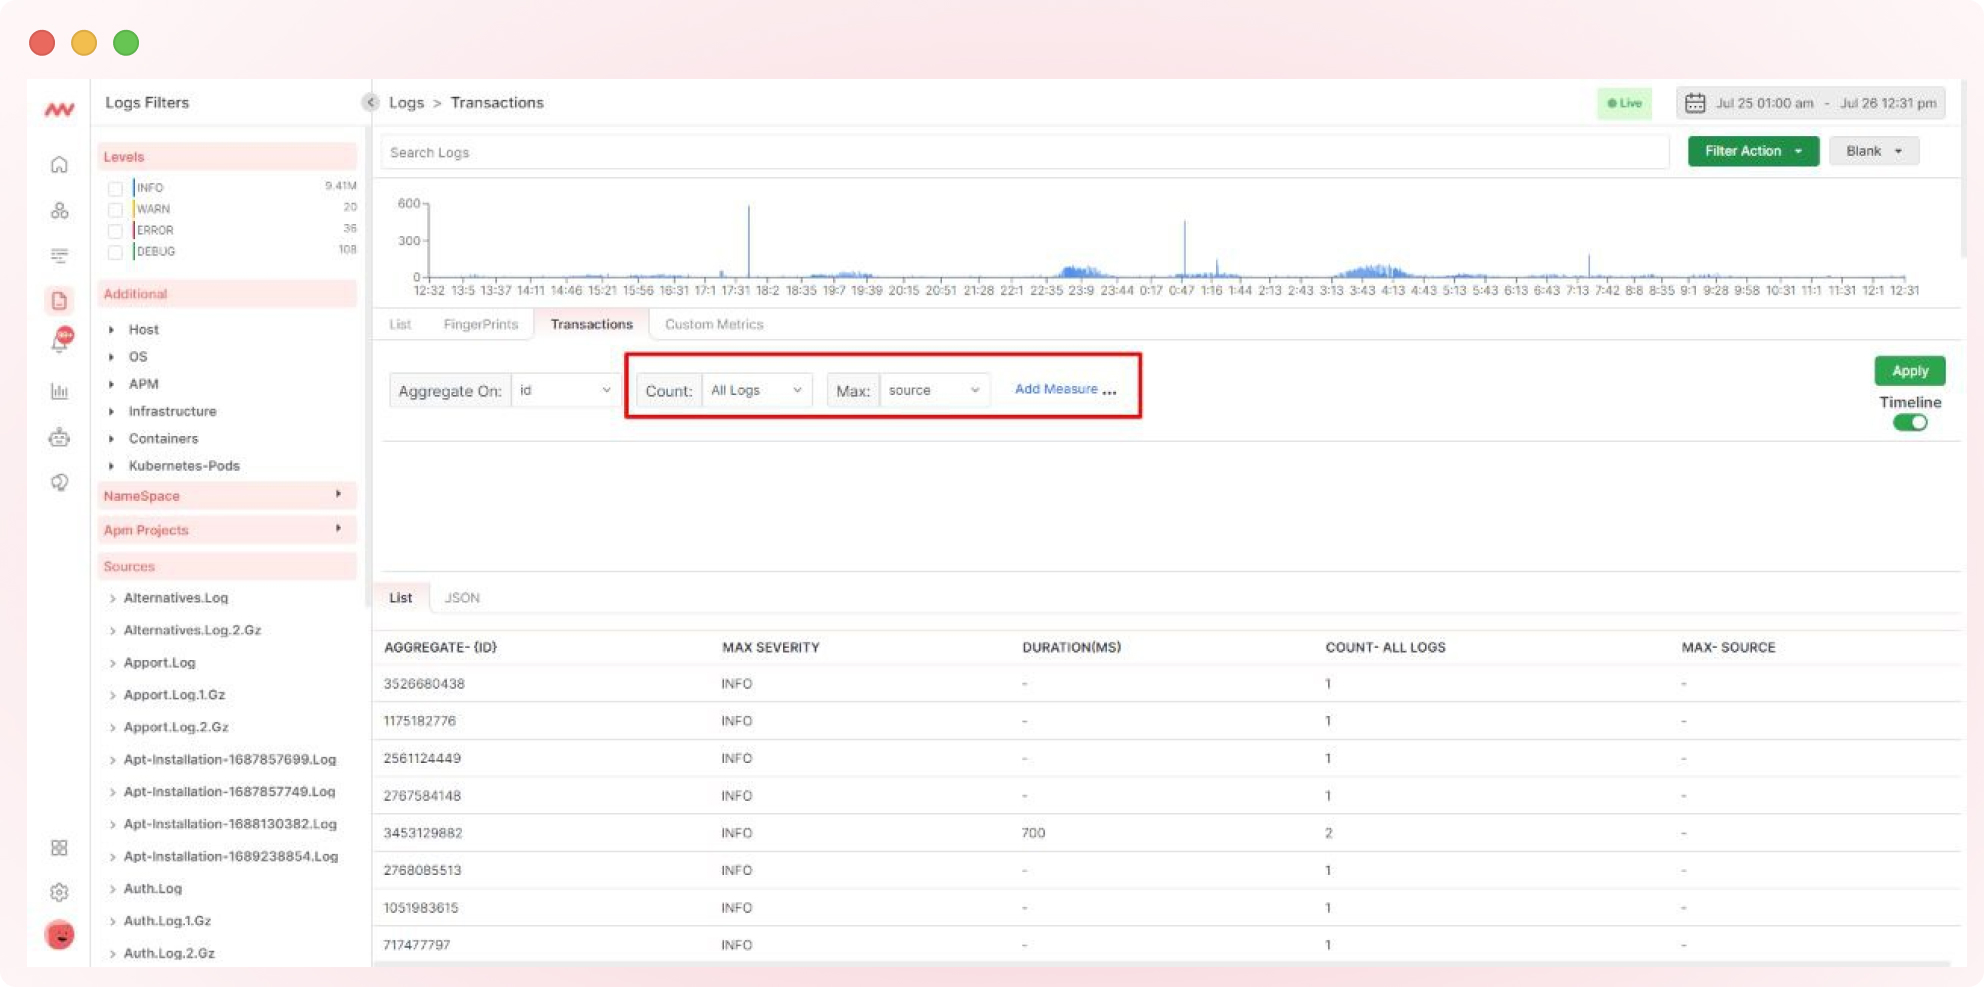
5. Log Transaction Metric
Enhance your logs by selecting relevant metrics for your aggregated transaction. Click “Add Measure” to include metrics such as counts, maximum values, and maximum frequencies over time.
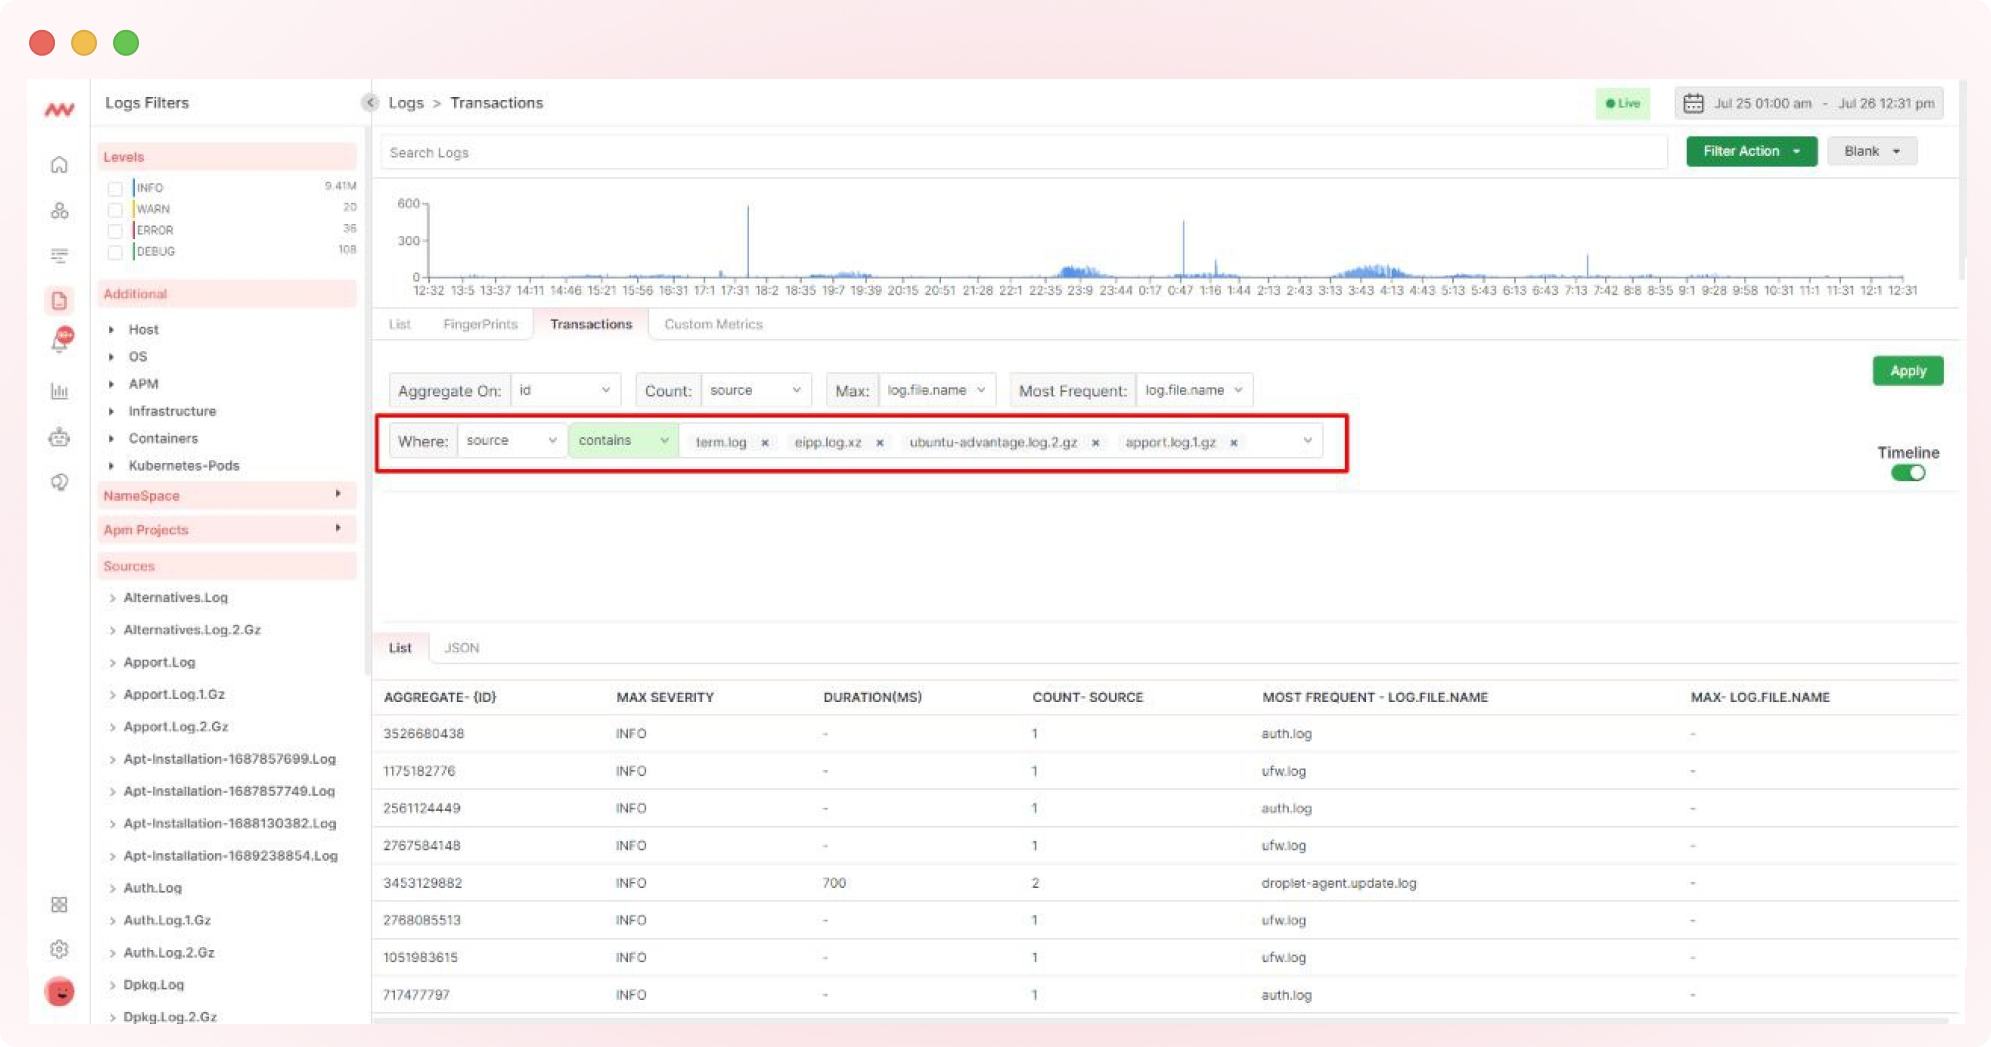
6. Configure Log Parsing and Define Parsing Rules
To query and filter logs based on specific fields or attributes, configure log parsing to extract structured data from your chosen transaction logs. Define parsing rules using the “Where” expressions from the selection.
7. Visualize Log Transaction Queries
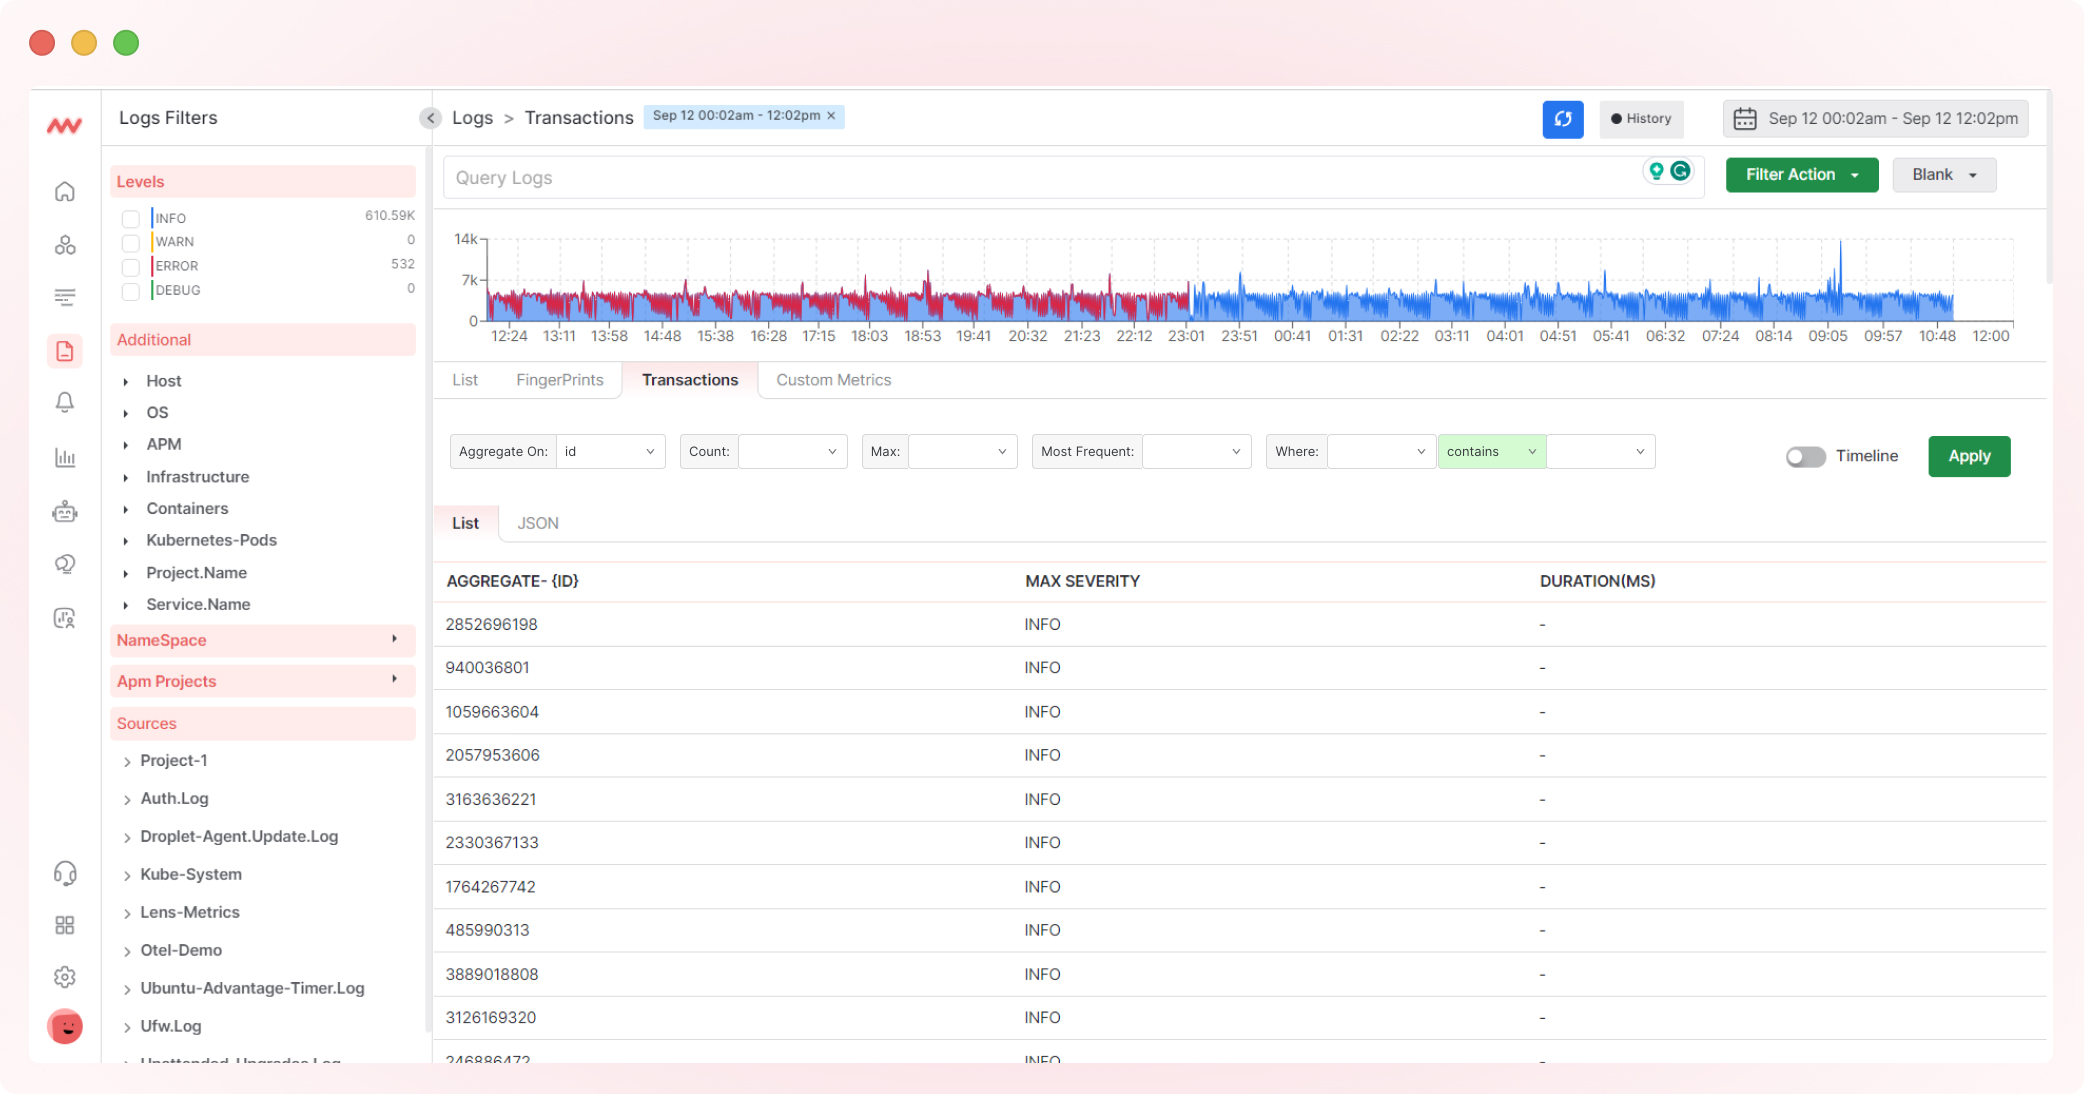
Click “Apply” to visualize your log transactions.
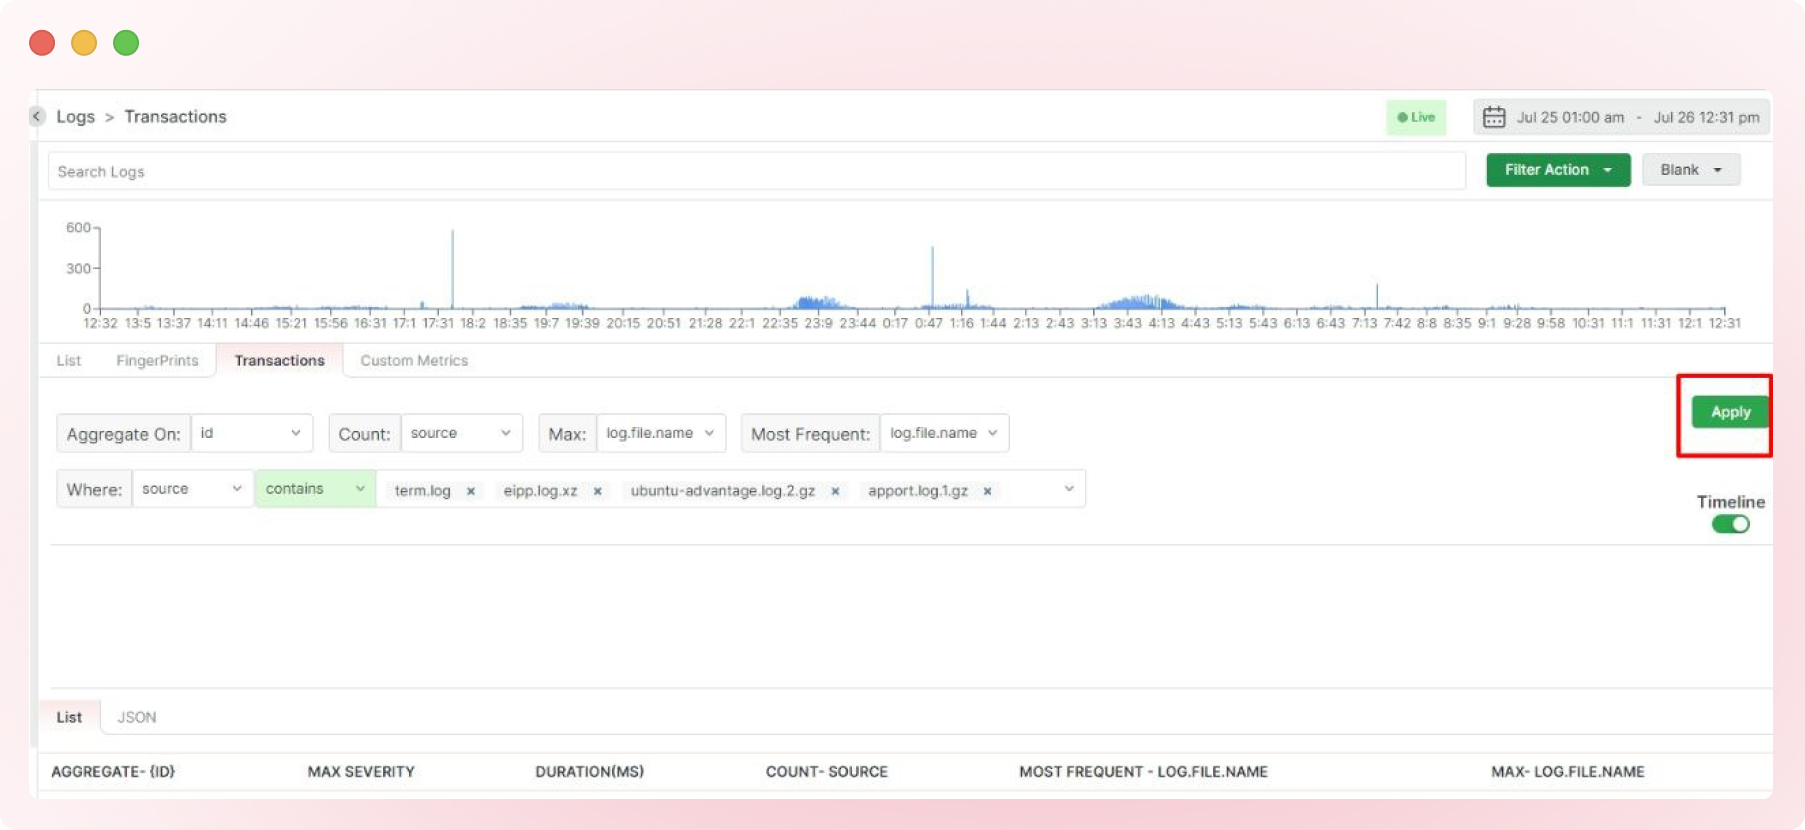
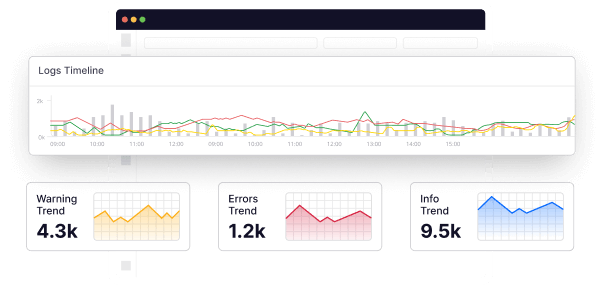
Depending on the transactions, the data may be displayed as shown below.
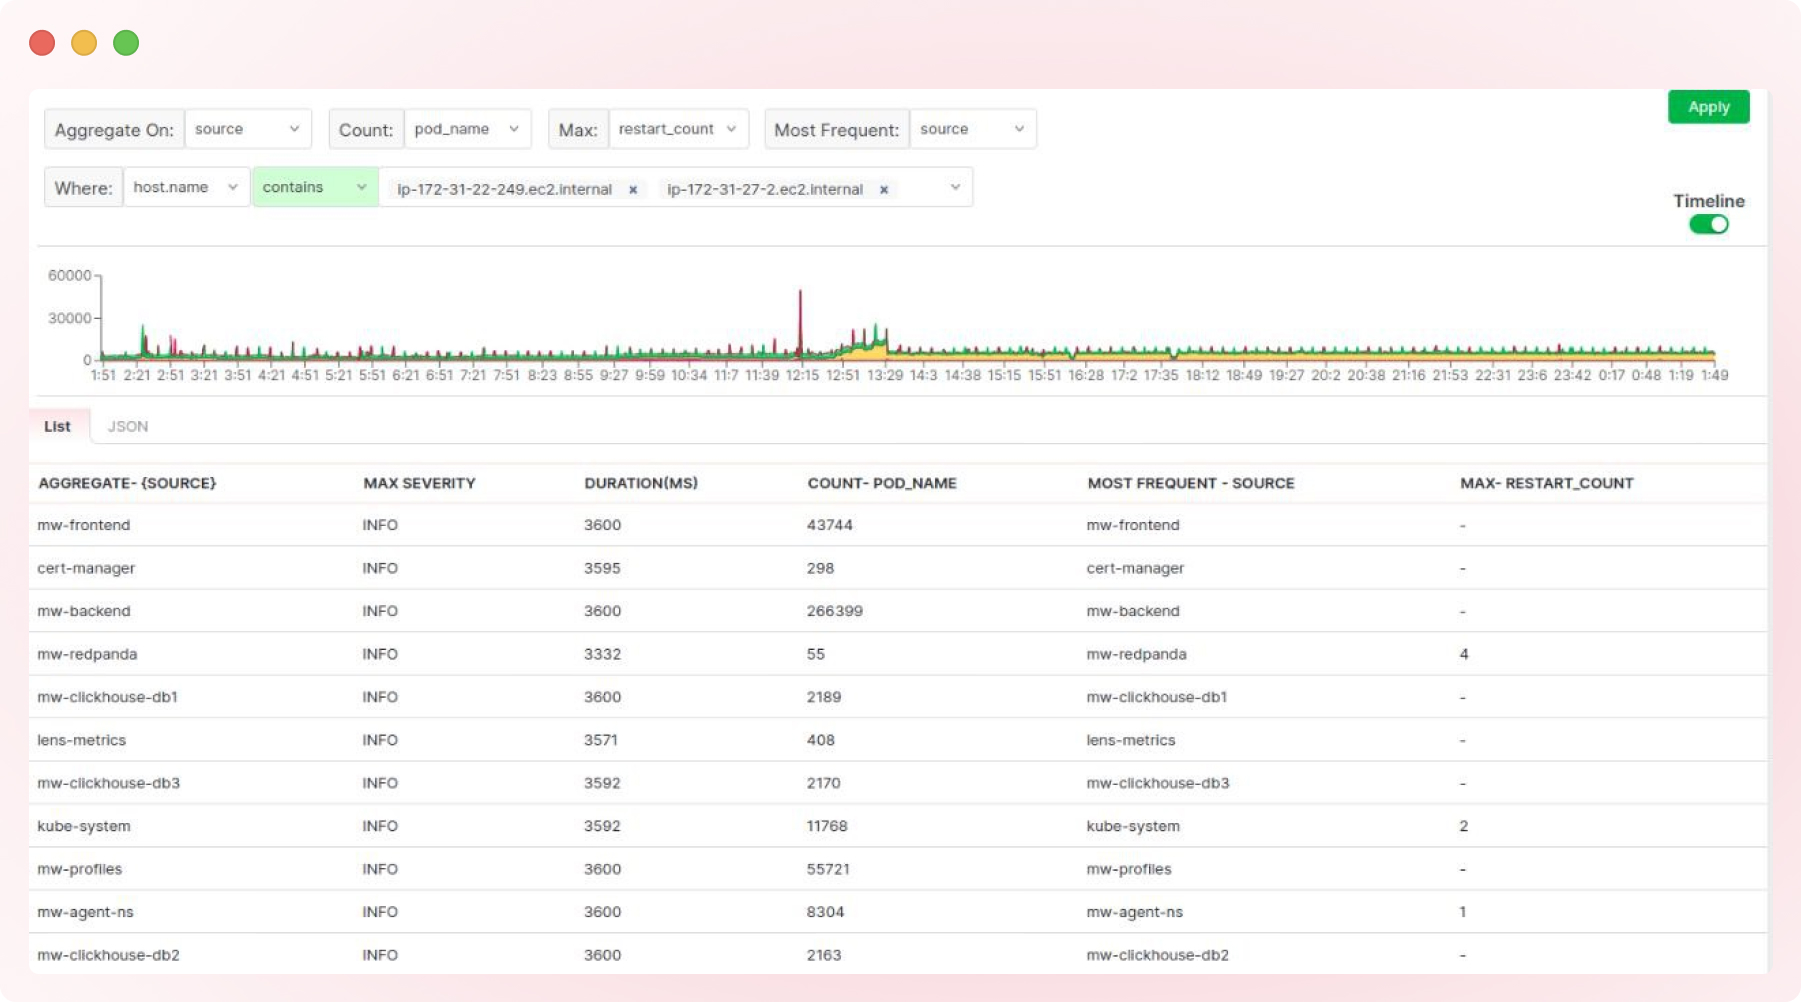
A busier transaction may exhibit a more comprehensive log display, as shown below.
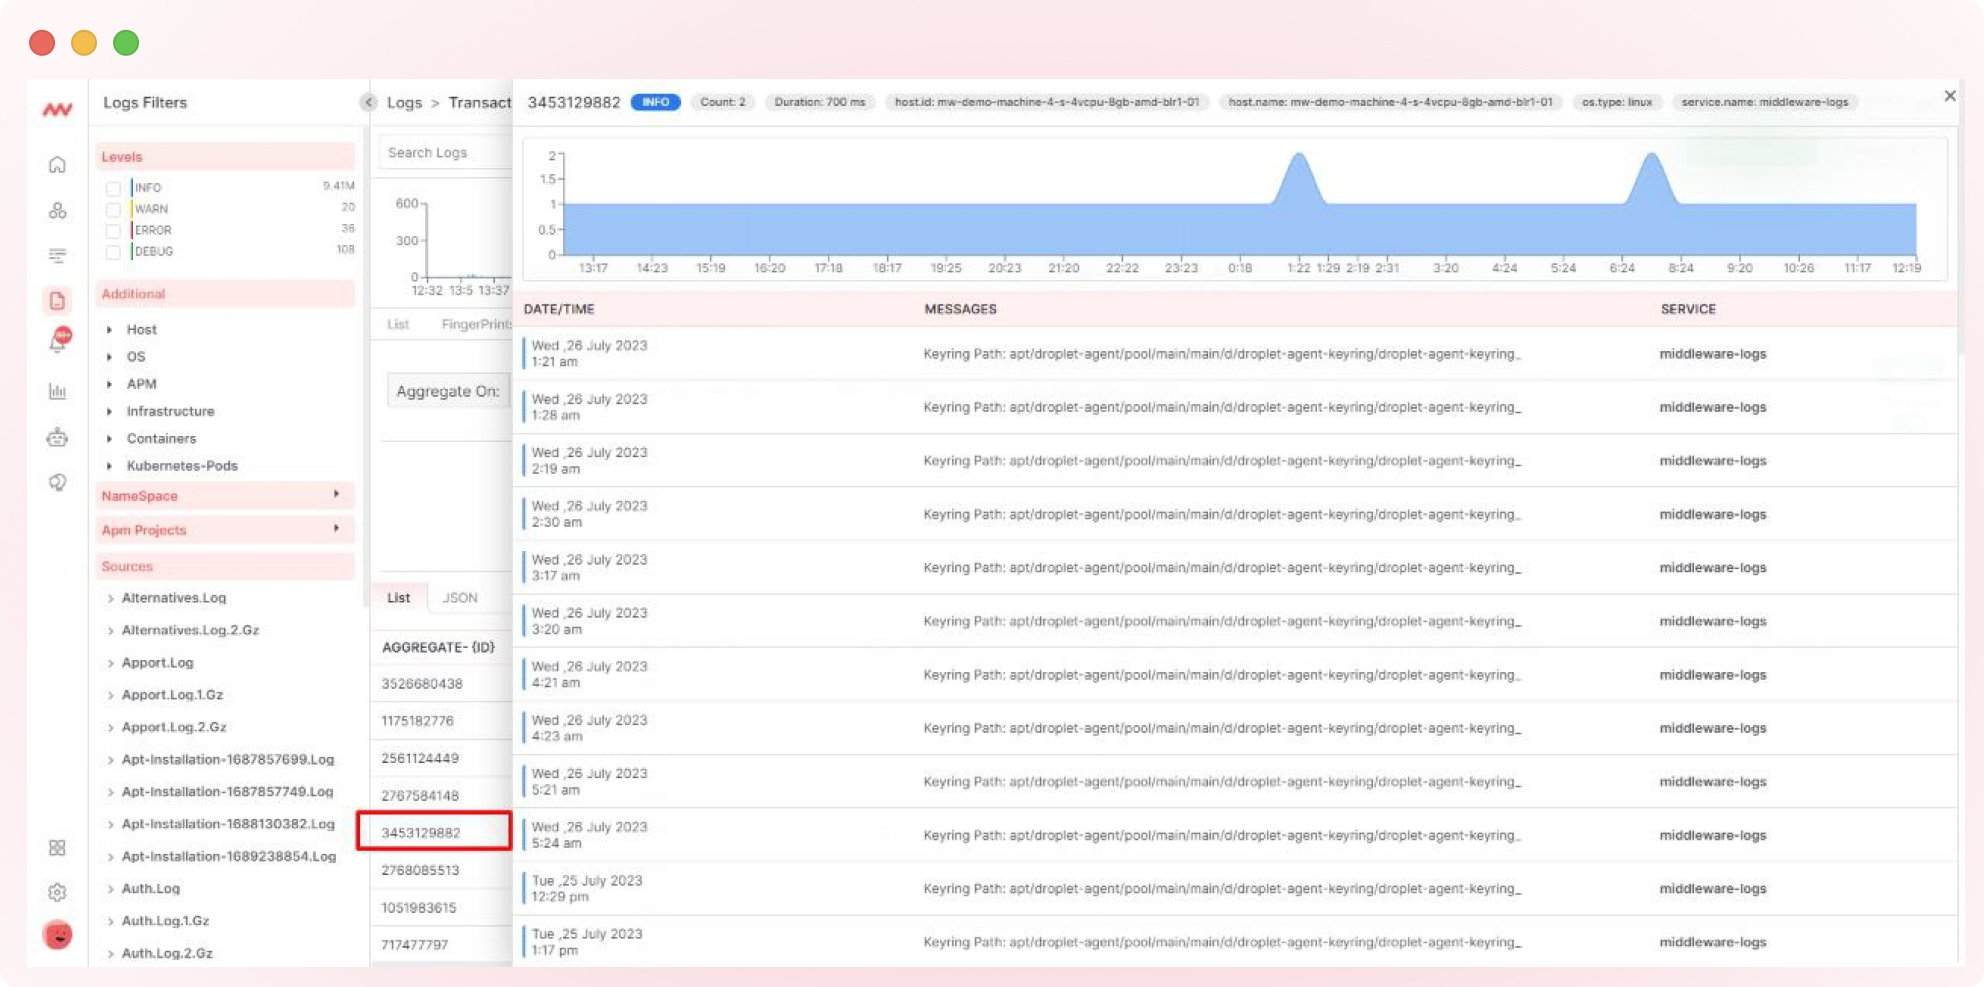
For a more detailed view, click on individual transactions to access information such as tags, timelines, and frequent logs, as exemplified below.
Middleware allows you to group log transactions by navigating the platform and tracing the path of requests and processes in SQL log transaction servers and other servers and databases.
For instance, in SQL Server Management Studio (SSMS), functions like fn_dblog() and fn_dump_dblog() are used for log grouping.
Follow these steps and adopt best practices to effectively set up, analyze, and monitor log transactions using Middleware. This empowers you to proactively detect and resolve issues, optimize performance, and ensure the reliability of your applications.
Closing Thoughts
Analyzing transaction logs helps developers understand system behavior intricacies. This method involves the advanced analysis of log content, making it a typically complex process executed through arbitrary codes and commands.
Middleware simplifies this process by offering advanced features that enable developers to identify essential logs within extensive data repositories readily.
Read our documentation for more information.