Summary: LLM Observability is the practice of monitoring, tracing, and evaluating large language model systems in production. It gives engineering teams visibility into token usage, cost per request, response latency, output quality, and GPU infrastructure health across every model call. Unlike traditional application monitoring, which tracks uptime and error rates, LLM observability captures the full context of why a model responded the way it did, what it cost, and whether the output met quality criteria.
TL;DR
- LLM observability tracks token cost, output quality, model version, span-level latency, and GPU health the signals that actually explain LLM behavior in production.
- Five pillars: Evaluation, traces and spans, RAG monitoring, fine-tuning observability, and prompt engineering analysis each covering a distinct layer of an LLM system.
- LLMs run on GPUs. Middleware monitors GPU utilization, memory, temperature, power draw, and per-device processes alongside application traces.
- LLM-as-a-Judge evaluates every production prompt-response pair against your defined rules and acceptance criteria no manual review required at scale.
- Middleware’s Playground lets you switch models, define output schemas, add tool definitions, and run sample inputs with cost and latency estimates before touching live traffic.
- Tokens, cost, error rate, latency, LLM calls, evaluation scores, and tool usage all in one analytics view with real-time and historical drill-down.
Understanding LLM observability
LLM observability is a more in-depth approach to monitoring large language models. It captures not only basic outputs but also metrics, traces, and behavioral patterns across the entire request lifecycle. Tracing lets you see how a model processes a prompt, how long each step takes, and where latency or inefficiencies appear things traditional monitoring cannot surface.
At its core, LLM observability provides visibility into how LLMs function in real-time not just whether requests succeeded, but how each step of prompt processing and response generation happened, what resources it consumed, and whether the output was any good.
Challenges with LLMs
LLMs introduce production challenges that standard monitoring tools cannot address:
- Hallucinations: models generating outputs not grounded in facts
- Excessive API calls: API call proliferation that inflates operational cost
- Proprietary data exposure: sensitive data handled insecurely within model responses
- Inaccurate or harmful outputs: responses that are incorrect, incomplete, or inappropriate
- Output quality variance: responses suboptimal in tone, detail, or relevance
- Unpredictable cost: token consumption at scale creates billing surprises, especially across third-party providers
- Model drift: third-party model behavior shifts between versions without notice
- Undifferentiated defaults: without tuning and observability, LLM behavior stays generic rather than fit-for-purpose
Traditional monitoring cannot capture or address these issues at their source. LLM observability closes that gap.
LLM monitoring vs. LLM observability
Traditional monitoring tracks high-level performance: latency, throughput, uptime. LLM observability traces each request-response cycle end to end hat the model received, what it returned, how long each step took, and what it cost.
In systems using retrieval-augmented generation (RAG), observability shows how external knowledge retrieval affects response accuracy and latency a level of detail simple monitoring cannot provide.
Why is LLM Observability different from traditional observability?
Traditional observability platforms focus on server health, request counts, and error rates. LLMs generate responses that depend on prompts, external retrieval, fine-tuning history, and model version none of which standard tools expose. LLM observability must address:
- Prompt engineering: understanding how different prompts influence model outputs
- Fine-tuning: ensuring the model performs correctly after task-specific training
- Retrieval integration: monitoring how external data sources combine with outputs in RAG architectures
This makes LLM observability more layered and domain-specific than standard application observability.
Five core foundations of large language model observability
Effective LLM observability rests on five pillars. Each covers a distinct layer of an LLM system.
1. Evaluation
Evaluation measures LLM output quality continuously. Automated scoring systems like BLEU or ROUGE assess generated text. Human feedback and LLM-as-a-Judge approaches add nuanced scoring for production systems where output quality is business-critical.
Key steps:
- Gather user feedback through ratings or surveys, or use an LLM to score outputs against defined criteria
- Analyze embedding visualizations (PCA, t-SNE) to identify clusters of problematic outputs
- Use LLM or manual analysis to identify common patterns in failing prompts
2. Traces and spans
Tracing captures the entire request-response cycle, showing how data flows through an LLM pipeline. Breaking the process into spans each representing one workflow stage lets observability tools pinpoint latency issues, errors, and bottlenecks at their source.
Key steps:
- Evaluate across multiple spans to narrow down where failures occur
- Collect metadata including token usage, prompt content, and model version per span
- Visualize the full trace to understand flow and identify optimization targets
3. Retrieval augmented generation (RAG)
RAG combines LLM outputs with external knowledge sources. Observing how retrieval affects model outputs helps refine accuracy, relevance, and latency across knowledge-grounded applications.
Key steps:
- Monitor retrieved document relevance scores
- Compare outputs generated with and without external knowledge
- Track how retrieval sources affect model accuracy over time
4. Fine-tuning
Fine-tuning LLMs for specific tasks requires tracking training loss, accuracy, and benchmark performance. Observability here ensures the model adapts correctly without degrading on general tasks.
Key steps:
- Set up logs for training metrics and model checkpoints
- Track performance on held-out test sets or using online evaluation metrics
- Use A/B testing to compare model versions before full rollout
5. Prompt engineering
Prompt engineering shapes what an LLM outputs. Observability tracks which prompt variants produce accurate, relevant results and measures their performance over time.
Key steps:
- Version and track different prompt variants
- Measure token usage and response accuracy per version
- Run A/B tests to identify which prompt structures perform best in production
Why LLMs need to be observed
LLMs generate variable outputs. The same prompt can return different responses, and model behavior can shift between versions without explicit changes on your end. Without observability, anomalies, hallucinations, and cost spikes go undetected until they reach users.
Metrics like response latency and token usage surface problems before they affect end-users. A latency spike often points to a retrieval bottleneck. A token usage jump can indicate a prompt regression or model behavior change. Without visibility into these signals, the first sign of a problem is a user complaint or a billing alert.
According to a 2024 study, around 18% of AI practitioners consider AI/ML capabilities crucial for observability. These capabilities:
- Accelerate root cause analysis by providing deeper operational context to quickly identify the source of issues
- Align AI performance with business goals by keeping model accuracy, cost, and reliability within defined thresholds
“A new facet of observability supports large language models (LLMs) and AI workflows, focusing on monitoring API calls, vector databases, model performance, and GPU usage. As organizations incorporate AI, observability platforms must track infrastructure and specifics of LLM performance and API cost-effectiveness, as AI token mismanagement can skyrocket expenses. Observability for AI is distinct from AI-powered observability, which integrates AI to streamline traditional monitoring and debugging. This dual approach addresses the unique demands of managing AI systems, ensuring models operate smoothly while controlling costs associated with high data processing.”
Sam Suthar, Founding Director, Middleware
What to track: Key signals to monitor
Three signal categories give you the complete operational picture for production LLM systems.
Request Metadata:
- Model version: track performance changes across model updates and A/B tests
- Temperature: controls output randomness — higher values increase variability
- Top_p: defines how selectively the model chooses response tokens
- Prompt details: the exact input sent to the model, essential for debugging bad outputs
Response Metadata:
- Tokens: input and output counts per request — the direct driver of cost
- Cost: per-request cost attribution for budgeting and anomaly detection
- Response characteristics: length, structure, and quality signals that reveal model behavior changes
Traces:
- Capture the full request-response sequence, especially in complex workflows like RAG
- Monitor data flow to identify bottlenecks, retrieval failures, and network delays
All three signal categories are captured automatically in Middleware’s dashboard, with both real-time and historical views.
How Middleware enables LLM observability
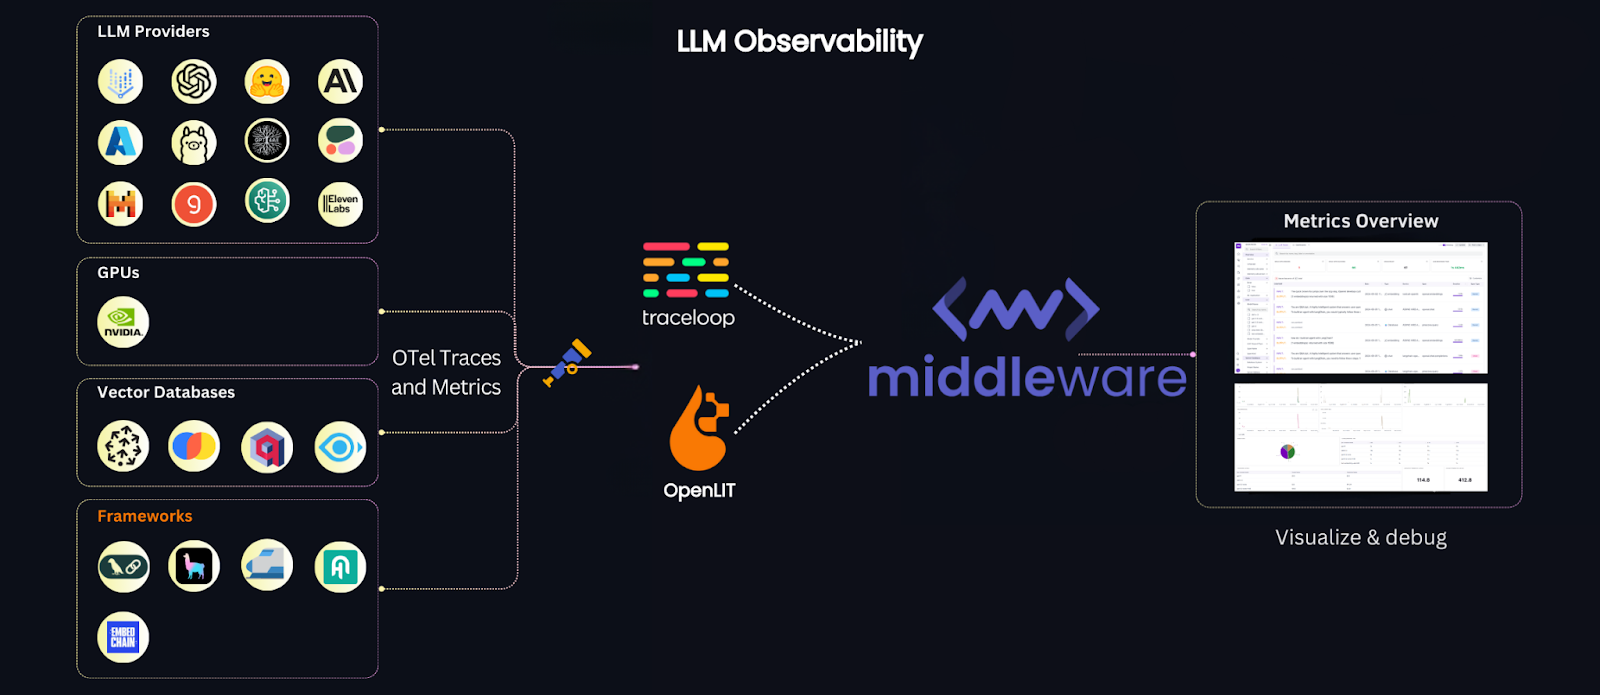
Middleware’s LLM Observability is built to give teams complete visibility into production LLM systems. It integrates with existing ML pipelines via OpenTelemetry and works seamlessly with LLM providers like Ollama, Mistral, and OpenAI, capturing every signal that matters for debugging, cost control, and reliability, whether you’re running models in research, development, or production.
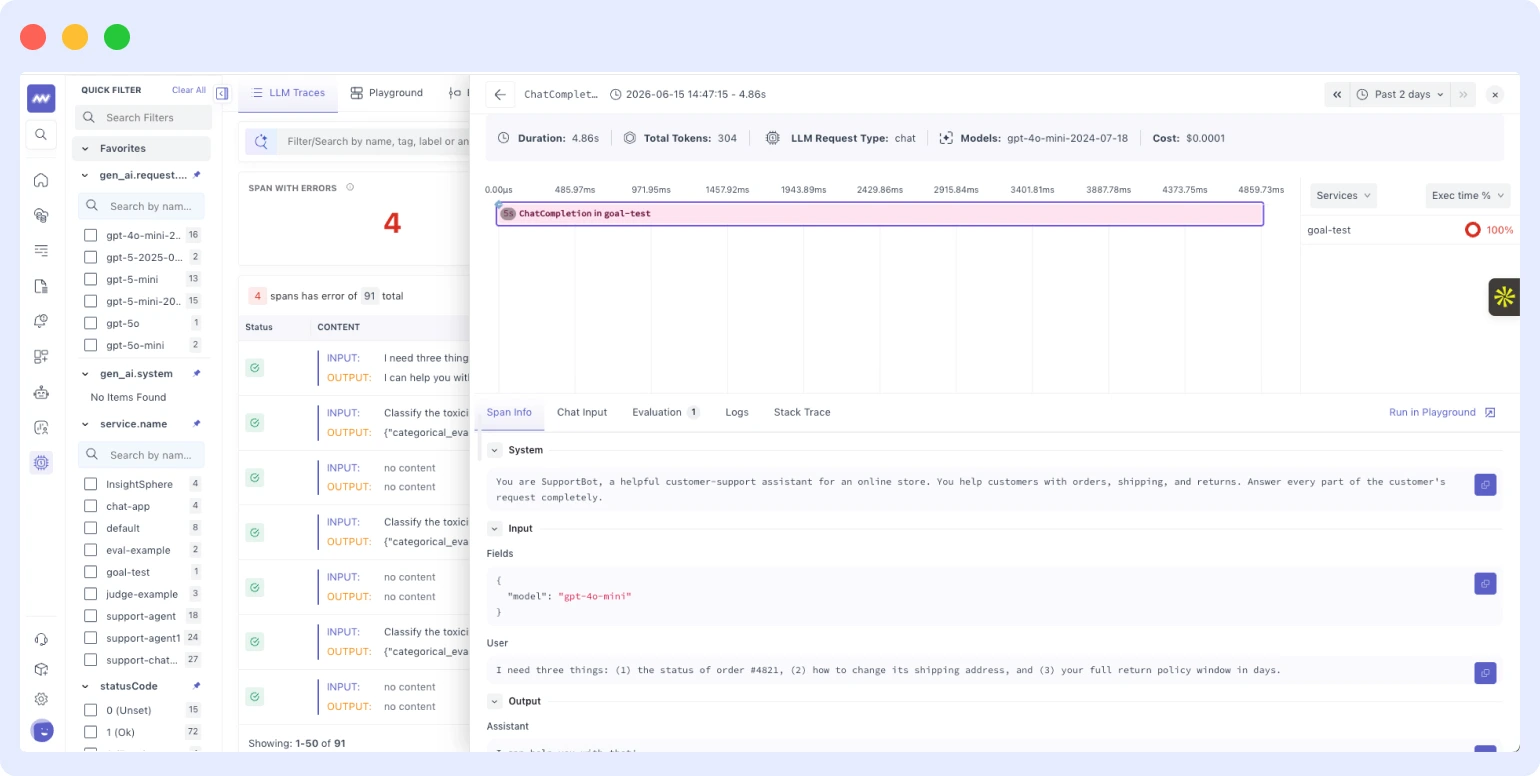
LLM traces
The traces screen is where most debugging starts, and Middleware has significantly expanded what it surfaces per request. Beyond basic latency and status, every trace now shows:
- Total tokens per request: input and output token counts broken down per span, so you can see exactly which call in a chain is consuming your token budget
- Cost: per-request cost attribution mapped to model and token counts visible in the trace view before it shows up in a billing report
- Model details: which model and version handled each span, essential when running across multiple providers or testing model versions in parallel
- Span info: a time breakdown across every step in the chain retrieval, tool calls, model inference, post-processing so you know where time is actually going
- Stack trace: surfaced inline with the trace, so when something fails you do not have to cross-reference a separate log stream to find the error
- Chat input: the exact prompt sent to the model, attached directly to the trace for full request context
- Correlated logs: logs from the same request surfaced alongside the trace in a single view
Middleware can trace the full path a user prompt takes from initial query through the model’s response generation process. You can also configure alerts to fire when a specific metric token usage, cost per request, or latency, crosses a threshold, so anomalies are caught and addressed before they compound into bigger problems.
Model Playground
Before this, testing how a prompt behaves on a different model meant writing code or switching to an external tool. The Playground brings that directly into Middleware.
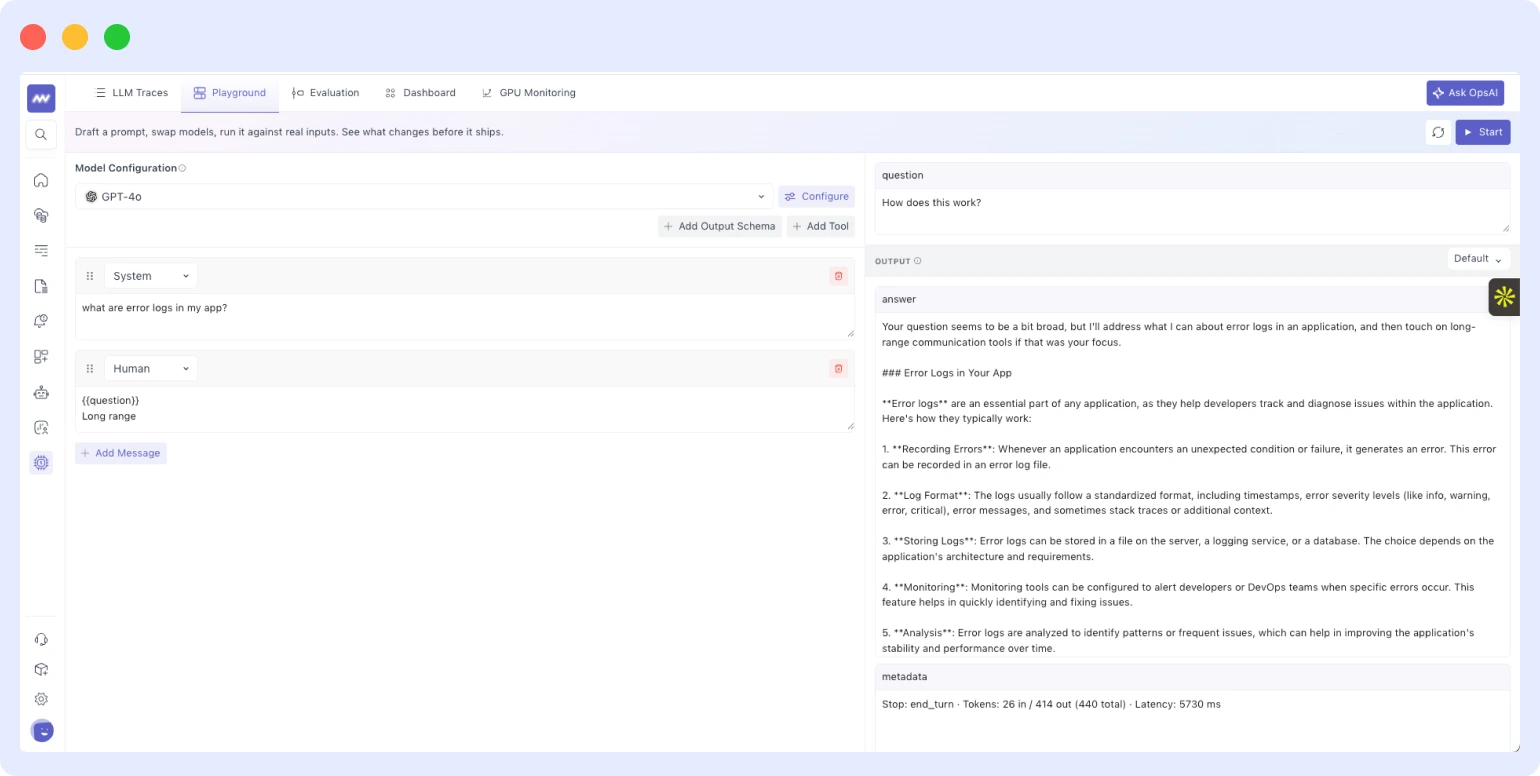
From the Playground, you can switch between different models and providers without touching application code, define output schemas to verify the model returns data in the structure you expect, add tool definitions to test how the model reasons through tool selection, and run sample inputs to inspect the full response alongside token count, latency, and cost estimate all before anything reaches production traffic.
This is particularly useful when evaluating whether a smaller or cheaper model can handle a subset of your workload without output regressions, or when testing a prompt change you are not ready to push live.
LLM-as-a-Judge (evaluation)
Manual review of LLM outputs does not scale. Middleware’s built-in evaluation framework solves this by using a language model as the evaluator running automatically against your production traffic.
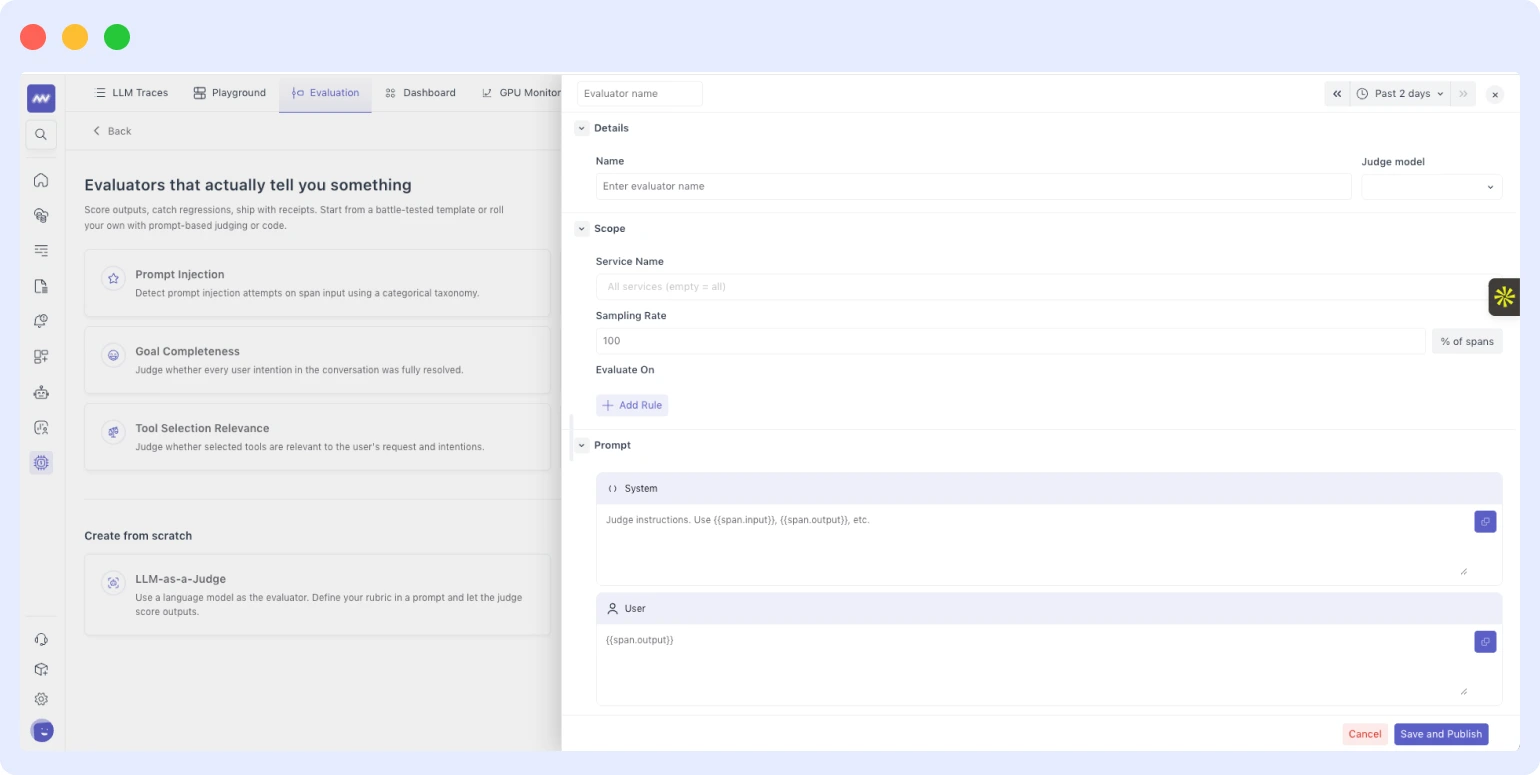
You configure three things: the scope of evaluation (which prompts and endpoints to cover), the judge model (any supported model of your choice), and the rules and acceptance criteria that define what a passing response looks like tone, accuracy, format compliance, completeness, or custom rules specific to your use case. From there, the system scores each prompt-response pair automatically.
Evaluation results flow into the LLM dashboard as a continuous quality signal over time. If quality drops after a model update or system prompt change, it shows up in the scores before your users notice the difference.
GPU monitoring
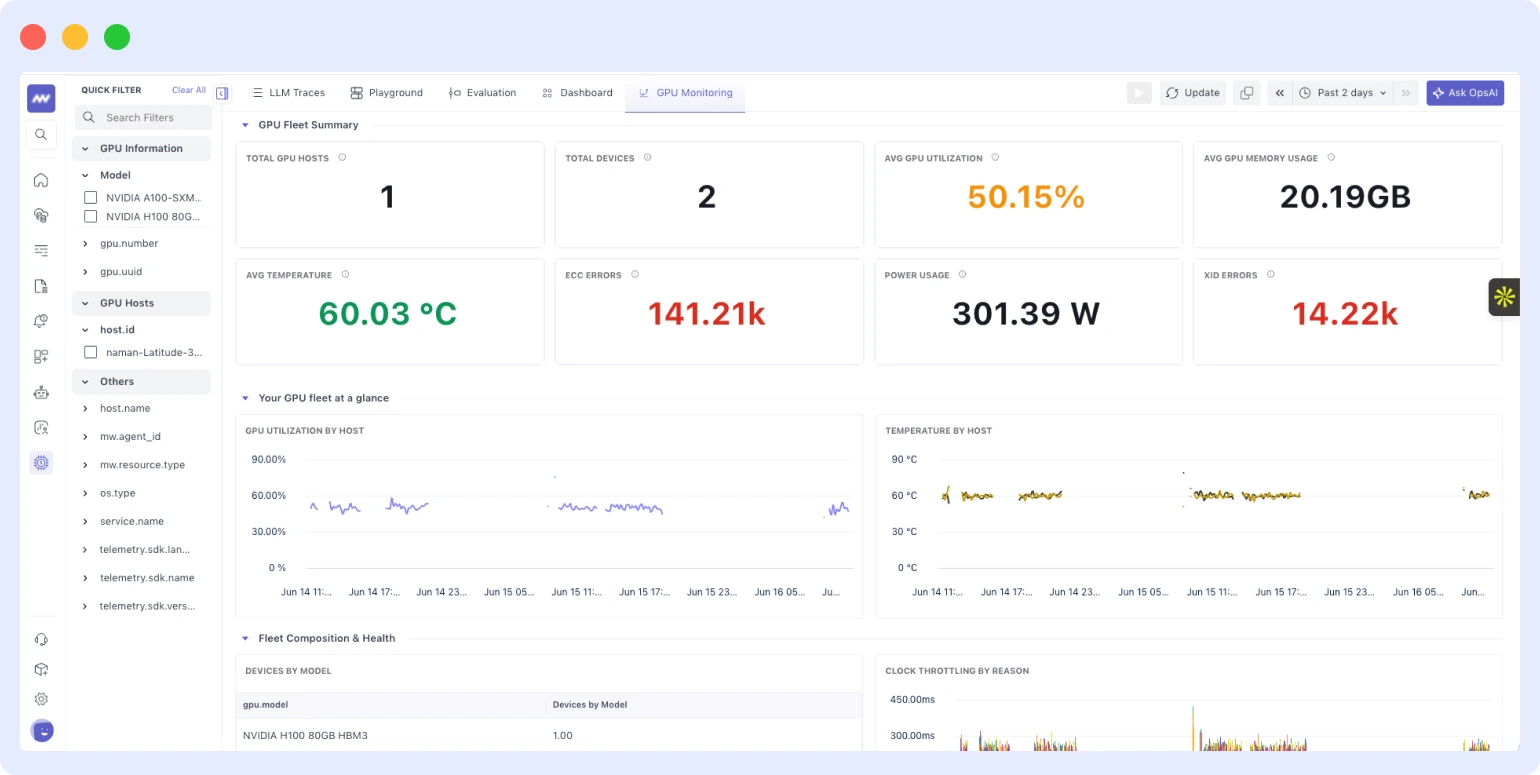
LLMs run on GPUs, and until now, those GPUs were largely invisible from an observability standpoint. Middleware now provides full visibility at both device and host level, covering:
- Utilization: compute and memory utilization per GPU device, with time-series graphs
- Occupancy: how efficiently GPU compute resources are being used relative to theoretical maximum capacity
- Memory: VRAM allocation and free memory the metric that matters most for preventing out-of-memory failures during inference
- Temperature: per-device temperature tracking with alerting configured before thermal throttling occurs
- Power usage: draw per GPU, useful for identifying runaway processes or inefficient model loading patterns
- Bandwidth: memory bandwidth consumption, relevant when diagnosing slow inference on large models
- Processes: which processes are running on each device and their individual resource consumption
This fills the observability gap for teams self-hosting models or running fine-tuning jobs, where infrastructure health is just as important as application-layer performance. A GPU running hot or out of VRAM affects every inference request on that node — you need to see it before it causes failures.
LLM analytics dashboard
Middleware ships a dedicated LLM dashboard with 50+ graph types covering the full range of metrics that matter for production LLM applications:
- Tokens: total volume over time, broken down by model and endpoint
- Cost: per-request and cumulative cost with trend analysis
- Error rate: failure rates by endpoint, model, and error category
- Duration and latency: p50, p95, and p99 latency distribution across request types
- LLM calls: request throughput with anomaly highlighting
- Evaluations: quality score trends from LLM-as-a-Judge over time
- Tools: call frequency and latency per tool
The dashboard supports both real-time and historical views, with drill-down by time range, model, or endpoint. Whether you need a high-level health summary or a granular cost breakdown for a specific endpoint, it is all in one place.
To get started, follow Middleware’s LLM observability documentation. Instrument your application via the OpenLIT SDK once configured, traces, real-time metrics, and evaluation results populate automatically. You can monitor everything from token usage and response times to model quality scores, and set custom alerts so nothing slips through unnoticed.
Explore Middleware’s AI-powered observability platform
Conclusion
Middleware’s LLM Observability gives engineering teams real-time monitoring, debugging, and quality evaluation for production LLM applications. It covers the full stack: GPU infrastructure, distributed traces with token and cost data, automated output evaluation via LLM-as-a-Judge, and a 50+ graph analytics dashboard.
The platform connects to OpsAI, Middleware’s AI SRE agent, which can investigate issues, run Kubernetes commands, and generate dashboards from observability data reducing time from alert to resolution. It includes pipeline capabilities across logs, metrics, traces, and real user monitoring (RUM) to reduce observability costs as data volumes grow.
For teams building with LLMs, Middleware provides the observability layer that production AI systems require.
Monitor, debug, and optimize your LLM applications with Middleware
FAQs
What is LLM observability?
LLM observability is the practice of monitoring, tracing, and evaluating large language model systems in production. It gives engineering teams visibility into token usage, cost per request, response latency, output quality, and GPU infrastructure health across every model call. Unlike traditional application monitoring, LLM observability captures the full context of why a model responded the way it did, what it cost, and whether the output met quality criteria.
What should you monitor in an LLM system?
Three signal categories cover the full operational picture: request metadata (model version, temperature, top_p, prompt details), response metadata (token counts, cost per request, response characteristics), and traces (the full request-response sequence including retrieval steps in RAG workflows). Together these signals surface latency issues, cost anomalies, quality regressions, and infrastructure failures.
What is LLM-as-a-Judge?
LLM-as-a-Judge is an evaluation method where a language model automatically scores the outputs of another language model against defined rules and acceptance criteria. Instead of manually reviewing production responses, you configure the scope, select a judge model, and set quality criteria — the system then scores each prompt-response pair continuously. Middleware includes LLM-as-a-Judge as a built-in evaluation framework that feeds quality scores directly into the LLM analytics dashboard.
Why do LLM applications need GPU monitoring?
LLMs run on GPUs, and GPU health directly affects inference reliability. A node running out of VRAM causes out-of-memory failures. A GPU at thermal throttle slows every request on that host. Without GPU-level observability utilization, memory, temperature, power draw, bandwidth, and active processes infrastructure problems are invisible until they cause application failures. Middleware monitors both device-level and host-level GPU metrics alongside application traces in the same platform.