Exceptional user experience is a prerequisite for a thriving business. Slow-loading pages, sluggish interactions, and subpar performance can lead to bad user experience and increase bounce rates.
Real User Monitoring (RUM) allows visualization of user-application interaction and optimizing the application on a use-case basis.
We are excited to announce the launch of Middleware Real User Monitoring, a powerful tool that enables developers to visualize and understand how users experience their products.
What is Real User Monitoring?
Real User Monitoring (RUM) is a technique used in web application performance monitoring to collect and analyze data from actual website (or application) users. It provides insights into how users interact with the website, allowing developers to identify and resolve performance bottlenecks, optimize user experiences, and improve overall application performance.
RUM mostly uses JavaScript code to collect various metrics such as page load times, network timings, first input delay, errors, and other user-centric data.
Since the data is collected in real-time, RUM delivers higher accuracy than its synthetic counterpart. Tracking the real-time usage of applications helps to identify areas that need to be improved in order ensure user satisfaction.
Getting started with Middleware’ Real User Monitoring
To start with Middleware RUM, install the Middleware JavaScript snippet on your website or application. This snippet collects user browser performance data and sends it to the Middleware platform for analysis.
Once installed, Real User Monitoring data will be available for visualization and analysis in the Middleware dashboard.
Here’s a step-by-step guide to help you get started:
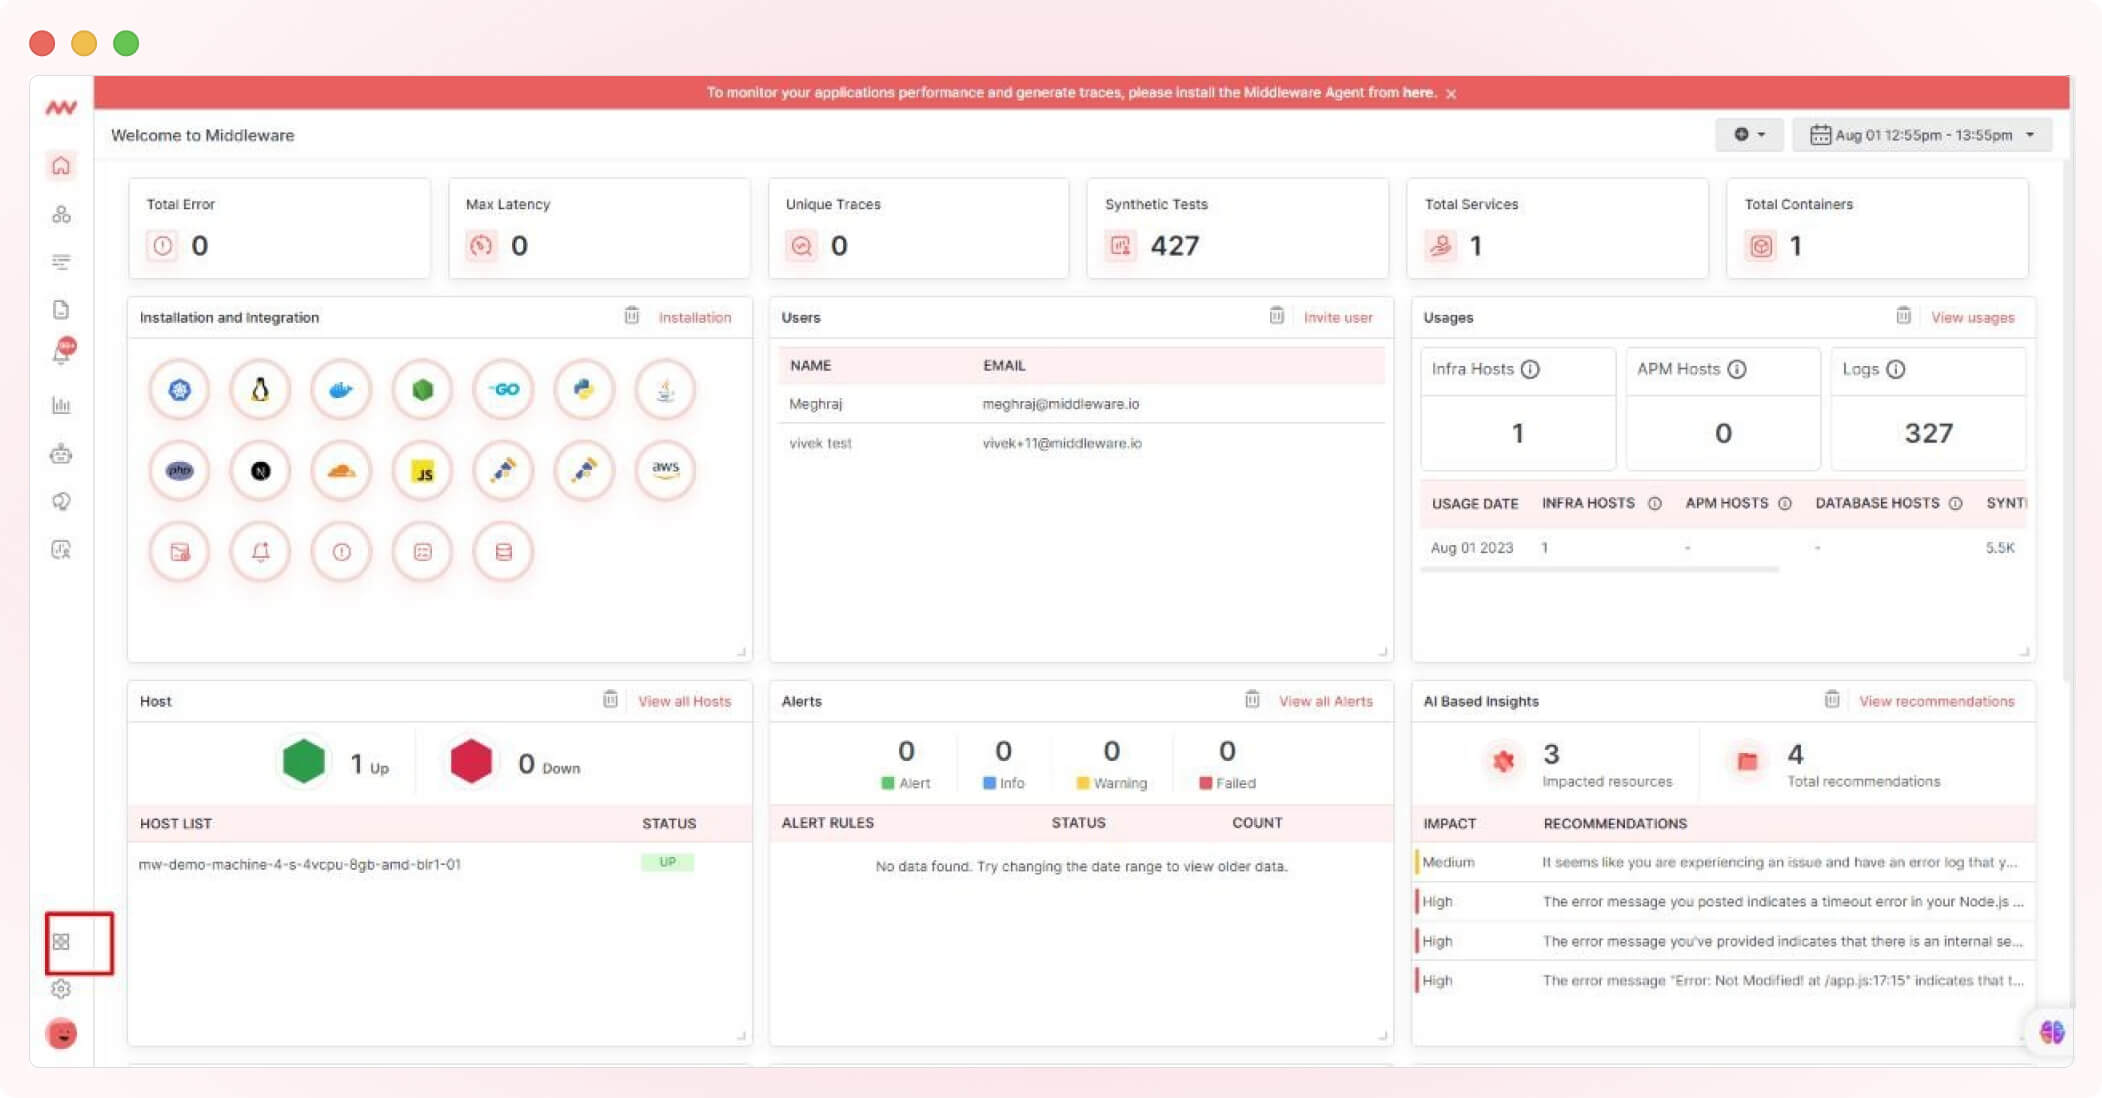
1. Create a Middleware account by visiting middleware.io to sign up. Then log in with your account details to Middleware’s “Unified Observability Platform.” Navigate to the “Installation” icon on the left bar of the dashboard, and click on it.
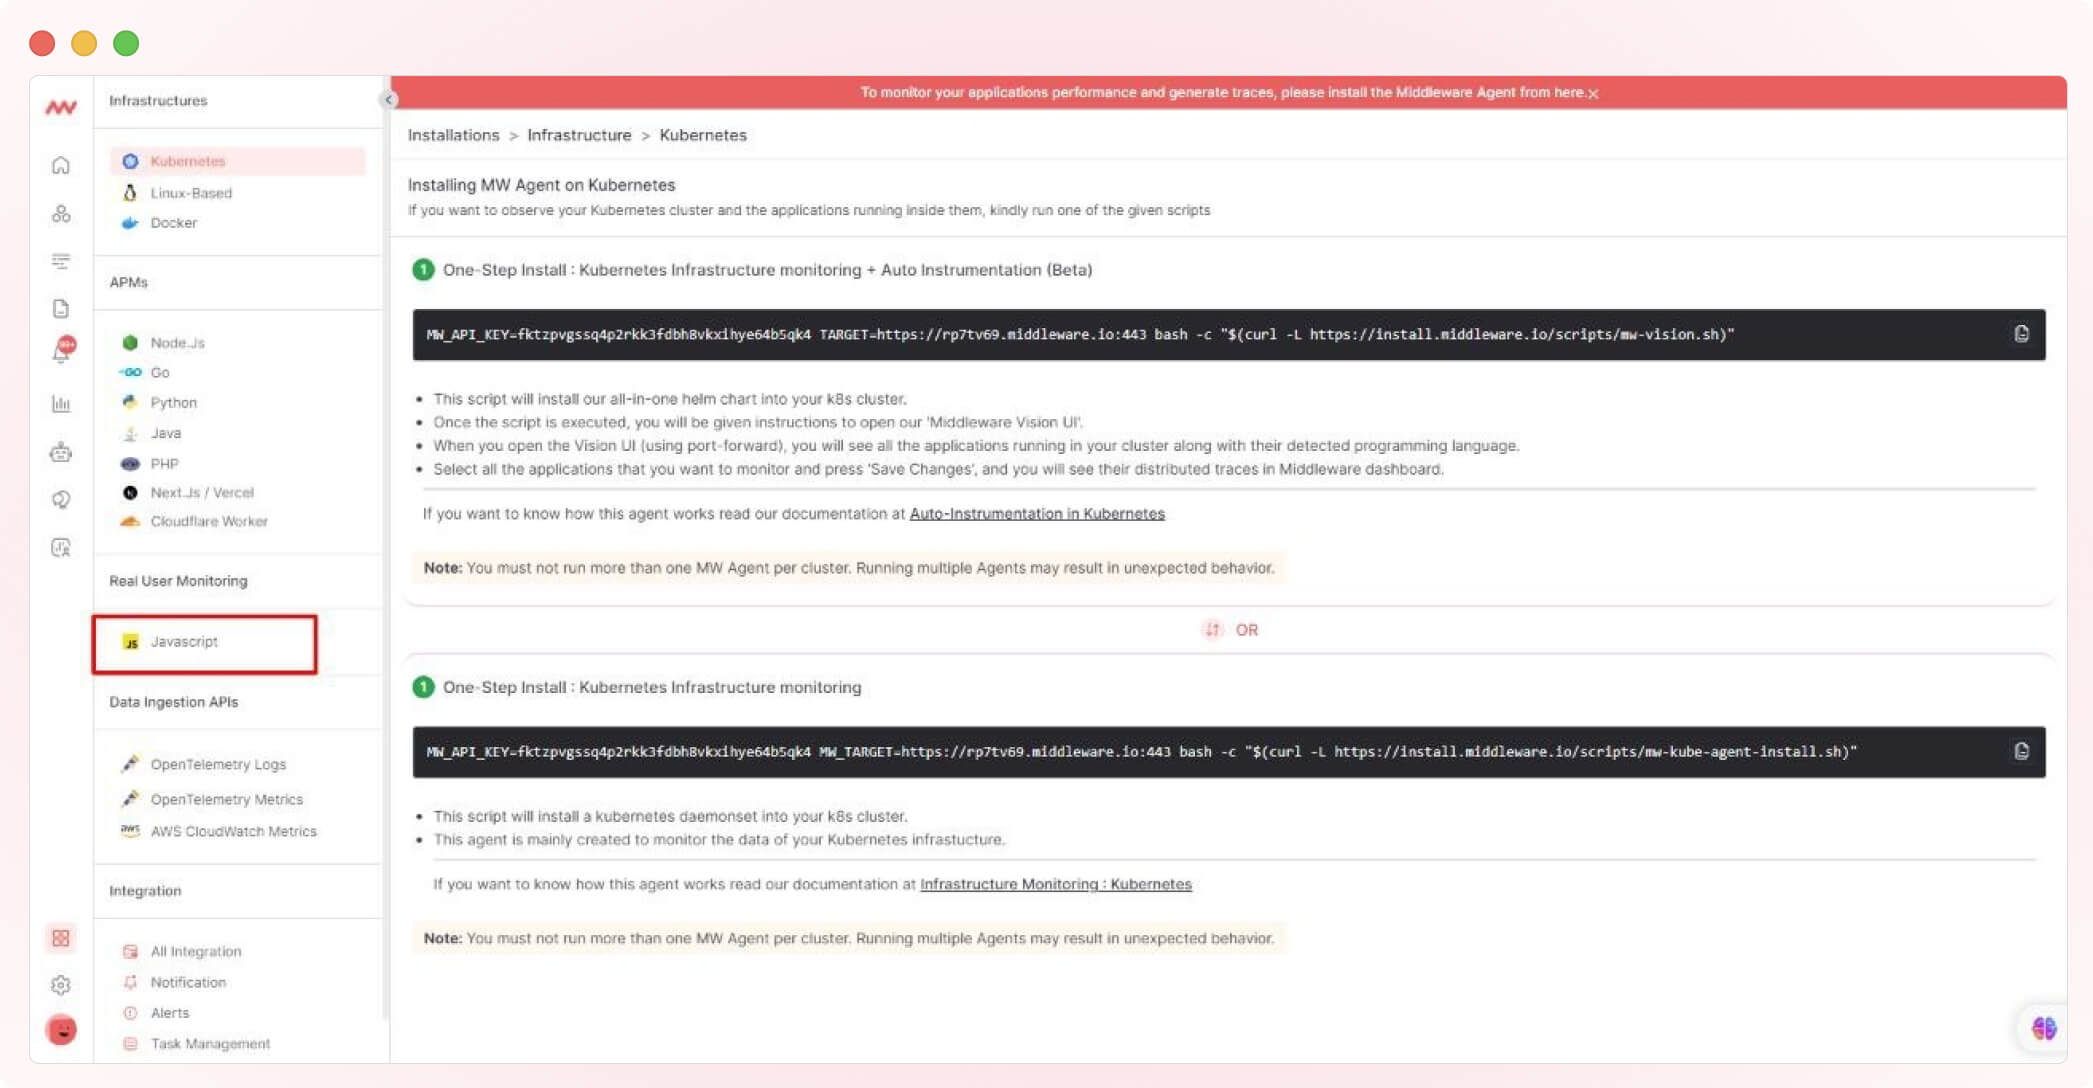
2. Upon clicking on the “Installation” icon, the page below will appear. Then click on “JavaScript.”
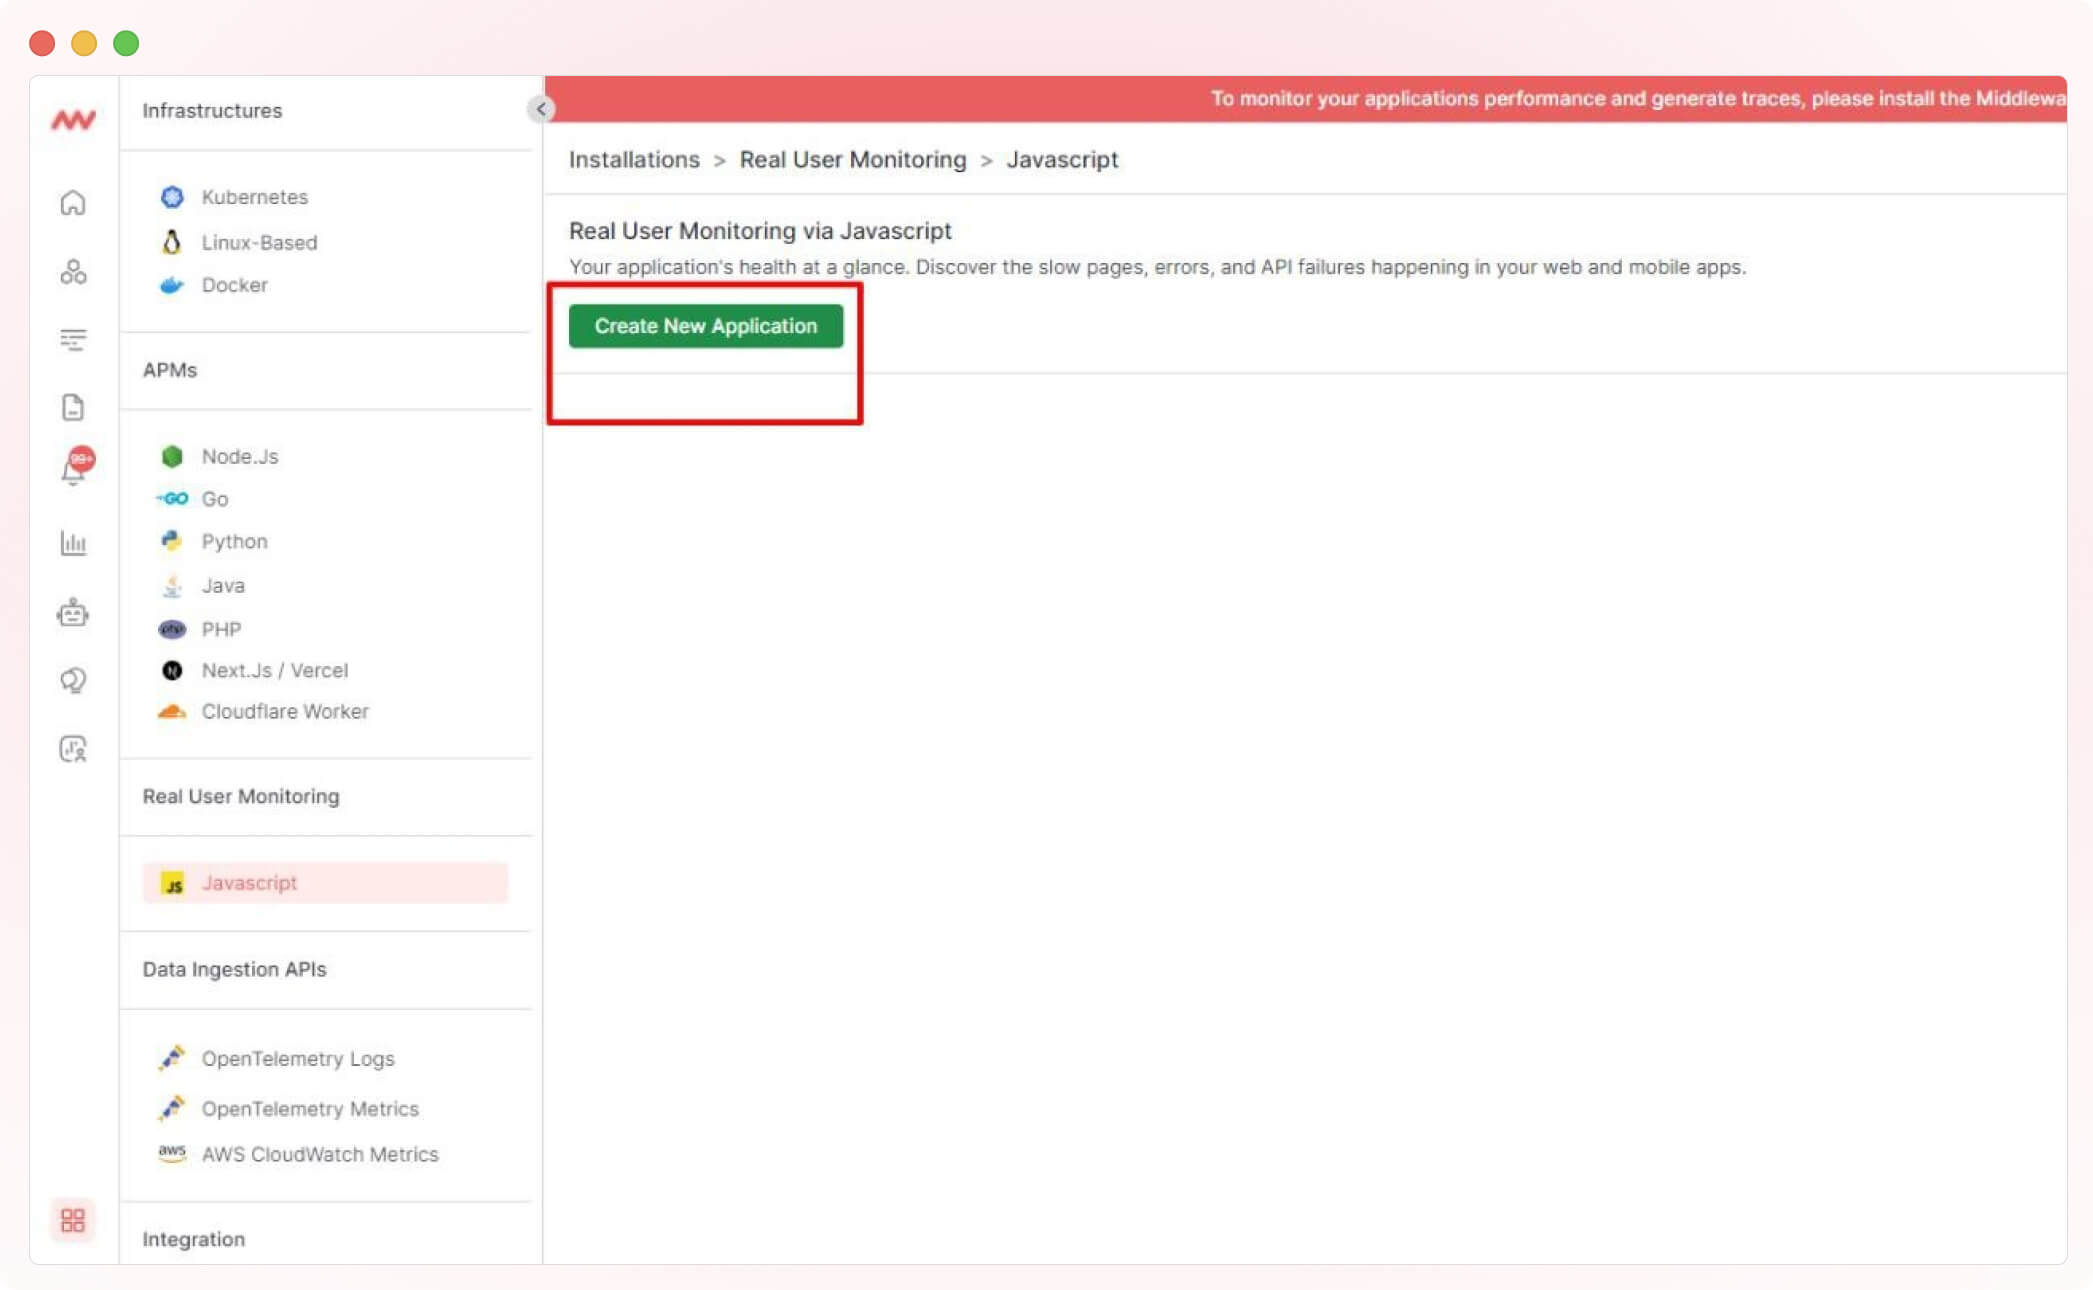
3. Once you click on JavaScript, the page below will appear. Click on “Create Application.”
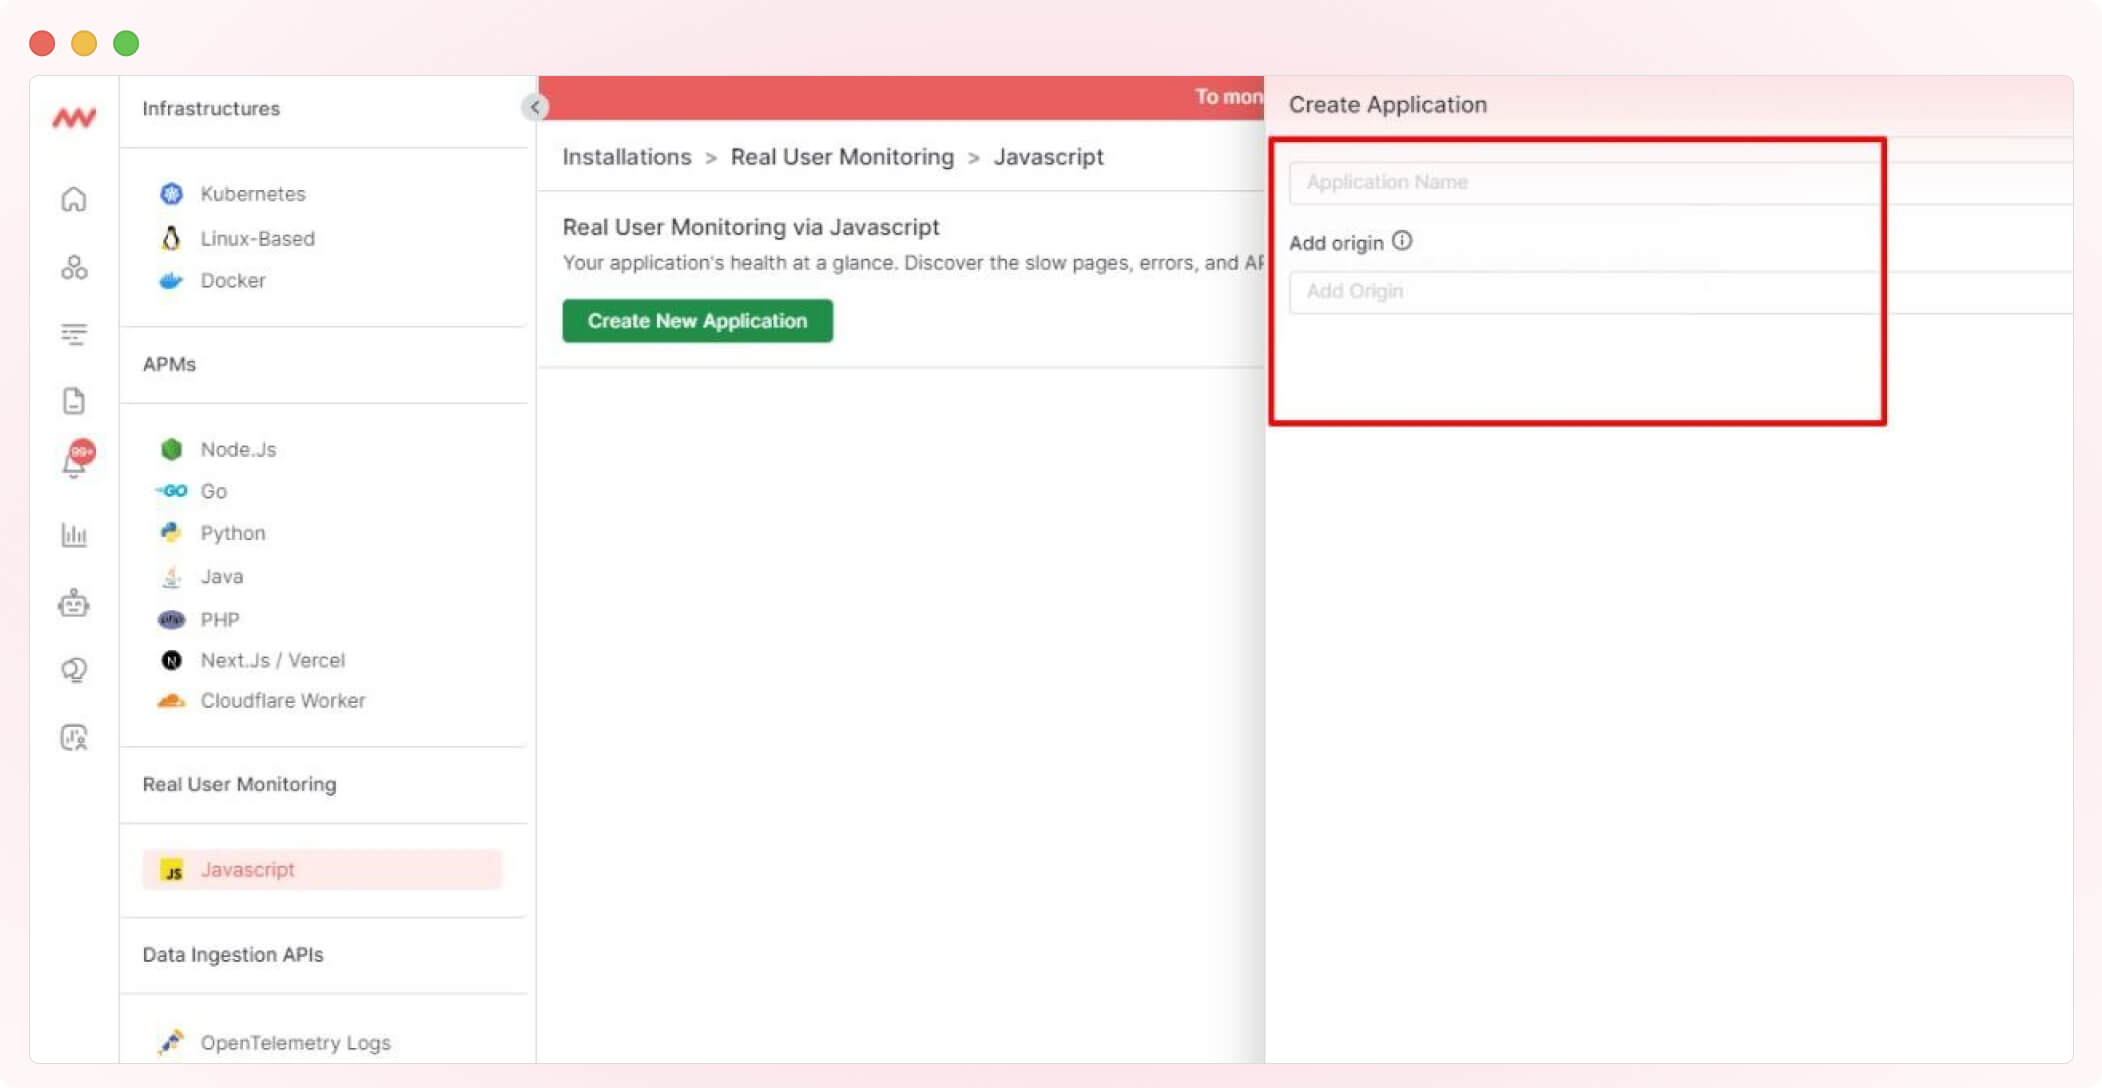
4. Enter your web or application details in the boxes that appear. Enter your “Application” name and enter your domain or website name in the “Add Origin” box.
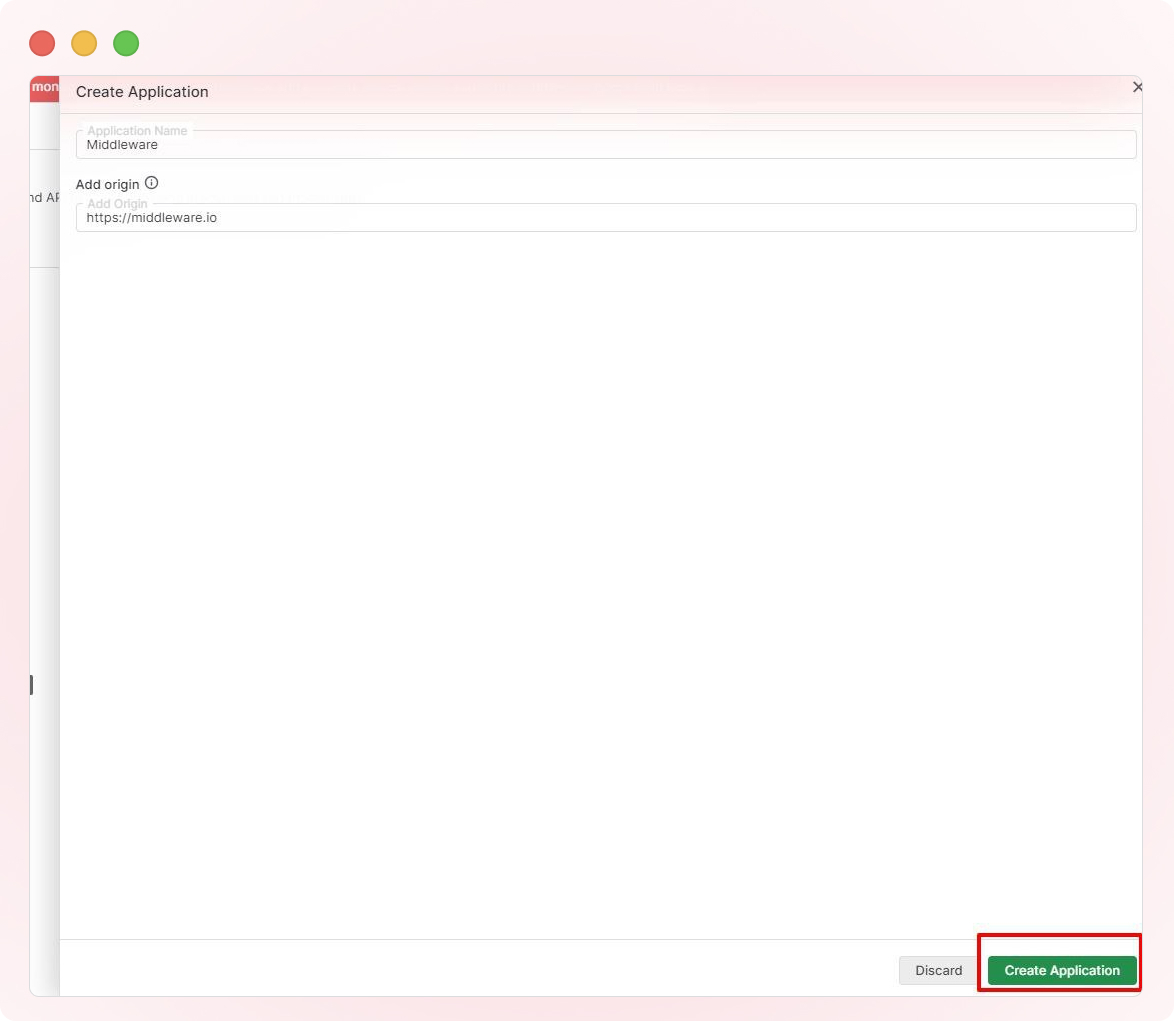
5. Click on “Create Application.”
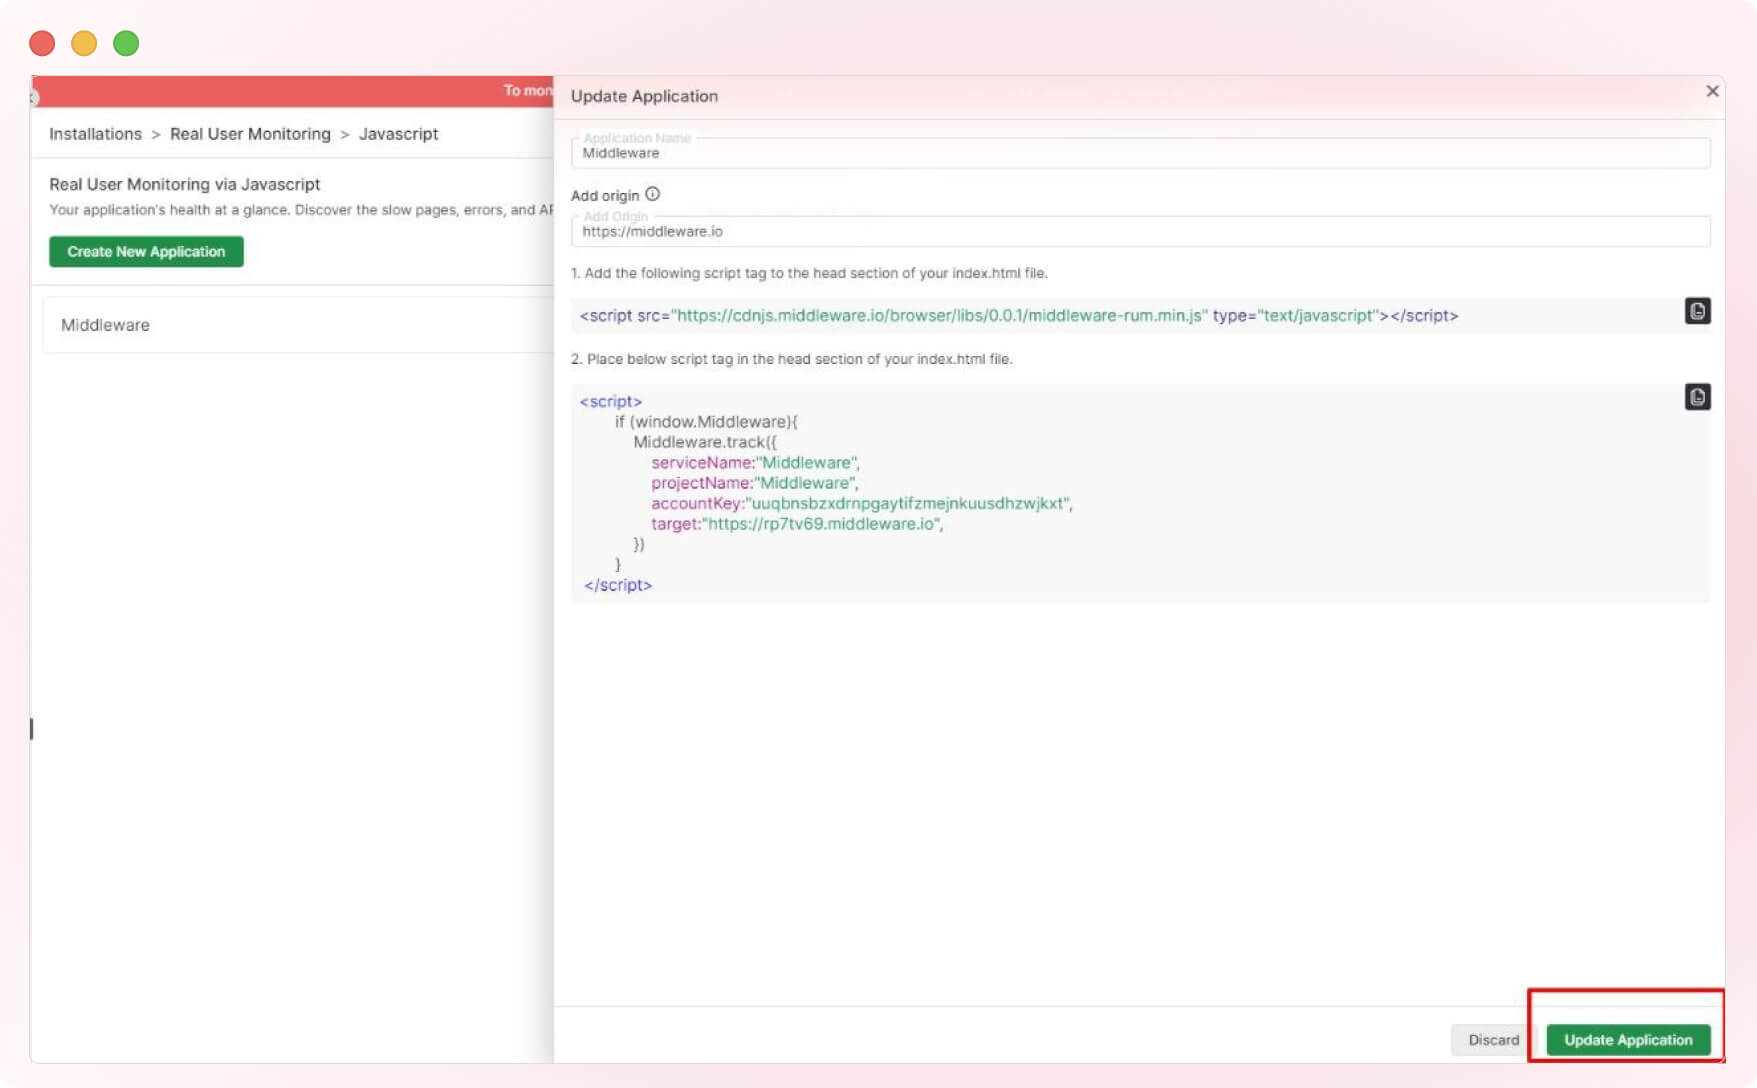
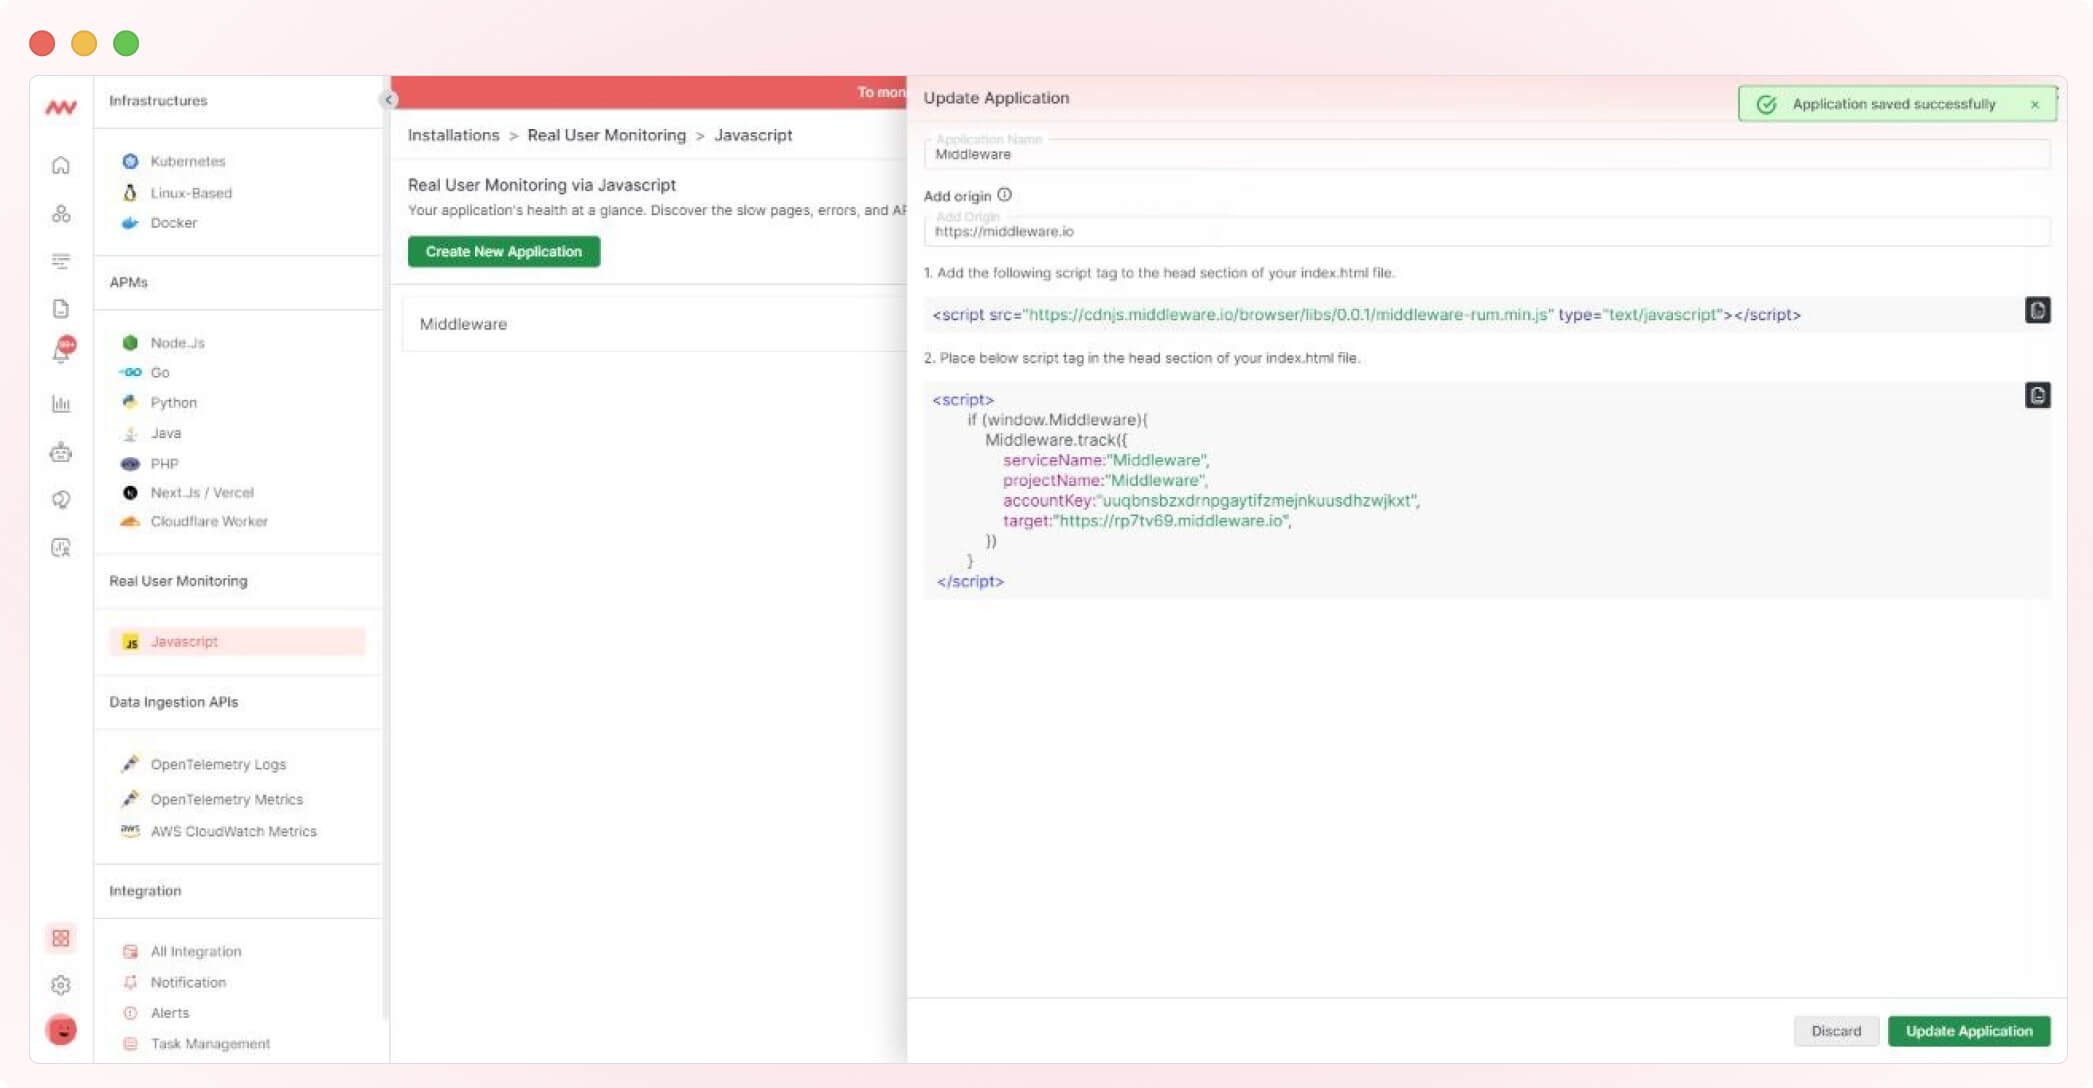
6. A page with JavaScript codes/snippets to be entered on your website appears. These snippets are responsible for collecting performance metrics and user interactions. They should added to the header or footer of your web pages.

Once you enter the snippet into your website, configure the data collection settings according to your needs.
This may need you to mention the metrics you want to track, specify which pages or components to monitor, and adjust sampling rates for optimal data collection.
Return to Middleware’s RUM installation page and click on “Update Application.”
7. Once the configuration is done, a success message will appear at the top of the page, as shown below.
8. Once your RUM implementation is live and collecting data, you can navigate to the RUM Icon to analyze the metrics collected to gain insights into your website’s or app’s performance.
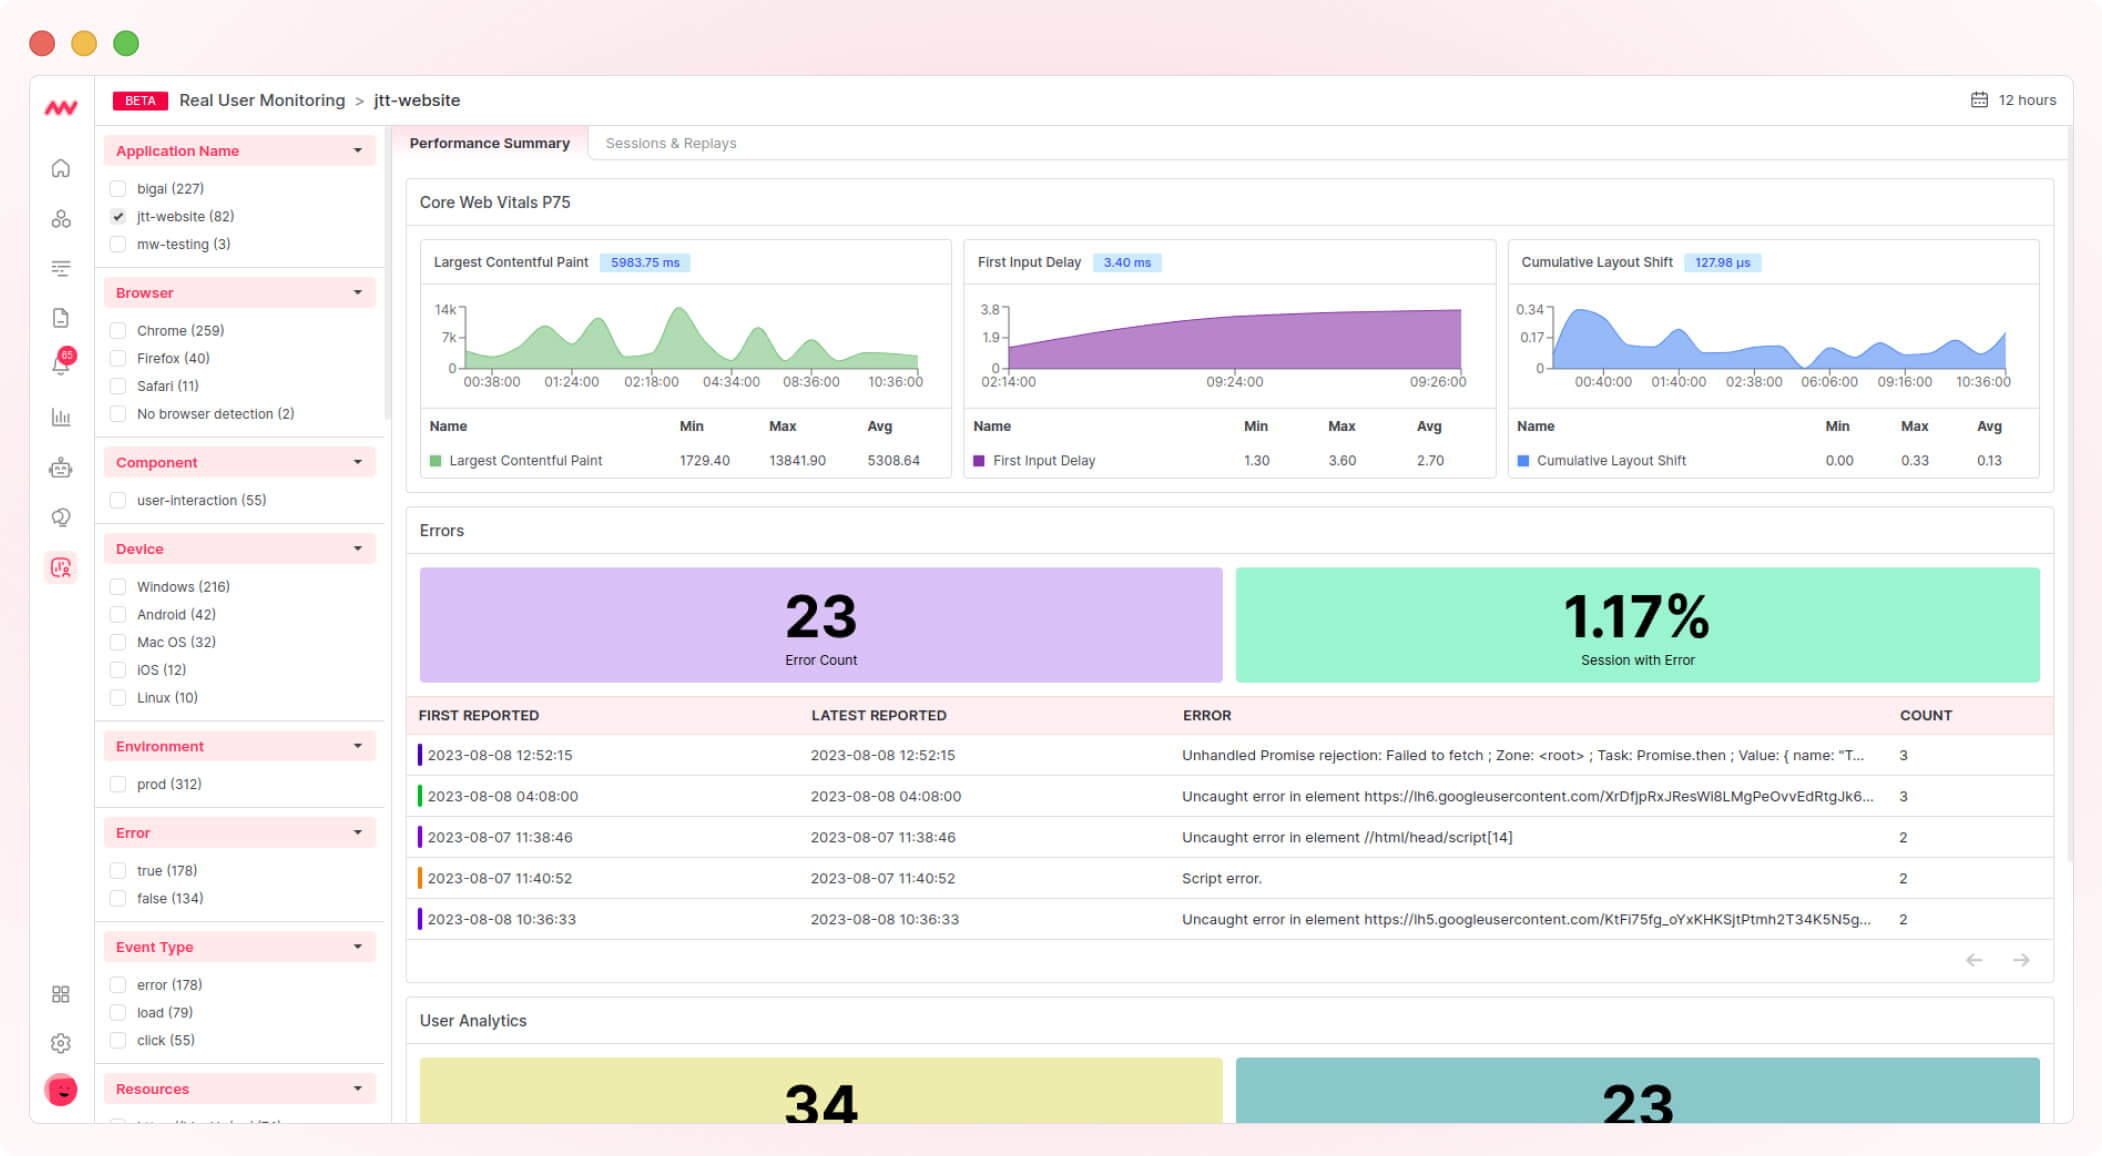
Utilize key metrics such as page load times, resource timings, and user engagement data to identify areas for improvement.
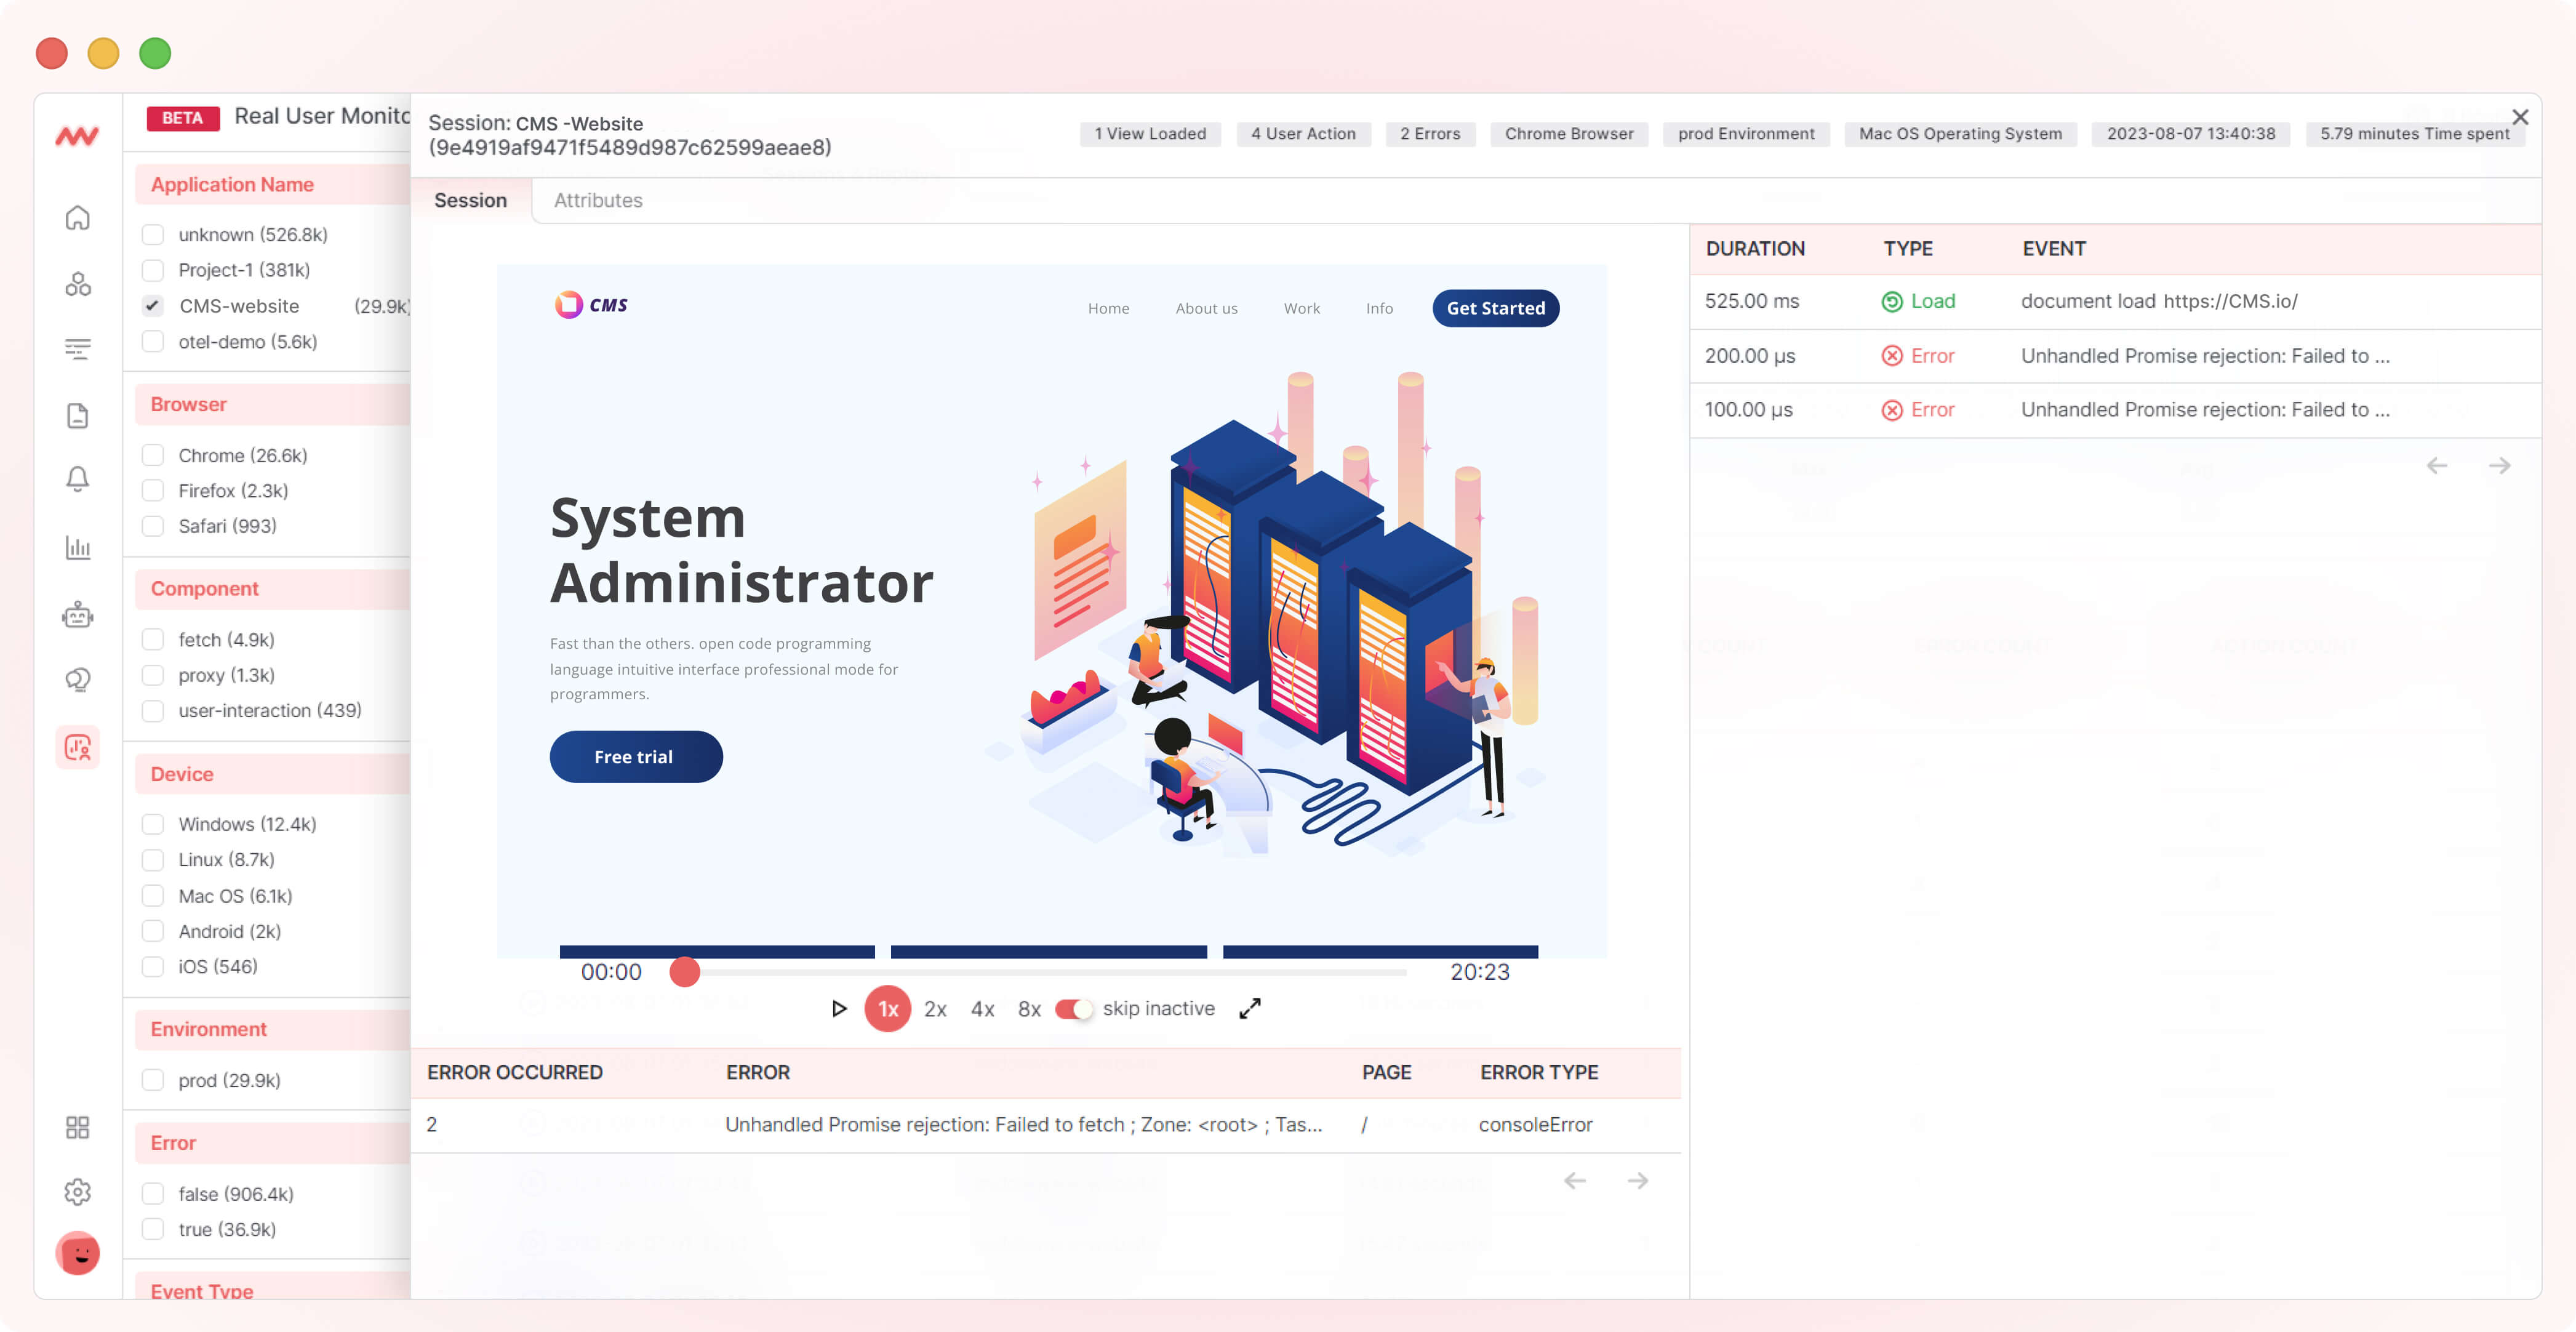
Apart from that, you can also watch session replays of user sessions. These can help you visualize user journeys and identify the issues they might have faced. Your marketing team can also use session replay data to determine your website’s customer journey.
Session replays is one of the key features that differentiates Middleware’s RUM from competing products like New Relic.
9. Continuously monitor the RUM data to gain ongoing insights and make regular improvements. Regularly review the performance metrics, track trends, and identify any anomalies or areas requiring optimization.
Although the above steps provide a general idea of getting started with Middleware RUM, you can always refer to the documentation or request a demo for more help.
Benefits of using Middleware’ RUM
Using Middleware’s real user monitoring solution offers a range of benefits that can help improve web application performance and user experience.
By leveraging these benefits, developers can make data-driven decisions to optimize their web applications’ performance and provide a better user experience. The following are the key benefits:
Visualize user-facing data
Middleware’s RUM allows you to visualize and understand user-facing metrics, such as page load times, response times, user interactions, and errors.
This data provides insights into how your application performs from the user’s perspective, enabling you to optimize user experiences and identify areas for improvement.
Troubleshoot user-facing issues
With RUM tools, you can proactively identify and resolve user-facing issues in real time. By monitoring performance metrics, such as error rates, slow page loads, and high-latency interactions, you can quickly detect and troubleshoot issues that may impact user experience. This helps to minimize any disruptions and ensure a smooth user journey.
Make decisions based on user data
RUM solutions provides valuable user-centric data and insights that can inform your decision-making process. You can make informed decisions about feature prioritization, application improvements, and user experience enhancements by analyzing user behavior, preferences, and demographics.
Middleware’s RUM enables you to optimize your application for different user segments. By analyzing the performance metrics across different user segments, you can focus on areas with the most significant impact on performance.
Improve digital experience
Middleware is easy-to-use, erasing the need to run commands to monitor and analyze application performance.
Furthermore, with Middleware’s RUM, you will get each session recorded of your users for frontend monitoring and a replay of sessions to understand the user journey on your applications (web or mobile).
You can thus skip to the errors and warnings in a click to identify issues quickly.
Performance benchmarking and comparison
Middleware’s RUM provides the ability to benchmark and compare performance over time or against competitors. Tracking performance metrics against historical data or industry benchmarks allows you to monitor trends, set performance targets, and make data-driven decisions to improve your application’s performance.
Real user monitoring use cases
RUM is helpful in many instances. Below are some key RUM use cases:
Minimizing web downtime
When customers report experiencing downtime or performance issues on your website, RUM lets you quickly identify the issues causing downtime and investigate the root cause. You can also analyze performance metrics before, during, and after the reported downtime. This helps in identifying any patterns or anomalies that could be contributing to the issue.
Middleware’s RUM enables you to apply filters to isolate the affected user segments. For example, you can filter by geographical location, browser type, or device type to understand if the issue is specific to certain user groups. This helps narrow the investigation and focus on resolving the problem for the affected users.
Troubleshooting deployment-related problems
Sometimes, a deployment can introduce performance problems or errors in your application. Middleware’s RUM can assist development teams in troubleshooting such deployment-related issues. Here are two examples:
- Application errors after a deployment:
After deploying a new version of your application, you notice increased application errors or crashes. Using RUM, you can analyze the error rates and error messages associated with the new deployment. With filters, you can isolate the users encountering the errors and investigate the specific conditions or actions triggering the errors. This helps in identifying and addressing any bugs or compatibility issues introduced during the deployment.
- Performance degradation after a deployment:
Following a deployment, you observe a degradation in performance metrics, such as slower page load times or increased latency. RUM can help you to determine if the deployment is responsible for the degradation.
Capacity planning and scalability
By observing user traffic patterns, peak usage times, and server response times, you can make informed decisions regarding the infrastructure required to support your application’s growing user base. RUM data helps you anticipate traffic peaks, optimize resource allocation, and ensure a seamless user experience even under high load conditions.
A/B testing and feature rollouts
Real User Monitoring can be used during A/B Testing or Feature Rollouts to evaluate the impact on user experience and performance.
You can determine the success of a new feature or design change by comparing key metrics, such as conversion rates, engagement levels, or error rates, between different user groups.
This data-driven approach enables you to make informed decisions about feature prioritization and future optimizations.
Third-party performance evaluation
RUM can help assess the performance of third-party services and tools integrated into your application.
By monitoring the impact of external dependencies, such as payment gateways, analytics tools, or APIs, on user experiences and load times, you can identify any bottlenecks or performance issues caused by these integrations.
This allows you to optimize the usage of third-party services and ensure they do not impact your application’s performance.
5 RUM best practices everyone must follow
Here are some best practices for RUM implementation:
Define clear monitoring goals
Before implementing RUM, determine the specific metrics and insights you want to capture from real user data. This helps align your monitoring efforts with your business objectives and ensures you focus on collecting the right data.
Instrument your application strategically
Carefully select the pages, user interactions, and events you want to monitor using RUM. Instrumenting every page or interaction may lead to an overload of data, making it challenging to extract actionable insights. Focus on monitoring critical pages, key user flows, and events that impact user experience and performance.
Monitor representative user segments
Ensure your RUM implementation captures data from a representative set of user segments. Consider factors like geographical locations, device types, browsers, and connection speeds to ensure a diverse representation of users.
Optimize data collection
RUM data collection should be optimized to minimize its impact on page load times. Utilize asynchronous loading techniques and set appropriate sampling rates to ensure the data collection process does not degrade the user experience or skew the performance metrics.
Leverage filters and segmentation
Take advantage of the filtering and segmentation capabilities of your RUM tool. Use filters to focus on specific user segments, geographical regions, browser types, or other relevant factors to gain more detailed insights. This helps in understanding and addressing performance issues that may be more prevalent in certain user groups.
Conclusion
Middleware Real User Monitoring equips developers with powerful insights into their web and application performance by capturing and analyzing real user data.
Gain comprehensive user journey visibility for web and mobile applications to identify impactful issues.
By capturing critical performance metrics and user interactions, developers gain a deep understanding of their users’ experience.
Considering its real-time analysis and session replays on a centralized dashboard, Middleware RUM is a valuable tool for developers and organizations to optimize their web application performance and enhance user experiences that can translate into better financial outcomes.