According to the 2024 State of CI/CD Report, over 80% of DevOps teams now use CI/CD pipelines, making them one of the fastest-adopted DevOps practices. In recent years, DevOps has risen to become a more prominent approach to how teams deliver software. One of the goals of this framework is to optimize and automate the actual software release process.
The modern approach of using a CI/CD pipeline seeks to solve these issues by building a workflow designed through the collaboration of integrated or cross-functional teams (i.e., application developer, QA tester, DevOps engineer).
In this post, you will learn what a CI/CD pipeline is, the phases it consists of, the benefits it provides, some of the top CI/CD tools, and other key concepts on this topic.
What is the CI/CD Pipeline?
CI/CD pipeline is a workflow that automates the build, test, integration, and deployment of high-quality software. It is a sequential process that optimizes the software release cycle from code changes committed to a source code repository through deployment to a runtime environment.
Considering that modern software development entails the usage of multiple environments (i.e., dev, stage, prod), building a workflow that aims to achieve the same goals as a CI/CD pipeline, albeit manually, is tedious, time-consuming, and doesn’t scale well.
To better understand CI/CD pipelines, we need to consider the core concepts they encompass, such as continuous integration and continuous delivery.
What is Continuous Integration?
Continuous integration is the first main step in a CI/CD pipeline and focuses on building the application and running a series of automated tests. Each has a distinct goal, but the main objective is to ensure that the new source code being committed meets the relevant criteria in terms of quality.
Continuous integration aims to prevent the introduction of issues into the main branch of your source code repository, which typically houses the stable version of the application.
What is Continuous Delivery?
CD can mean Continuous Delivery or Continuous Deployment (or both). In Continuous Delivery, the build is always deployment-ready and is manually released; in Continuous Deployment, every successful build is automatically deployed to production.
Continuous delivery picks up where continuous integration ends and can also be considered an extension of continuous integration. The main objective in continuous delivery is to release the software built and tested in the CI stage.
It also emphasizes the strategy around how the software is released. However, it does include human intervention. Teams can release the software through the click of a button daily, weekly or some other timeline that is agreed on.
Once triggered, the application will be automatically deployed to the respective environment.
Continuous Delivery vs Continuous Deployment: What’s the Real Difference?
Even though both terms look similar, they represent two very different maturity levels in a CI/CD setup. Adding this clarity helps users understand which approach fits their team.
Continuous Delivery ensures that your code is always in a deploy-ready state. Every change passes automated tests, builds successfully, and can be deployed with a single click — but the final decision is manual.
Example: Your team pushes the latest build to staging automatically, but a release manager approves production deployment.
Continuous Deployment, on the other hand, goes one step further. Every successful change is deployed automatically to production with no human intervention. It relies heavily on reliable test automation, strong monitoring, and rollback strategies.
| Factor | Continuous Delivery | Continuous Deployment |
| Deployment to Production | Manual approval required | 100% automated |
| Speed of Releases | Frequent, but controlled | Rapid, several times daily |
| Testing Requirement | High test coverage needed | Very high test coverage + monitoring |
| Risk Level | Medium | Higher without proper guardrails |
| Best For | Teams needing release control | Mature teams with strong QA automation |
Netflix, Meta, and Amazon use continuous deployment to ship updates hundreds of times a day.
Most mid-size SaaS companies follow continuous delivery for better governance and compliance.
Real-World CI/CD Pipeline Examples
1. Netflix – Rapid Continuous Deployment at Scale
Netflix deploys thousands of code changes per day. Their CI/CD pipeline automatically tests, builds, and deploys microservices using Spinnaker. Automated canary analysis decides whether a new version should roll out further or auto-rollback.
Key takeaway: Automated rollbacks and real-time monitoring make high deployment frequency safe.
2. Etsy – Reliable Deployments for a High-Traffic Marketplace
Etsy has transitioned from performing manual weekly deployments to deploying more than 50 times per day to its production environment by using Continuous Integration/Continuous Deployment (CI/CD). Automated testing, feature flags, and monitoring in real-time have all allowed Etsy to quickly find problems before they reach the customer.
Key takeaway: CI/CD dramatically reduces deployment anxiety and increases developer confidence.
3. Amazon – Thousands of Deployments Per Hour
Amazon Web Services uses CI/CD to deploy services globally across regions. AWS employs CI/CD to deploy services globally across multiple regions. Most teams have implemented full continuous deployment, including automated triggers, deep visibility, and blue-green deployments.
Key takeaway: Standardizing deployment processes allows even massive organizations to ship safely.
🔍See how Middleware can reduce deployment failures with real-time monitoring → Explore Middleware APM
4. A Small SaaS Startup – Faster Delivery with Limited Resources
Smaller SaaS teams automate testing, container builds, and staging deployments via CI/CD tools like GitHub Actions or GitLab CI. This reduces operational load and accelerates customer feedback loops.
Key takeaway: CI/CD is not just for tech giants — even small teams can build reliable pipelines cheaply.
Read also: CI/CD best practices
Phases of CI/CD Pipeline
In practice, CI/CD pipelines may vary depending on a number of factors, such as the nature of the application, source code repository setup, software architecture, and other important aspects of the software project.
Below is a practical breakdown of each CI/CD stage with examples of tools and workflows used by real engineering teams.
1. Source Stage
The Source stage begins whenever new code is pushed, merged, or a pull request is created in a version control system like GitHub, GitLab, or Bitbucket. This event acts as the trigger for the entire CI/CD pipeline. Teams typically use branching strategies (GitFlow, trunk-based development) to ensure clean integration and avoid merge conflicts.
In real projects, developers also enforce checks like commit linting, secret scanning, and code formatting at this stage to prevent bad code from entering the pipeline. Tools such as GitHub Protect, GitLab Secure, or pre-commit hooks automatically scan for secrets, credentials, and policy violations before allowing the pipeline to proceed.
2. Compile or Build Stage
The Build stage compiles the source code, resolves dependencies, and packages the application into a deployable artifact (JAR, binary, Docker image, etc.). Common tools used here include Jenkins, GitHub Actions, GitLab runners, CircleCI, and AWS CodeBuild.
For cloud-native projects, the build process typically creates Docker images using Dockerfiles or buildpacks. These images are tagged with version numbers or Git commit SHA and pushed to a container registry like Docker Hub, GitHub Container Registry, or Amazon ECR.
Most teams also integrate static code analysis tools (like SonarQube, Snyk, or Trivy) in the build process to catch code smells, vulnerabilities, and outdated libraries before they reach production.
3. Test Stage
The Test stage runs automated tests to ensure the application works as intended. This usually starts with fast unit tests, followed by deeper integration tests, API tests, and UI tests using frameworks like JUnit, pytest, Selenium, Cypress, or Postman automation.
In modern pipelines, teams run tests in parallel containers to reduce execution time. For example, GitHub Actions and GitLab CI allow matrix builds that test multiple environments (Python 3.9–3.12, Node 16–20) simultaneously.
Teams also configure test reports, code coverage thresholds, and test-artifacts uploads. Coverage tools such as JaCoCo, Coverage.py, or Codecov ensure that minimum quality gates are met before moving to the deployment stage.
4. Deploy or Deliver Stage
During the deploy phase, the application is delivered to the staging and/or production environment. The majority of teams will use Infrastructure-as-Code tools (Terraform, Ansible, Helm Charts) or container orchestration engines (Kubernetes) for deployment, whereas serverless applications will typically be deployed to cloud service providers such as AWS Lambda, Google Cloud Functions or Azure Functions.
Pipelines commonly push Docker images to Kubernetes clusters via GitOps tools such as ArgoCD or Flux, ensuring every deployment is version-controlled and auditable. In traditional CI/CD setups, tools like AWS CodeDeploy, Octopus Deploy, or Spinnaker handle rolling or blue-green deployments.
Many teams add automatic smoke testing and health checks after deployment. If a deployment fails, automated rollback rules restore the previous stable version, reducing downtime and improving reliability.
5. Monitor Stage
The CI/CD journey doesn’t end with deployment. Continuous monitoring captures real-time performance, logs, metrics, and errors across environments. Tools like Middleware, Prometheus, Grafana, CloudWatch, and Datadog help teams quickly identify regressions, spikes, or failures.
Monitoring ensures:
- Fast incident detection
- Automatic rollback triggers
- Improved reliability
- Better developer feedback loops
| Stage | What Happens | Popular Tools | Security Focus |
| Source | Code commit triggers pipeline | GitHub, GitLab | Secret scans, commit rules |
| Build | Compile/package app | Jenkins, GitHub Actions | SAST, dependency scan |
| Test | Automated quality tests | Selenium, JUnit, pytest | Vulnerability scanning |
| Deploy | Push to prod/staging | Kubernetes, Terraform | IAM, supply-chain security |
| Monitor | Reliability tracking | Middleware, Grafana | Anomaly detection |
With monitoring in place, teams can ensure reliability and gain insights that feed directly into faster, safer software delivery. Let’s look at the key benefits CI/CD pipelines bring to engineering teams.
Benefits of the CI/CD Pipeline
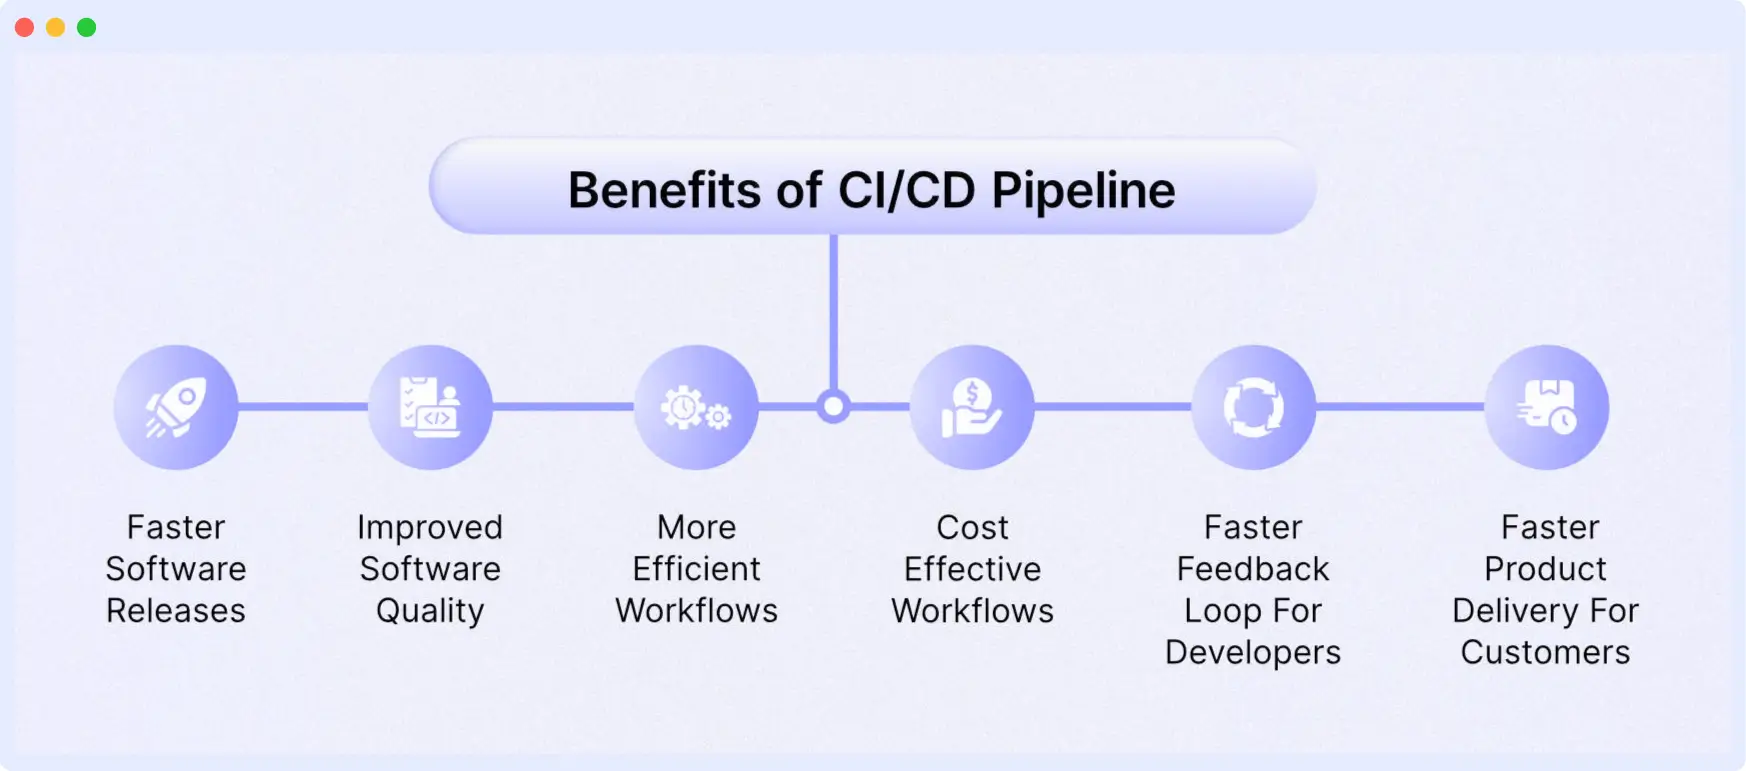
CI/CD pipelines allow engineering groups to provide software solutions more quickly, of greater quality and reduce the frequency of production problems. The automation of the software delivery lifecycle decreases the time spent on manual activities while increasing innovation through improvement in innovation.
Major benefits gained from use of a CI/CD Pipeline in modern development workflows include:
Faster Release Cycles (Ship Features in Hours, Not Weeks)
In the use of Continuous Integration/Continuous Delivery (CI/CD), the automating of the build, test and deployment phases provides teams with freedom from the time-consuming and manual processes, enabling them to deliver multiple updates on a daily basis rather than enduring the longer, traditional release cycles.
According to many studies done by industry analysts (DORA and Accelerate), organizations using CI/CD have faster release velocity than their counterparts who do not, 60–80%.

Improved Code Quality & Early Bug Detection
Continuous Integration ensures developers merge smaller, frequent code changes, making issues easier to detect and fix. Automated tests catch bugs early before they reach production.
How this helps:
- Fewer regressions
- Higher test coverage
- Reduced firefighting for engineering teams
Higher Deployment Reliability & Fewer Failed Releases
CI/CD pipelines enforce repeatable, predictable deployment processes. Because deployments are automated, the chances of human error drop dramatically.
Modern teams use:
- Blue-green deployments
- Canary releases
- Automated rollback rules
These patterns ensure safer releases and faster recovery if something goes wrong.
Stronger Security & Compliance (Shift-Left Security)
Security integrates directly into the pipeline through automated scans and checks:
- SAST/DAST scanning
- Container image scanning
- Dependency vulnerability checks
- Secret detection
- Policy enforcement
Running security tools early reduces the risk of production vulnerabilities and accelerates compliance.
Better Collaboration Between Developers & Ops
CI/CD bridges the gap between development and operations teams by providing shared visibility into builds, tests, deployments, and logs.
This leads to:
- Improved DevOps culture
- Fewer environment-related issues
- More transparency
- Faster troubleshooting
Cost Savings Through Automation
Automation reduces repetitive manual work, saving engineering time and lowering operational costs.
You save money by:
- Reducing manual testing effort
- Minimizing downtime
- Avoiding long QA cycles
- Preventing production outages early
Companies adopting mature CI/CD pipelines report 23–35% cost reduction in software delivery.
Faster Feedback Loops & Improved Developer Productivity
Developers get instant feedback on code quality, test results, and deployment status. This shortens iteration cycles and boosts overall productivity.
Benefits include:
- Less context switching
- Faster bug fixes
- More time spent building features instead of managing pipelines
Enhanced Customer Experience & Faster Innovation
Reliable and frequent releases directly improve customer satisfaction. Users get new features, enhancements, and fixes faster.
Companies like Netflix, Meta, and GitHub rely heavily on CI/CD to support rapid innovation.
Standardized, Repeatable Delivery Process
Every code change goes through the same automated pipeline, ensuring consistent build quality and deployment behavior across all environments (dev → stage → prod).
This consistency is critical for large teams, microservices architectures, and distributed engineering.
Example of a CI/CD Pipeline in Action
This section will cover an example of a CI/CD pipeline using GitHub Actions. The example application is a Node.js application that will be deployed to an Amazon EKS cluster. During the continuous integration phase, the application will be tested, built, and then pushed to a Docker Hub repository.
In the final phase, a connection will be established with the Amazon EKS cluster before deploying the Node.js application using a tool called Skaffold.
This is not a step-by-step tutorial. However, the project files have been detailed below for you to recreate on your own should you wish to. All the source code below can be found in this repository.
Project structure
├── .github/workflows/main.yml
├── Dockerfile
├── manifests.yaml
├── node_modules
├── package-lock.json
├── package.json
├── skaffold.yaml
└── src
   ├── app.js
   ├── index.js
   └── test/index.js
Prerequisites
- AWS Account
- GitHub Account
- Node.js
- Docker
- Terraform (to create K8s cluster with IaC)
Application source code
package.json
{
  "name"  : "nodejs-express-test",
 "version"  : "1.0.0",
 "description"  : "",
  "main"  : "index.js",
  "scripts"  : {
    "start"  : "node src/index.js",
    "dev"  : "nodemon src/index.js",
    "test"  : "mocha 'src/test/**/*.js'"
  },
 "repository" : {
 "type" : "git",
 "url" : "git+https://github.com/YourGitHubUserName/gitrepo.git"
  },
 "author" : "Your Name",
  "license" : "ISC",
  "dependencies" : {
    "body-parser" : "^1.19.0",
    "cors" : "^2.8.5",
    "express" : "^4.17.1"
  },
  "devDependencies" : {
    "chai" : "^4.3.4",
    "mocha" : "^9.0.2",
    "nodemon" : "^2.0.12",
    "supertest" : "^6.1.3"
  }
}
app.js
// Express App Setup
const express  = require('express');
const http  = require('http');
const bodyParser  = require('body-parser');
const cors  = require('cors');

// Initialization
const app  = express();
app.use (cors());
app.use (bodyParser.json());

// Express route handlers
app.get('/test', (req, res)  => {
  res.status(200).send ({ text: 'The application is working!' });
});

module.exports  = app;
index.js
const http  = require('http');
const app  = require('./app');

// Server
const port  = process.env.PORT || 8080;
const server  = http.createServer(app);
server.listen (port, () => console.log(`Server running on port ${port}`))
test/index.js
const { expect }  = require('chai');
const { agent }  = require('supertest');
const app  = require('../app');

const request  = agent;

describe ('Some controller', () => {
  it ('Get request to /test returns some text', async () => {
    const res  = await request(app).get('/test');
    const textResponse  = res.body;
    expect (res.status).to.equal(200);
    expect (textResponse.text).to.be.a('string');
    expect (textResponse.text).to.equal('The application is working!');
  });
});
manifests.yaml
apiVersion : apps/v1
kind : Deployment
metadata:
 name : express-test
spec:
 replicas : 3
 selector:
   matchLabels :
     app : express-test
 template:
   metadata :
     labels :
       app : express-test
   spec:
     containers :
     - name : express-test
       image : /express-test
       resources:
          limits :
            memory : 128Mi
            cpu : 500m
       ports:
       - containerPort : 8080
apiVersion : v1
kind : Service
metadata :
  name : express-test-svc
spec :
  selector :
    app : express-test
  type : LoadBalancer
  ports :
  - protocol : TCP
    port : 8080
    targetPort : 8080
Dockerfile
FROM node :14-alpine
WORKDIR /usr/src/app
COPY ["package.json", "package-lock.json*", "npm-shrinkwrap.json*", "./"]
RUN npm install
COPY . .
EXPOSE 8080
RUN chown -R node /usr/src/app
USER node
CMD ["npm", "start"]
Create Amazon EKS cluster with Terraform
You can create an Amazon EKS cluster in your AWS account using the Terraform source code. It is available in the Amazon EKS Blueprints for Terraform repository.
GitHub actions configuration file
(.github/workflows/main.yml)
name : 'Build & Deploy to EKS'
on :
  push:
    branches:
      - main
env :
  AWS_ACCESS_KEY_ID: ${{ secrets.AWS_ACCESS_KEY_ID }}
  AWS_SECRET_ACCESS_KEY: ${{ secrets.AWS_SECRET_ACCESS_KEY }}
  EKS_CLUSTER: ${{ secrets.EKS_CLUSTER }}
  EKS_REGION: ${{ secrets.EKS_REGION }}
  DOCKER_ID: ${{ secrets.DOCKER_ID }}
  DOCKER_PW: ${{ secrets.DOCKER_PW }}
# SKAFFOLD_DEFAULT_REPO :
jobs :
  deploy :
    name : Deploy
    runs-on : ubuntu-latest
    env :
      ACTIONS_ALLOW_UNSECURE_COMMANDS: 'true'
    steps :
      # Install Node.js dependencies
      - uses: actions/checkout@v3
      - uses: actions/setup-node@v3
        with:
          node-version: '14'
      - run: npm install
      - run: npm test
      # Login to Docker registry
      - name: Login to Docker Hub
        uses: docker/login-action@v1
        with:
          username: ${{ secrets.DOCKER_ID }}
          password: ${{ secrets.DOCKER_PW }}
      # Install kubectl
      - name: Install kubectl
        run: |
          curl -LO "https://dl.k8s.io/release/$(curl -L -s https://dl.k8s.io/
release/stable.txt)/bin/linux/amd64/kubectl"
          curl -LO "https://dl.k8s.io/$(curl -L -s https://dl.k8s.io/release/
stable.txt)/bin/linux/amd64/kubectl.sha256"
          echo "$(kubectl.sha256) kubectl"="" |="" sha256sum="" --check=""
sudo="" install="" -o="" root="" -g="" -m="" 0755="" kubectl="" usr="" local=""
bin="" version="" --client="" # Install Skaffold
      - name: Install Skaffold
        run: |
          curl -Lo skaffold https://storage.googleapis.com/skaffold/releases/
latest/skaffold-linux-amd64 && \
          sudo install skaffold /usr/local/bin/
          skaffold version
      # Cache skaffold image builds & config
      - name: Cache skaffold image builds & config
        uses: actions/cache@v2
        with:
          path: ~/.skaffold/
          key: fixed-${{ github.sha }}
      # Check AWS version and configure profile
      - name: Check AWS version
        run: |
          aws --version
          aws configure set aws_access_key_id $AWS_ACCESS_KEY_ID
          aws configure set aws_secret_access_key $AWS_SECRET_ACCESS_KEY
          aws configure set region $EKS_REGION
          aws sts get-caller-identity
      # Connect to EKS cluster
      - name: Connect to EKS cluster
        run: aws eks --region $EKS_REGION update-kubeconfig --name $EKS_CLUSTER
      # Build and deploy to EKS cluster
      - name: Build and then deploy to EKS cluster with Skaffold
        run: skaffold run
      # Verify deployment
      - name: Verify deployment
        run: kubectl get pods
kubectl.sha256)
Successful Pipeline Example
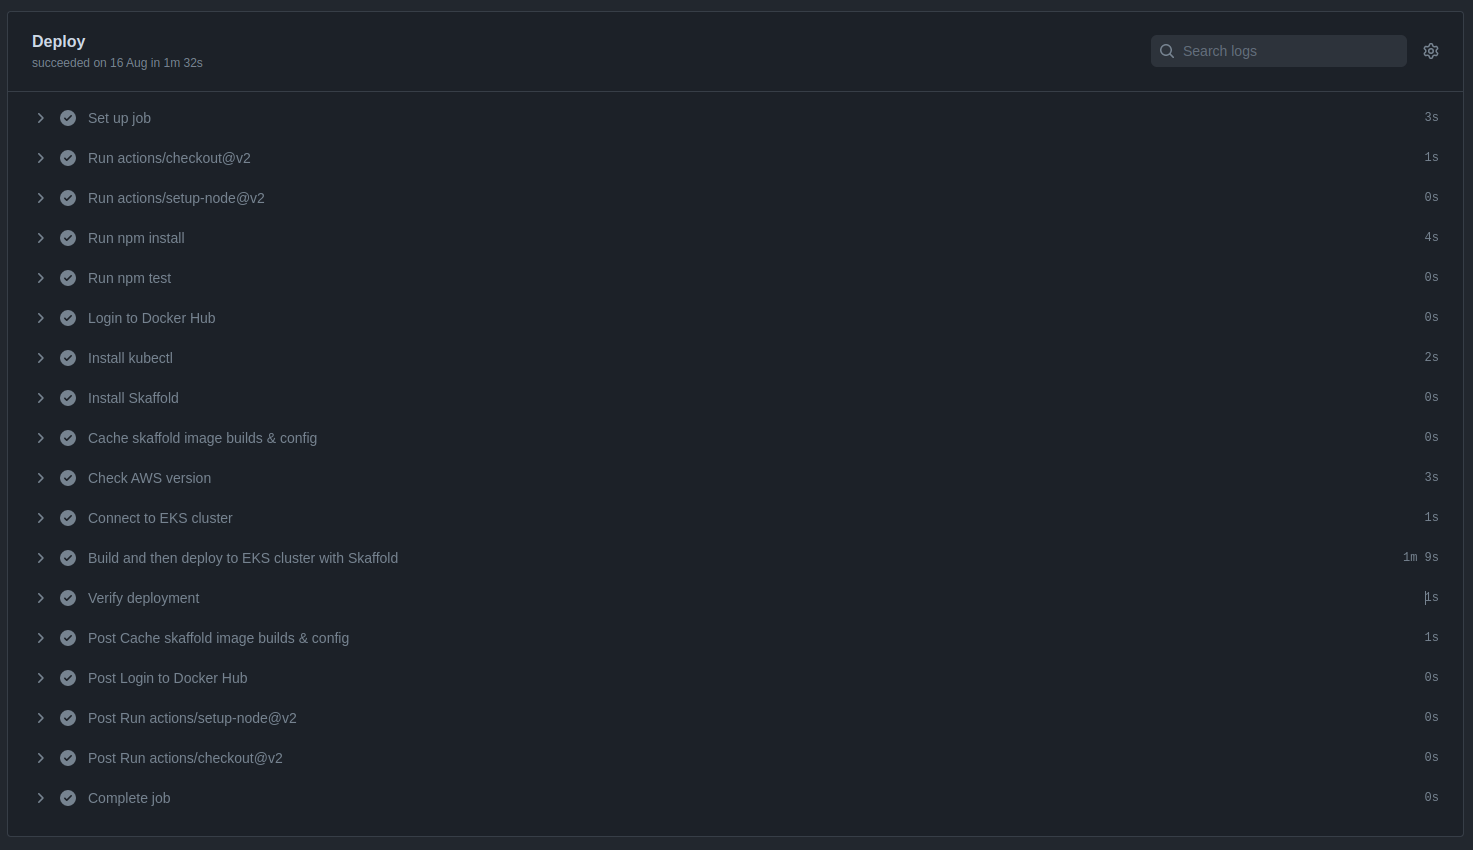
After creating all the files in the project, be sure to committee them to source code repository in GitHub. Because, GitHub Actions will detect the push to the main branch and trigger a pipeline following the configurations of the main.yml file.
As shown in the screenshot, the pipeline passed successfully in each phase, and the application was deployed to Amazon EKS.
Successful pipeline build and deployment

Deployment verification in Amazon EKS cluster

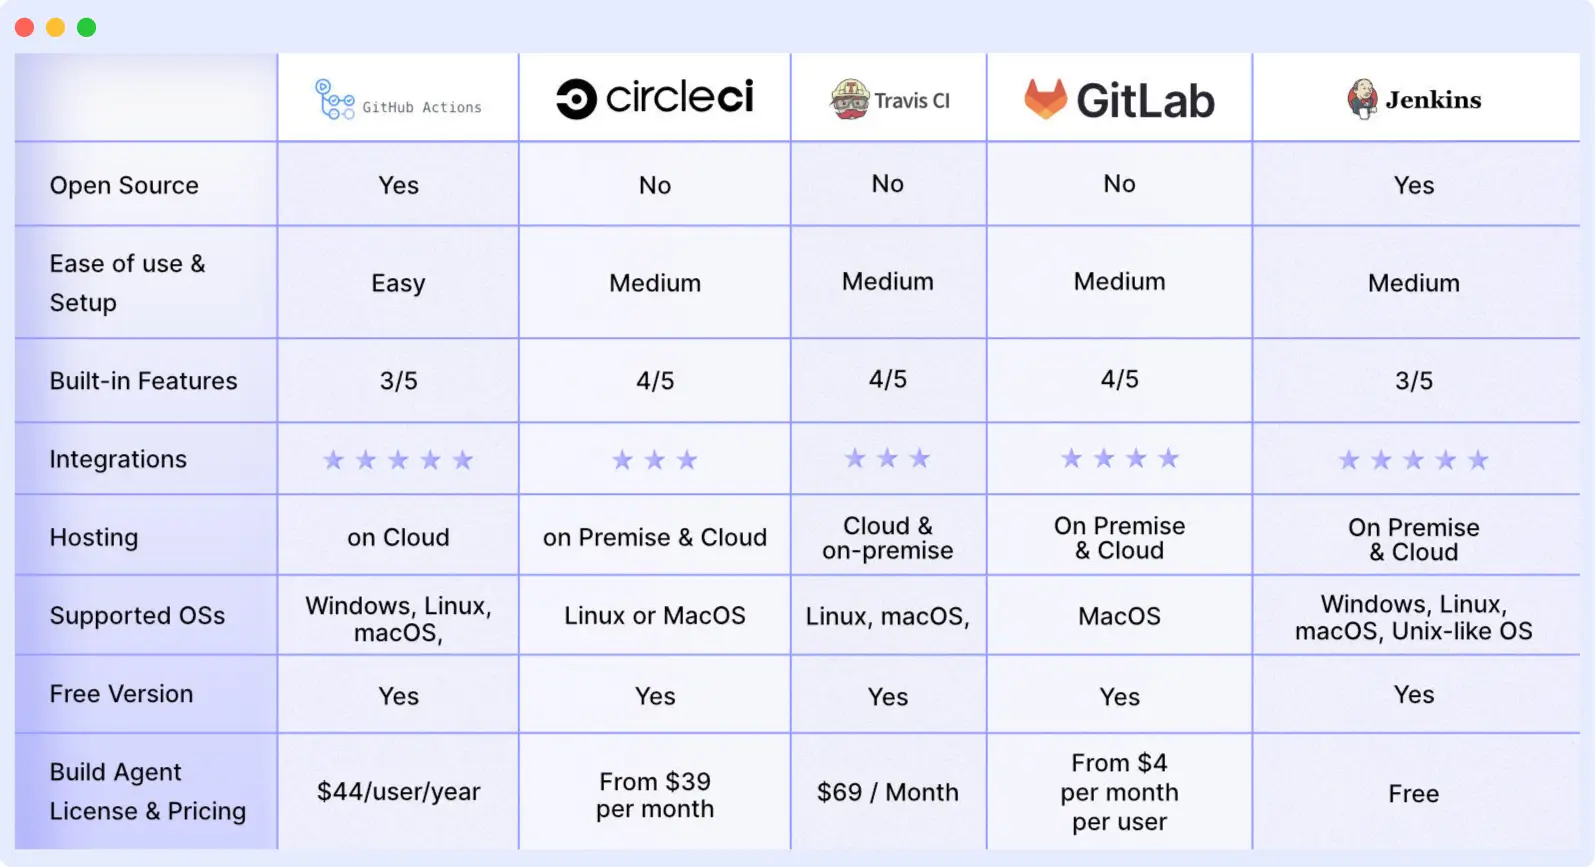
Popular CI/CD Tools & When to Use Them
Your team can automate development, deployment, and testing with the aid of CI/CD tools. Some tools specialize in continuous testing or related tasks, while some manage the development and deployment (CD) and others manage the integration (CI) side.
Below are some of the top CI/CD tools:

1. GitHub Actions
GitHub Actions is a great CI/CD platform that allows you to automate your build, test, and deployment pipeline. You can create custom workflows that build and test every pull request to your repository or deploy merged pull requests to production.
2. Circle CI
Circle CI is a cloud-based CI/CD platform that helps development teams release their code rapidly and automate the build, test, and deployment.
3. Travis CI
Travis CI is a hosted continuous integration tool that allows Development teams to test and deploy your projects with ease.
4. GitLab
Gitlab is an all-in-one DevOps platform that helps Devs automate their code’s builds, integration, and verification.
5. Jenkins
Jenkins is an open-source automation server that helps Development teams automate their build, testing, and deployment part of the software development lifecycle.
Security in CI/CD pipelines & DevSecOps
The way we deliver modern applications using CI/CD without incorporating security measures is equivalent to operating a vehicle that has no brakes. The basic principle of a solid DevSecOps methodology is to have every code commit, build, and deployment pass through an automated security gate. Below are several key practices, tools, and suggestions to make your CI/CD pipeline more secure from both vulnerabilities and supply chain threats.
Why CI/CD Security Matters
Many applications rely heavily on open-source libraries and third-party dependencies. A single vulnerable dependency can expose the entire system.
Vulnerabilities fixed early (during build or test) are far cheaper to remediate than issues discovered in production, often the difference between a quick patch and a costly incident or outage.
Automated pipelines ensure consistency: security checks are reproducible, no manual steps are skipped, and audit trails (logs) are maintained, which are essential for compliance and traceability.
Security Best Practices for Every Stage of CI/CD
CI/CD Security Workflow
An example of a modern-day secure continuous integration / continuous deployment (CI/CD) pipeline:
- A developer pushes code → pre-commit or pull request triggers static application security testing, secret scanning, and dependency scanning.
- If checks pass → involve building code / building a container image → include an image/container scan and Software Composition Analysis (SCA).
- If the image is free of vulnerabilities → push to registry (signed), run Infrastructure as Code (IaC) scan.
- Build & artefact are stored securely with all meta data and a Software Bill of Materials (SBOM) for future traceability.
- Deploy to staging/production environments, with Role-Based Access (RBAC), Network isolation, and least privilege configurations.
- After deployment: Monitoring, Anomaly detection, Logging, and defined Rollback strategies in case of failure.
This way of doing things “Security as code + Automation + Monitoring”, called DevSecOps, integrates security into every part of the pipeline process instead of being treated as an add-on after the fact.
Key Benefits of Embedding Security in CI/CD
- Catch vulnerabilities early — before they reach production: static analysis, dependency & container scanning “shift left” security, making fixes easier and cheaper.
- Reduce attack surface and supply-chain risk: scanning dependencies and container images ensures known vulnerabilities don’t travel to production or external registries.
- Ensure consistent security across teams and environments: automation enforces the same policies for every build, reducing human error.
- Simplify compliance & audits: SBOMs, signed artifacts, audit logs and automated gates provide traceability and evidence for regulatory requirements.
- Faster release cycles without sacrificing safety: automated security checks add little overhead but drastically reduce risk, letting teams maintain speed and safety together.
Start Scaling your CI/CD Pipeline with Middleware
CI/CD pipeline helps you automate the build, test and deployment part of the software development lifecycle. Integrating Infrastructure monitoring tools like Middleware can help you scale up the process.
Similarly, leveraging log management tools can help your Dev & Ops team increase productivity while saving time required for debugging applications.
Now that you know how Middleware can help you accelerate your CI/CD pipeline. Sign up on our platform to see it in action!
What is the difference between CI and CD?
CI automates code integration and testing, while CD automates delivery or deployment to staging/production environments.
Why is a CI/CD pipeline important for DevOps?
It ensures faster, reliable software delivery by automating testing, building, and deployment, reducing errors and improving collaboration.
How do CI/CD pipelines speed up software delivery?
By automating tests and deployments, pipelines shorten feedback loops, reduce bottlenecks, and allow frequent, faster releases.
Do I need CI/CD for small projects or startups?
Yes, even for small projects, CI/CD brings benefits like early bug detection, efficient testing, consistent builds, and faster delivery; many CI/CD tools offer free tiers suitable for small teams.
Which CI/CD tools are best for containerized cloud-native apps?
Tools like GitHub Actions, GitLab CI/CD, CircleCI, and cloud-native offerings (AWS CodePipeline, etc.) support container builds and deployments, making them well-suited for cloud-native applications.
Ship code faster with Middleware’s unified devops monitoring → Try it free (no credit card required)


