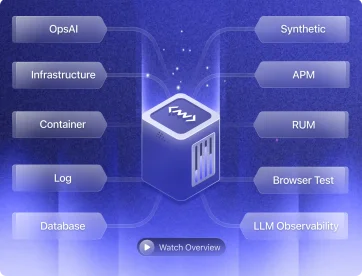
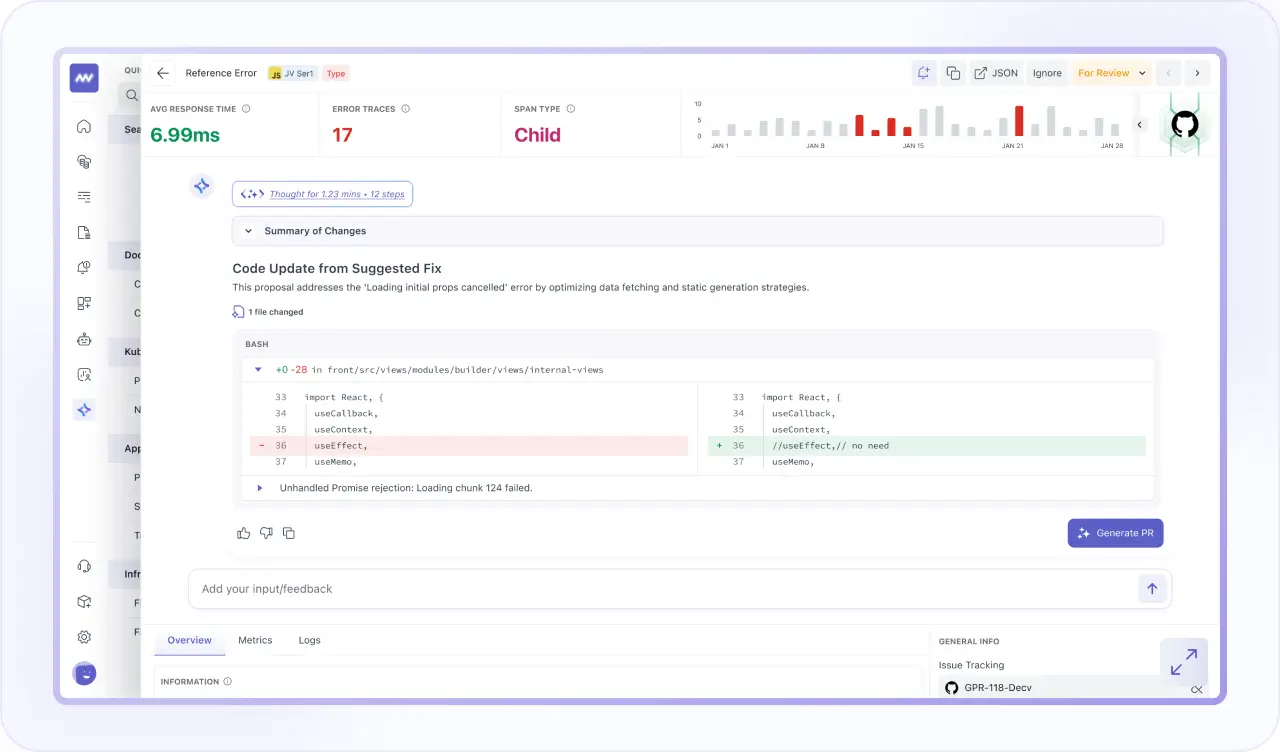
OpsAI
- Continuously monitor applications, infrastructure, databases, containers, logs, RUM, synthetics, & LLMs to detect anomalies in real time.
- OpsAI automatically correlates signals across your stack, pinpoints root causes, and provides actionable insights with suggested fixes.
- Surface high-priority incidents, reduce MTTR, and execute automated remediation to fix critical issues before users are affected.
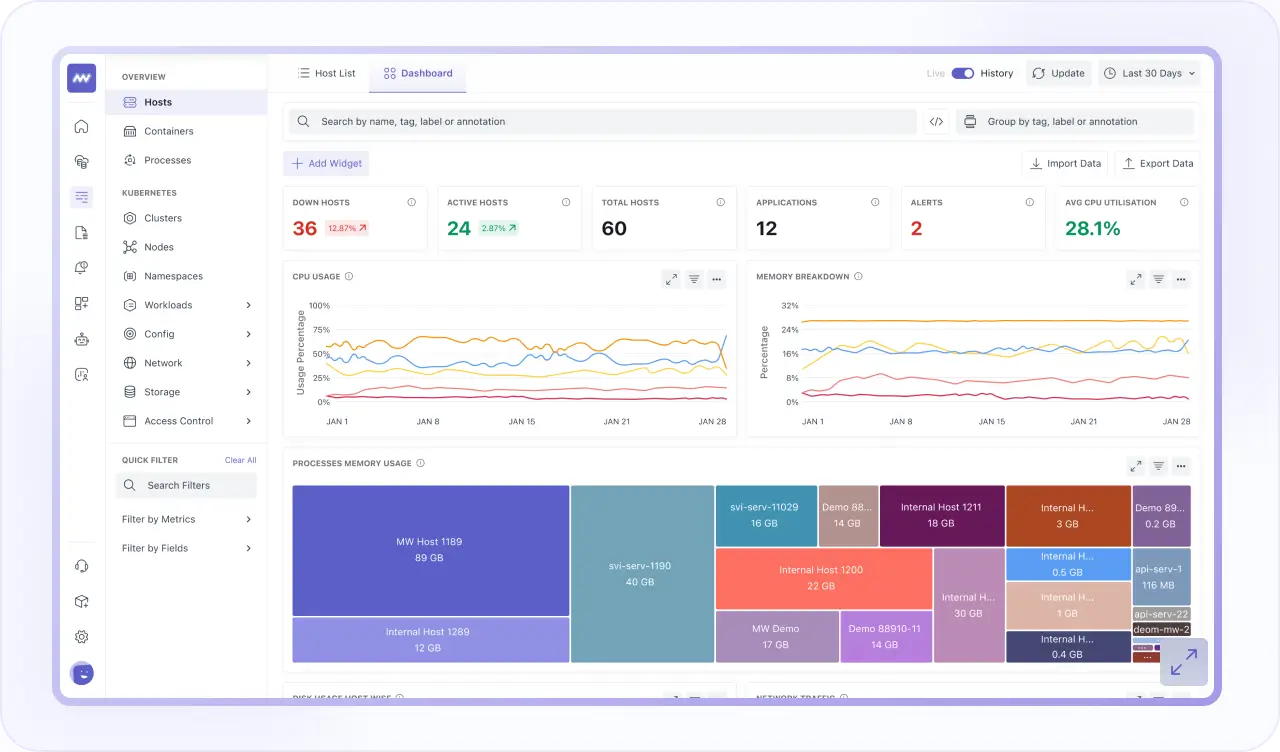
Infrastructure Monitoring
- Deploy observability instantly with auto-instrumentation across infrastructure, applications, databases, Kubernetes, and Linux.
- Manage network policies visually and monitor CRDs with ECS-level granular insights.
- Visualize infrastructure health in real time and instantly correlate spikes with application impact.
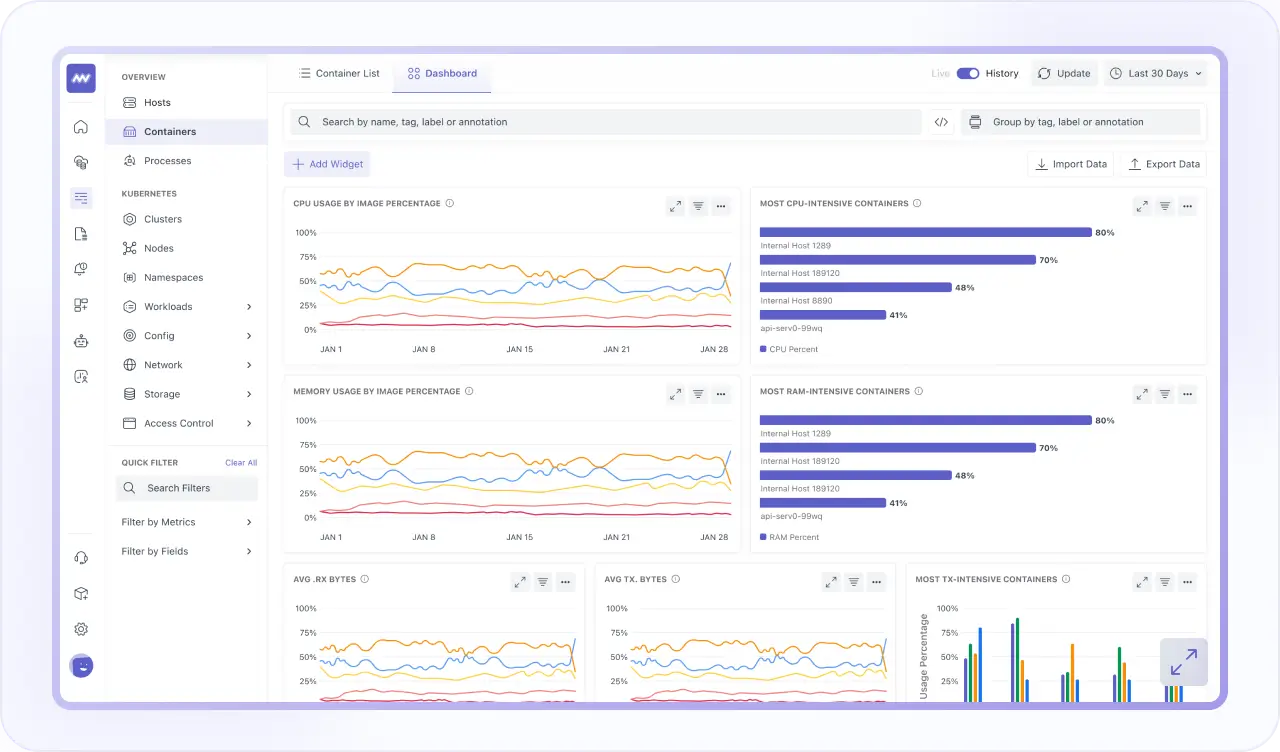
Container Monitoring
- Monitor Kubernetes, Docker, and cloud environments with deep cluster-level visibility.
- Correlate container metrics, logs, traces, and infrastructure to see real-time impact.
- Detect bottlenecks early and optimize orchestration with unified cluster health dashboards.
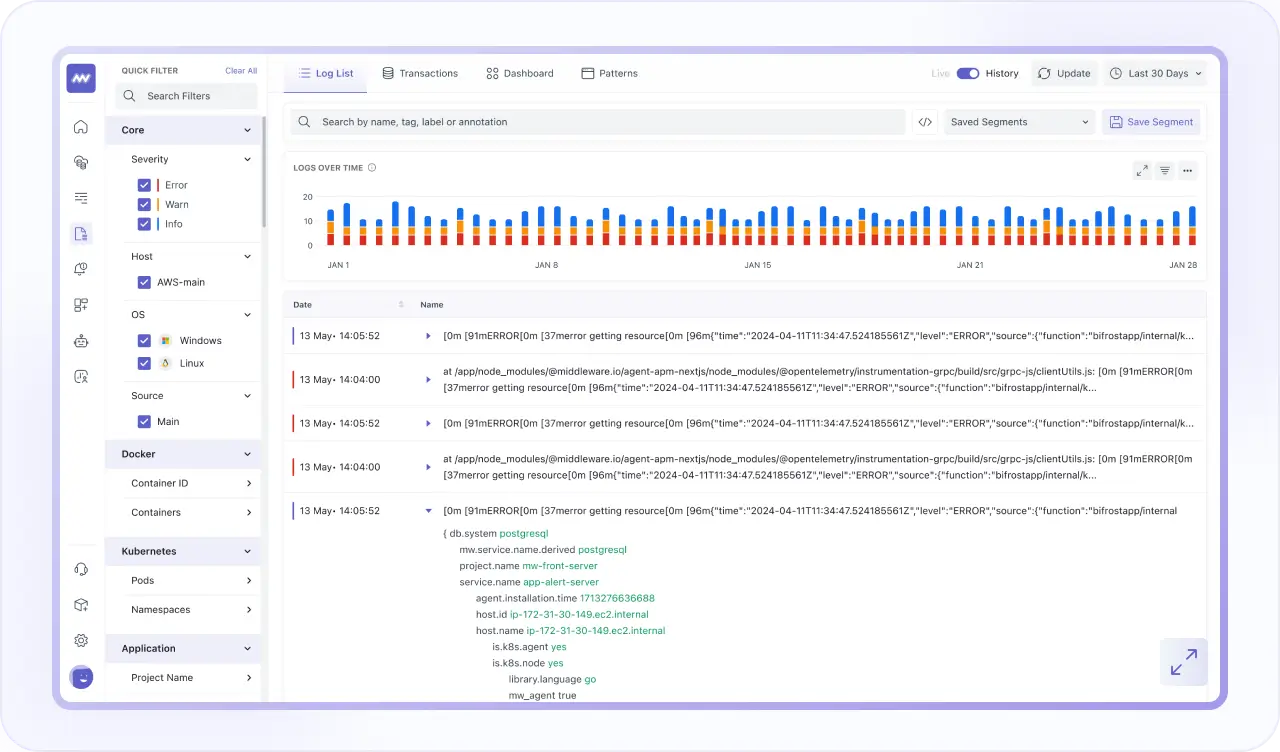
Log Monitoring
- Correlate logs, traces, and metrics for seamless, one-click troubleshooting.
- Search, filter, and analyze high-volume logs across your entire stack in real time to detect errors & anomalies.
- Use AI-powered QueryGenie to translate natural language into precise log queries without learning complex query languages.
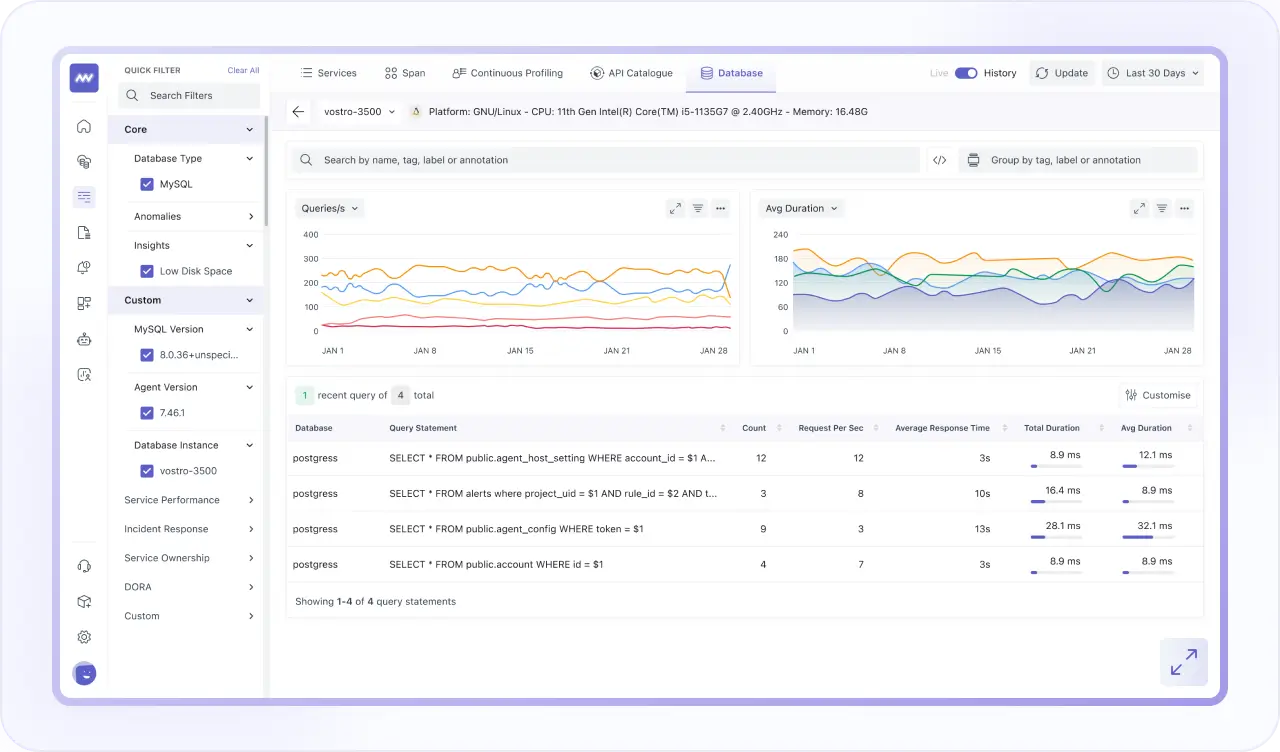
Database Monitoring
- Analyze every query to detect slow executions, resource-heavy patterns, and instantly identify database bottlenecks.
- Monitor MySQL, PostgreSQL, MongoDB, Cassandra, and Aurora from one unified performance dashboard.
- Track CPU, memory, disk, and query throughput with alerts to prevent downtime and optimize scaling.
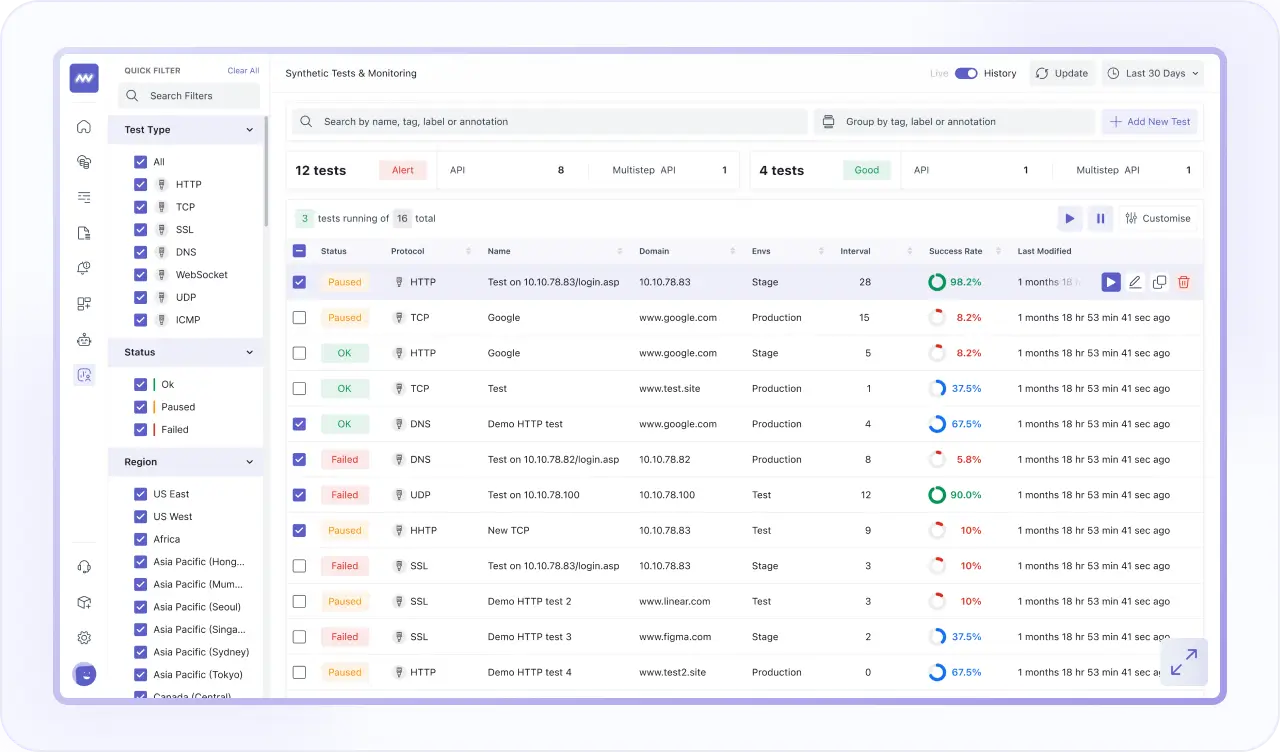
Synthetic Monitoring
- Test APIs and browser journeys globally to proactively detect availability, latency, and performance issues.
- Validate HTTP, UDP, DNS, and WebSocket APIs with complete request and response visibility.
- Run automated browser tests, simulate user workflows, and prevent incidents before customers are impacted.
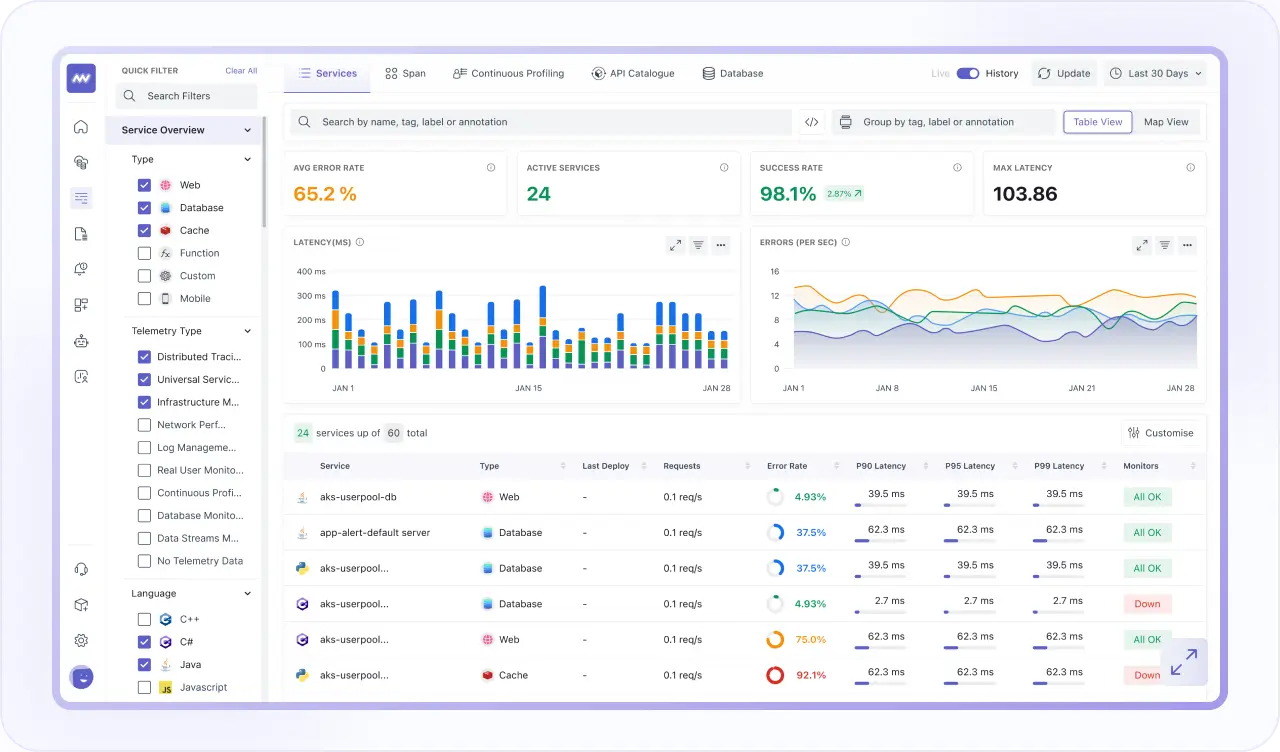
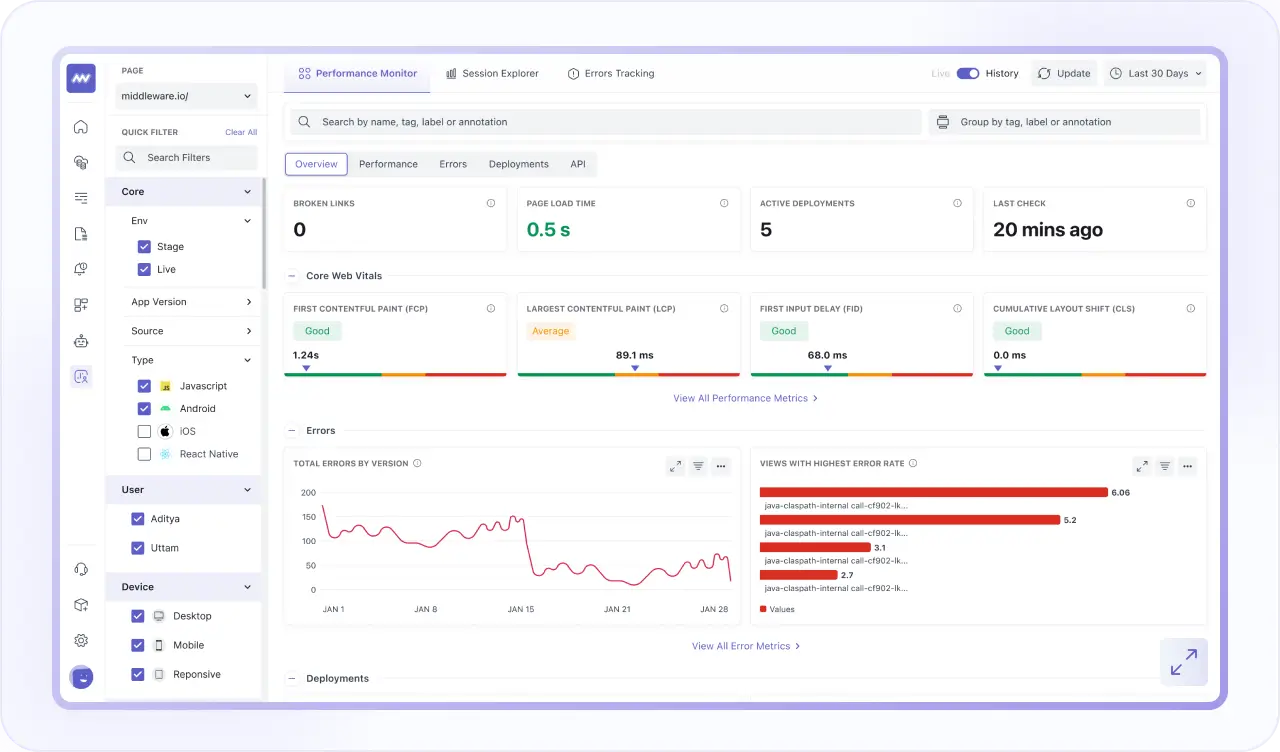
Application Performance Monitoring
- Track real-time spans, identify latency bottlenecks, and correlate traces across APIs and databases.
- Use continuous profiling and live monitoring to resolve backend performance issues proactively.
- Visualize architecture health, dependencies, and traffic to protect uptime and application speed.
Real User Monitoring
- Gain deep visibility into real user experiences across web & mobile applications to detect performance issues early.
- Replay complete user sessions with correlated backend traces for end-to-end troubleshooting.
- Protect sensitive user data with privacy controls that anonymize and capture only what's needed.
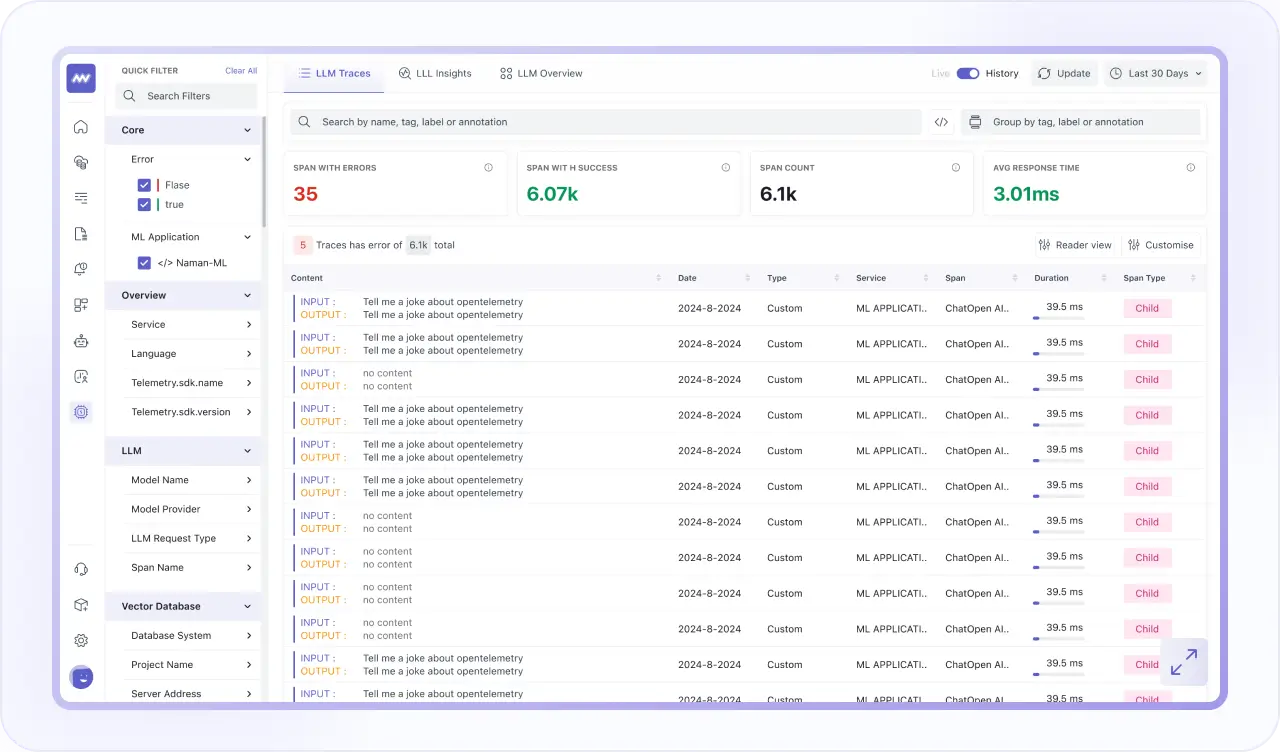
LLM Observability
- Gain full visibility into your LLM-powered applications, prompts, and AI workflows in real time.
- Track latency, token usage, costs, response quality, and model performance across providers.
- Correlate LLM interactions with backend traces, infrastructure metrics, and user sessions to measure AI’s real production impact.
