December brings major upgrades across AWS ECS observability, Kubernetes visibility, APM service mapping, log analytics, AI-powered dashboards, and RUM—along with deep improvements to cloud integrations and overall platform usability.
Here’s everything new this month 👇
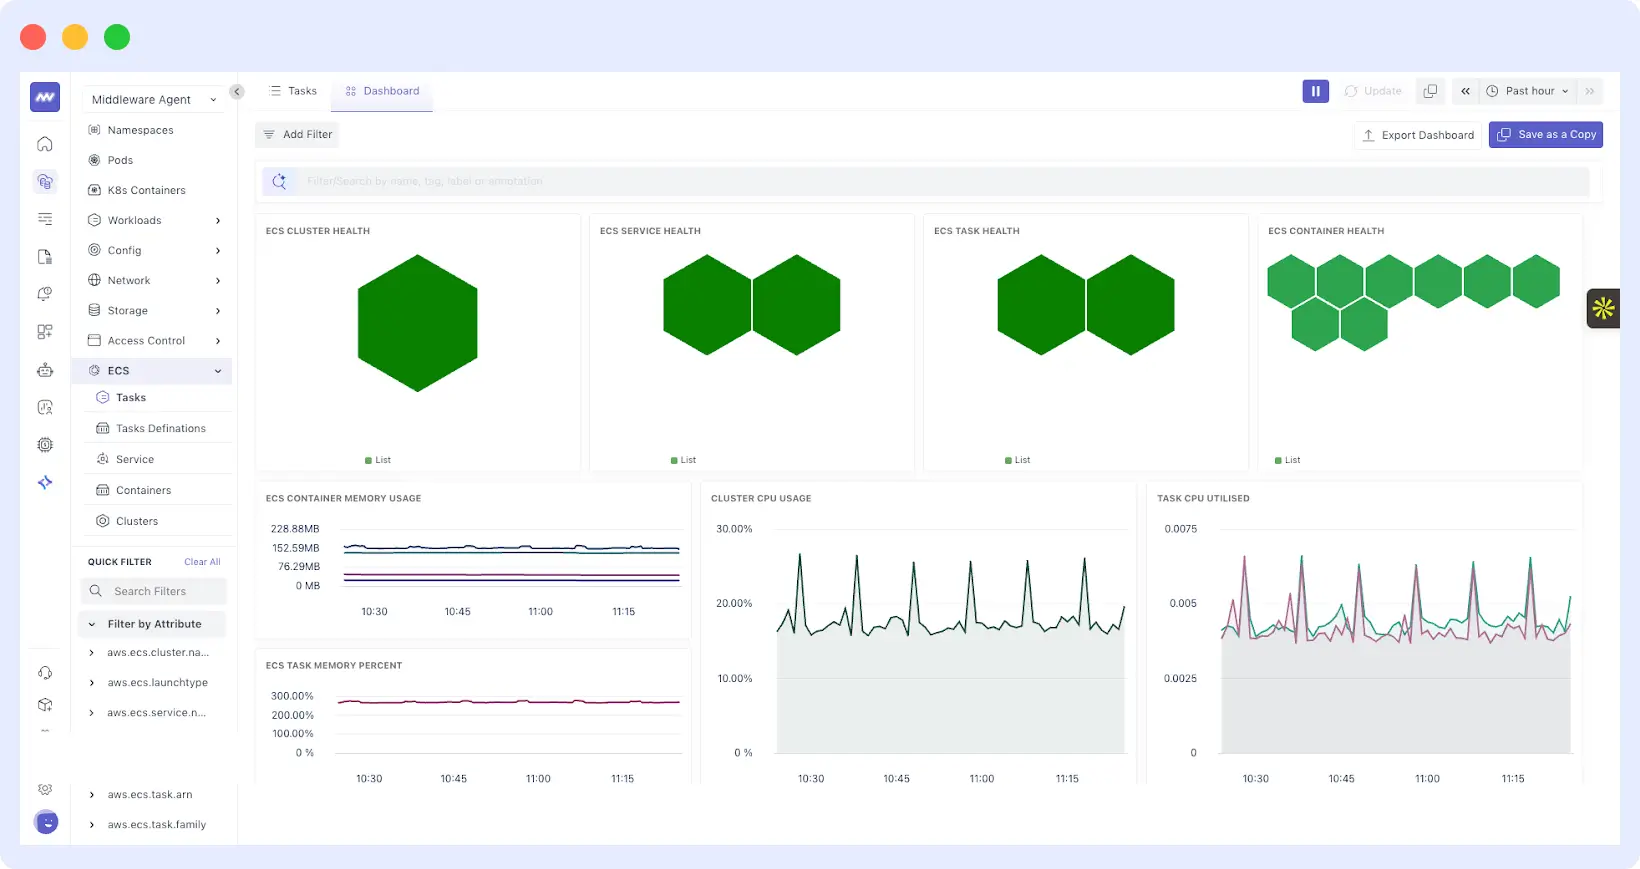
🧭 ECS Explorer – Deep Visibility into AWS ECS
We’ve introduced a ECS Explorer to help you understand, debug, and optimize ECS workloads more effectively.
New ECS Screens
You can now explore ECS using 5 dedicated views:
- Tasks
- Task Definitions
- Services
- Containers
- Clusters
What you can do
- View default dashboards for ECS tasks, task definitions, and services.
- Drill into individual ECS tasks to see:
- Related logs
- Containers
- Services
- Resource usage
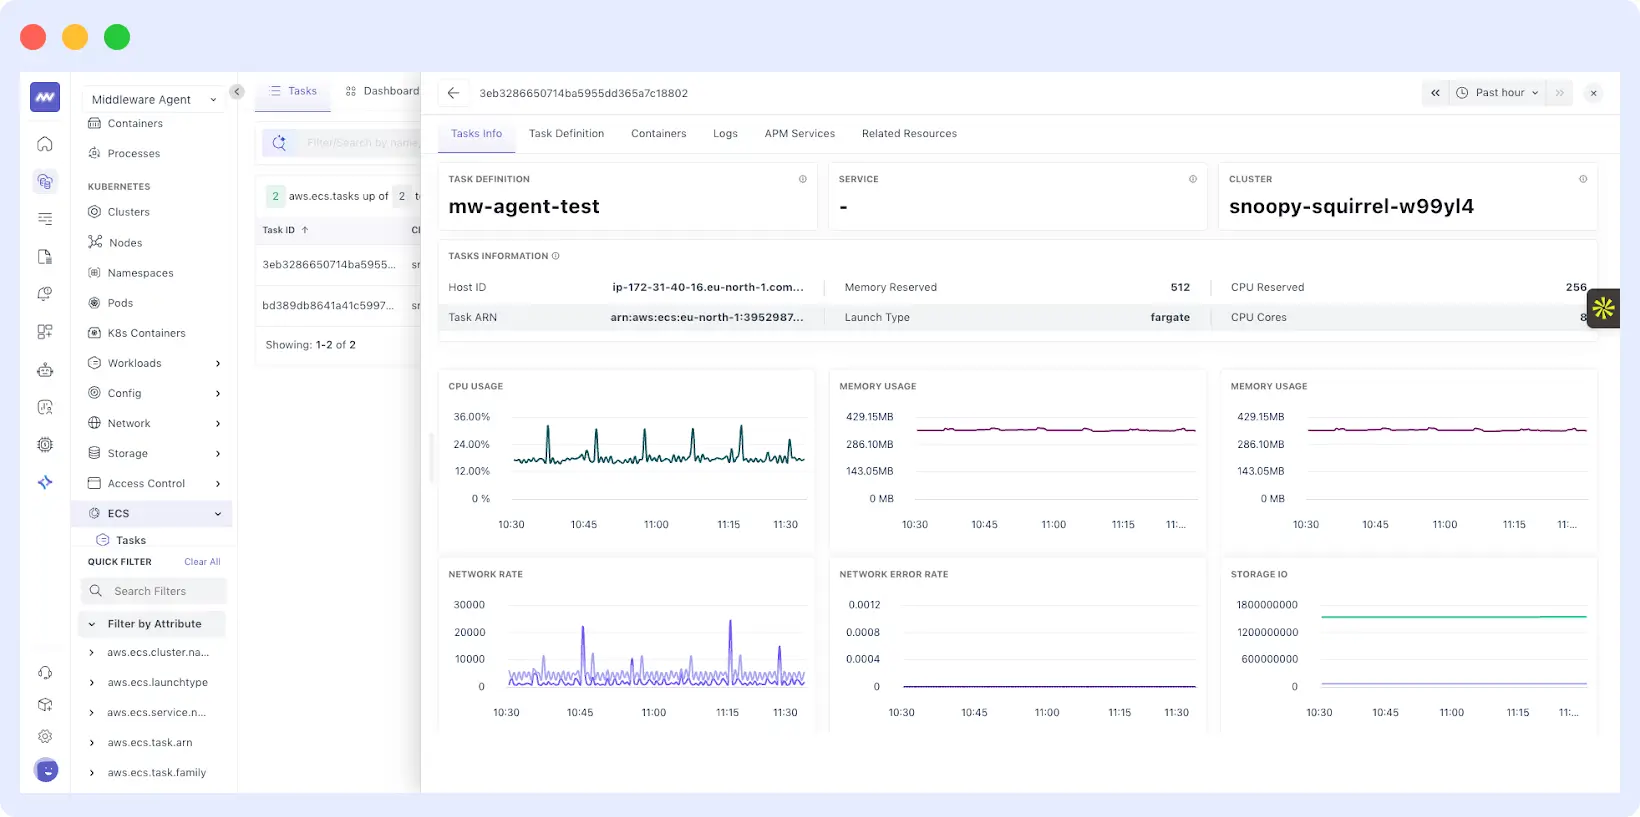
This makes ECS troubleshooting and performance analysis significantly faster and more intuitive.
🌐 Kubernetes Enhancements
Network Policy Explorer
- New screen to view network policies per cluster
- Drill into individual policies with full configuration details
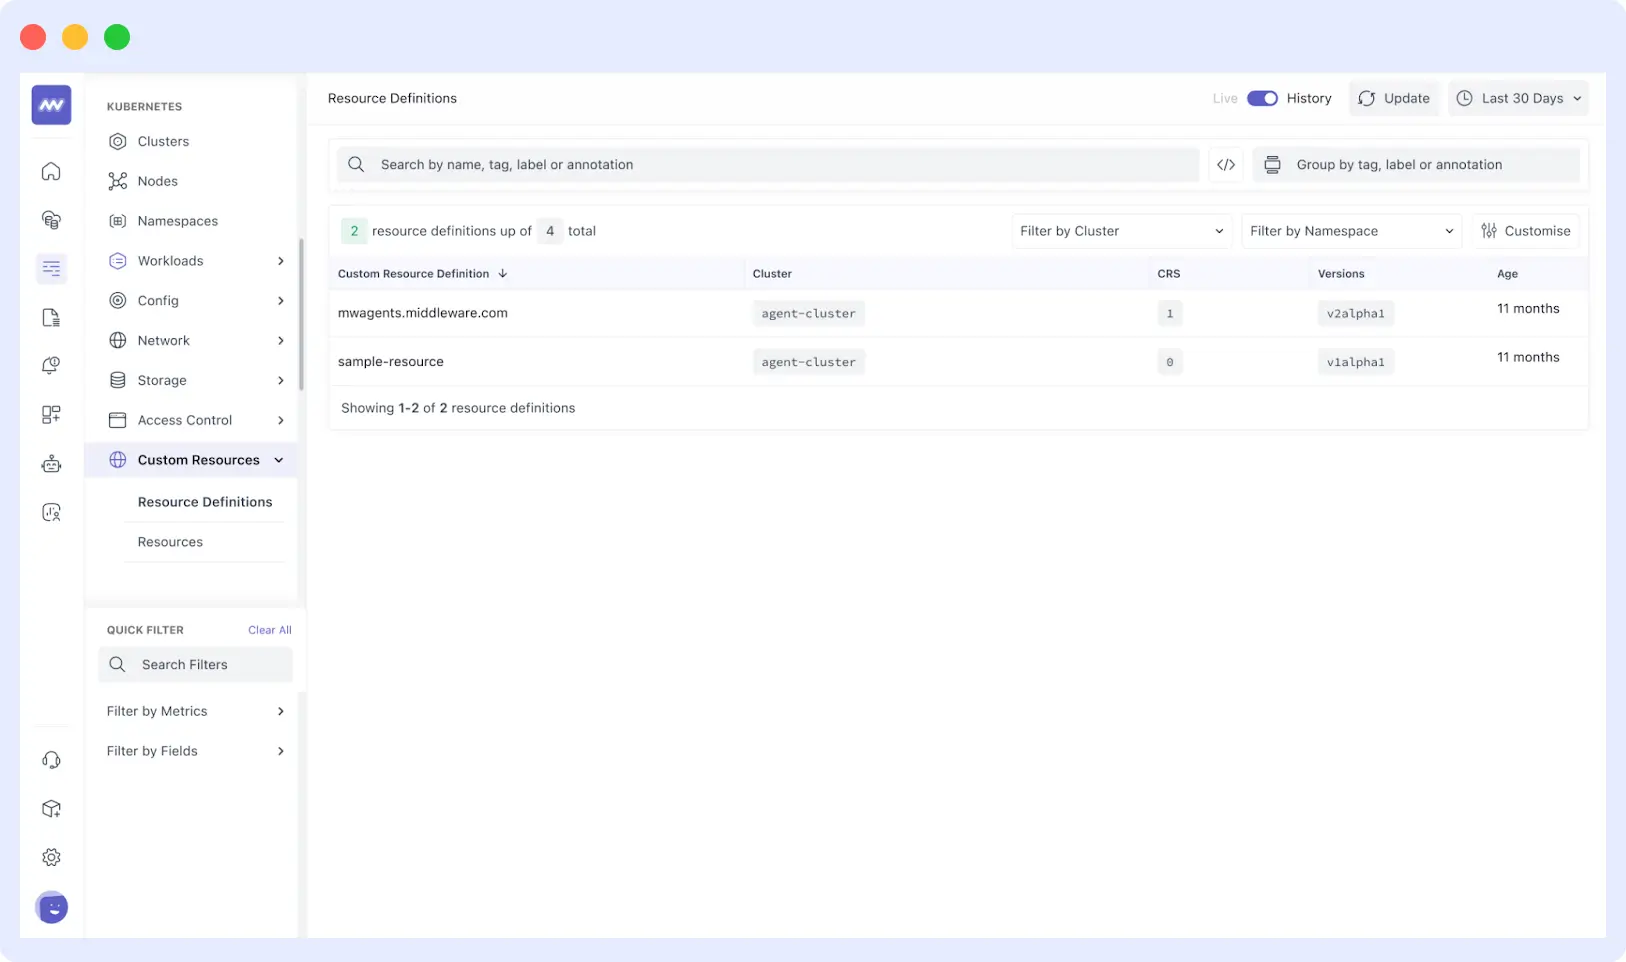
Custom Resources View
- New screen to visualize Kubernetes custom resources
- Includes version, age, and other metadata for easier cluster introspection
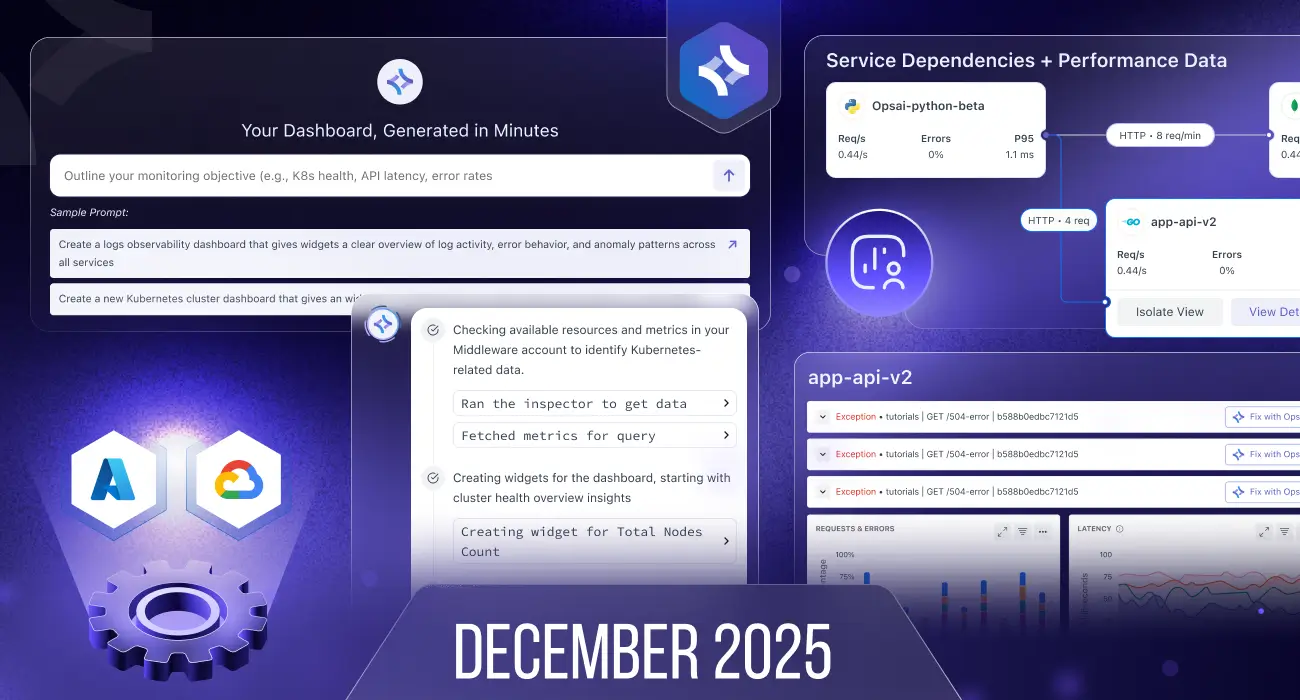
🗺 APM Service Map – Clearer Service Relationships
We’ve revamped the Service Map UI to improve clarity and performance analysis.
New capabilities
- Rich interaction view showing service dependencies + performance data
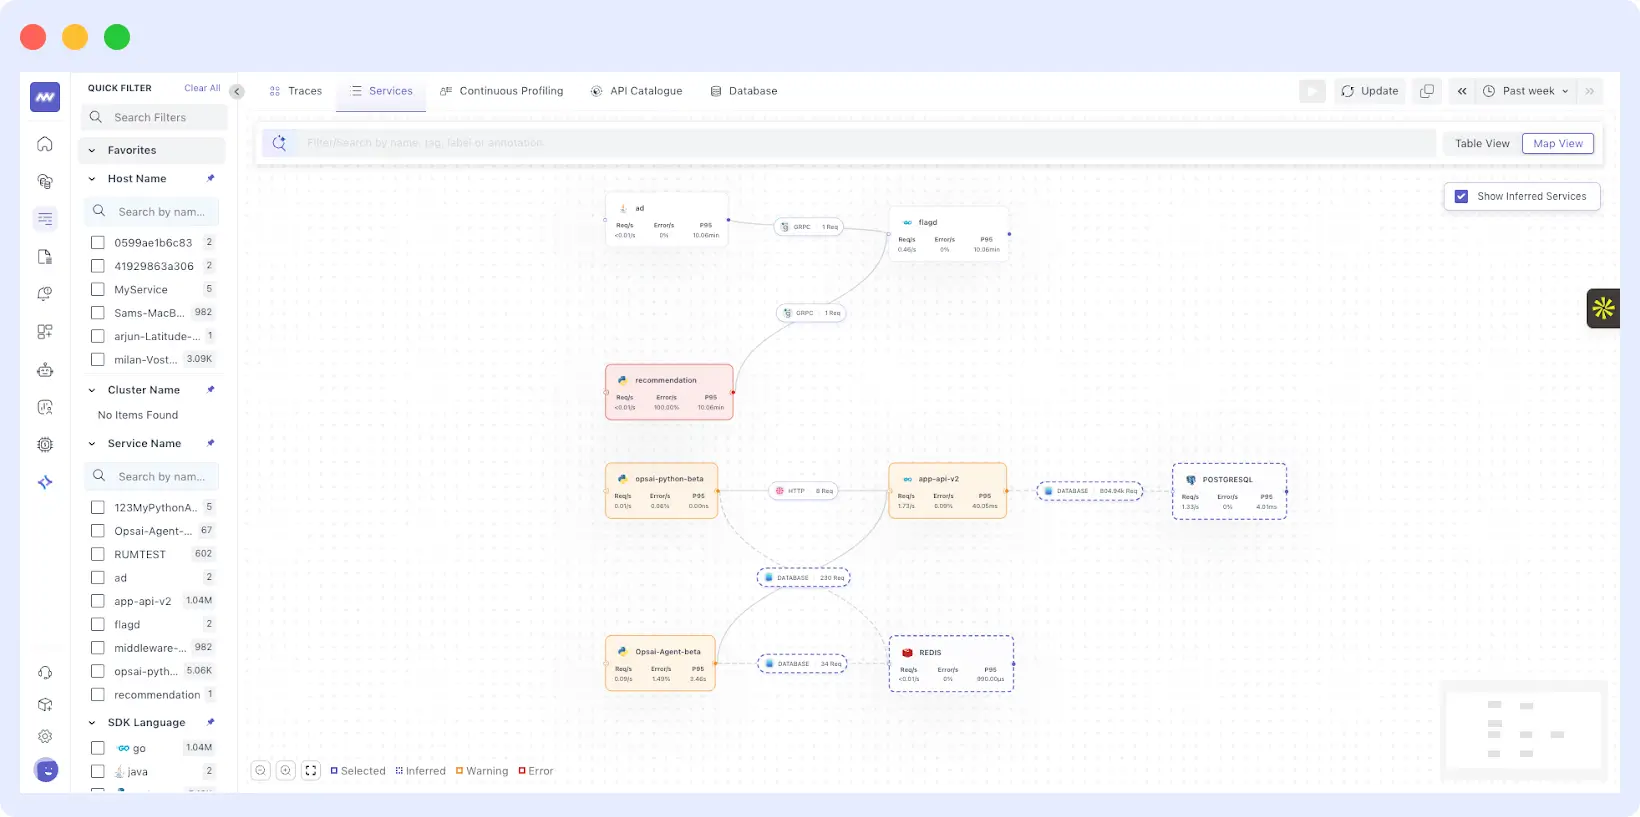
- Hover over any connection to highlight traffic flow
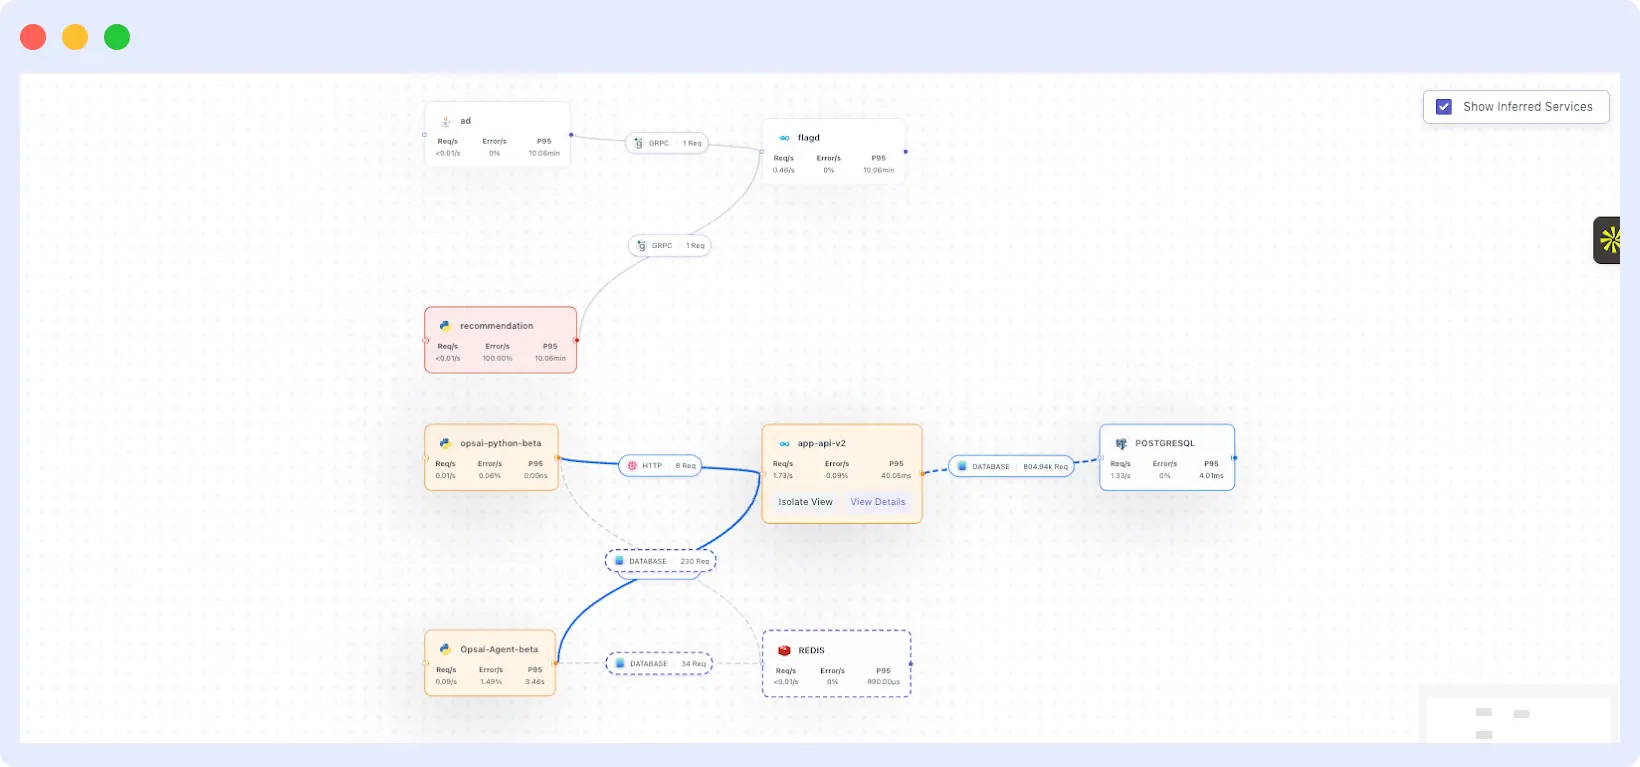
- Isolation view to focus on one service path (others blur automatically)
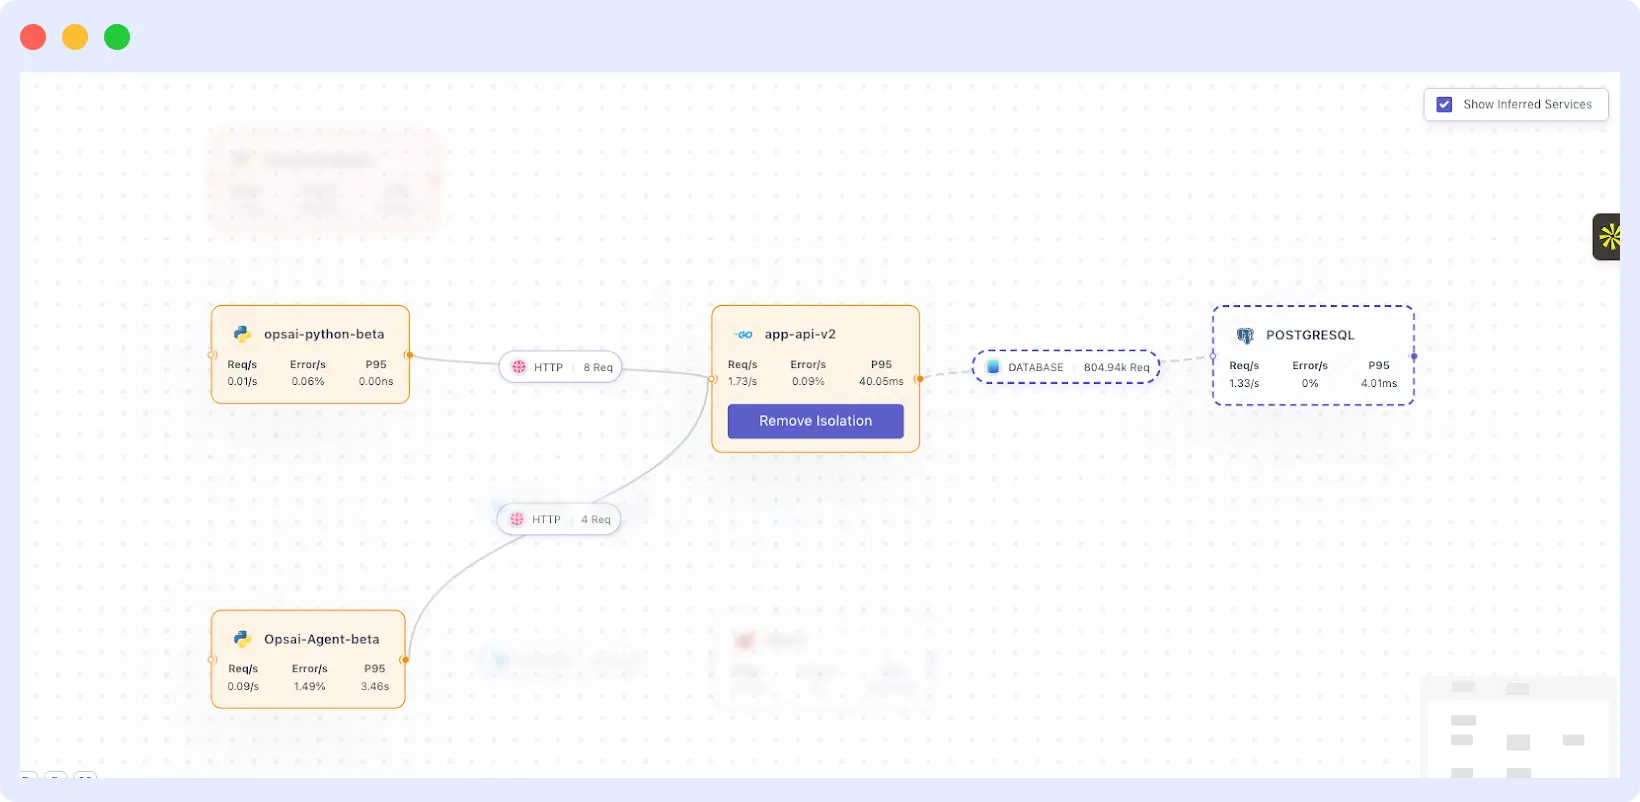
- Detailed service panel including:
- Error metrics
- Traces
- Request & error graphs
- Latency
- Logs
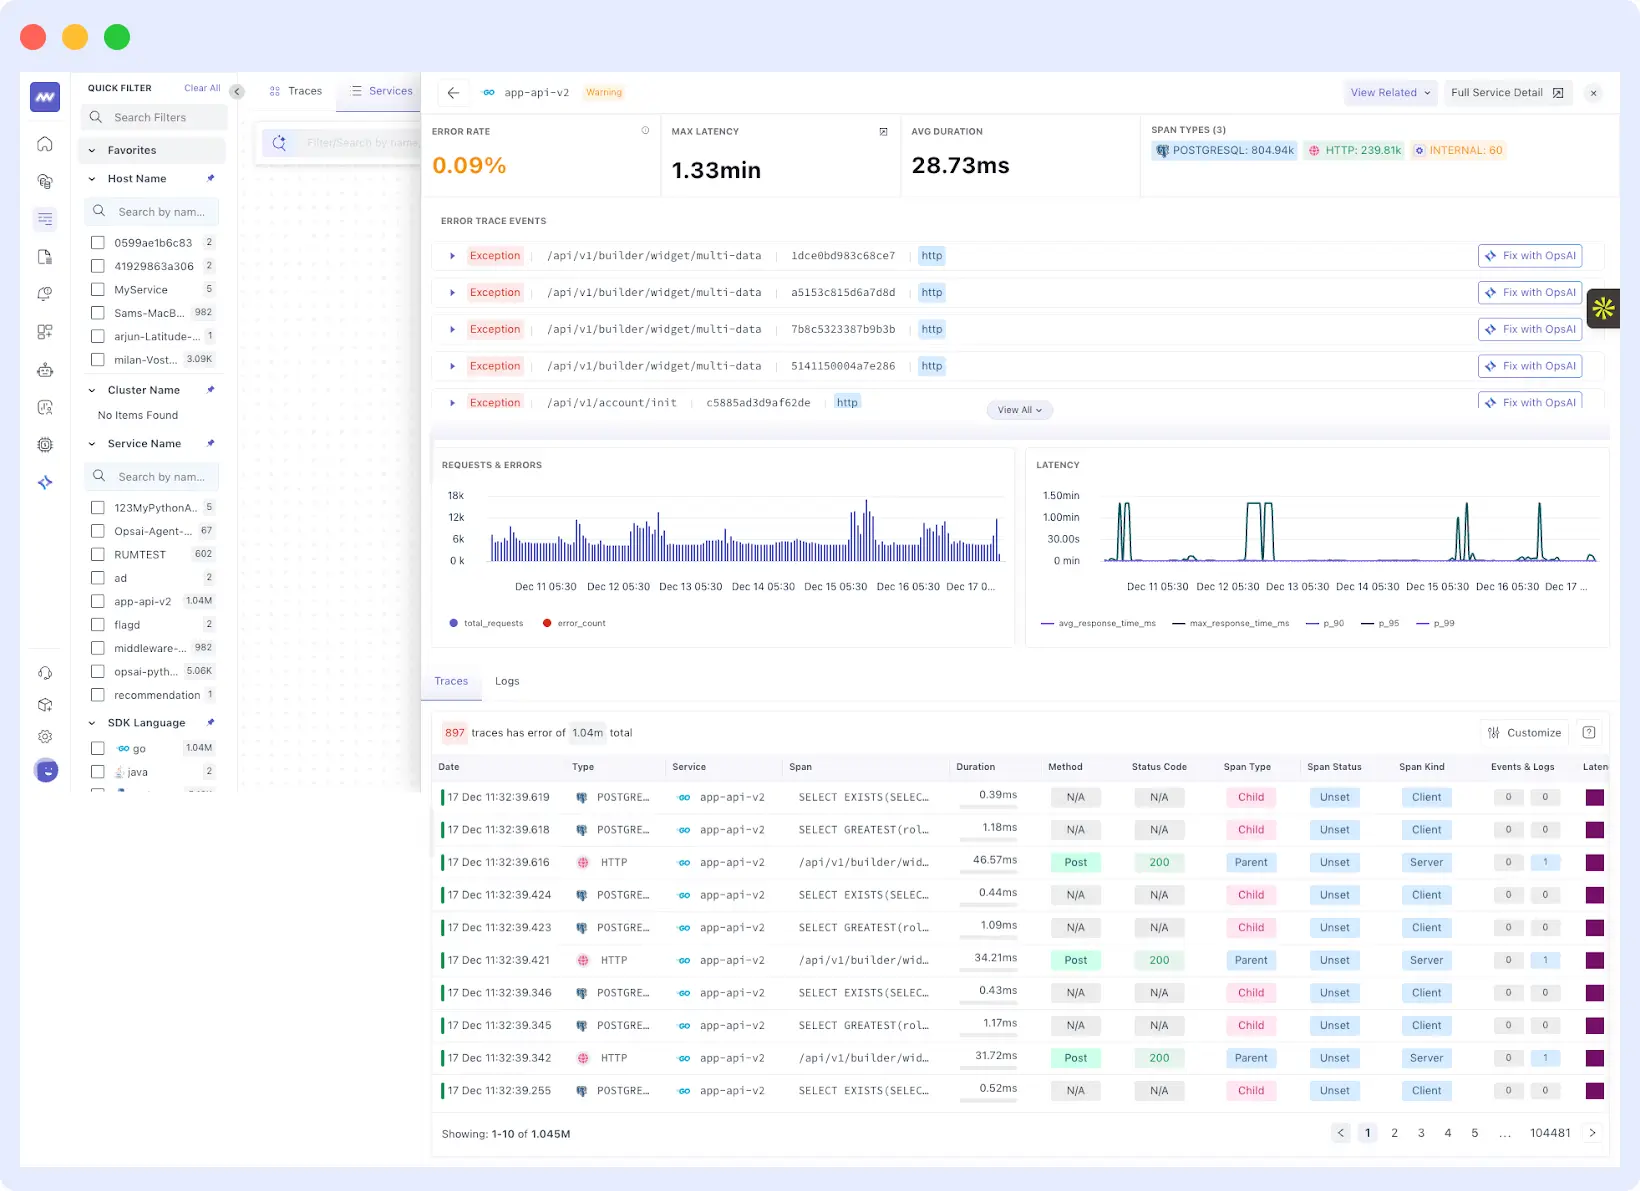
Perfect for understanding complex microservice architectures.
📜 Log Monitoring – Powerful Drilldowns & Visual Analysis
Enhanced Drilldown View
Logs are now sorted by key attributes automatically for faster investigation.
Attribute-Level Exploration
Click any attribute to view it as:
- Time series
- Bar chart
- Table
- Pie chart
- Raw JSON
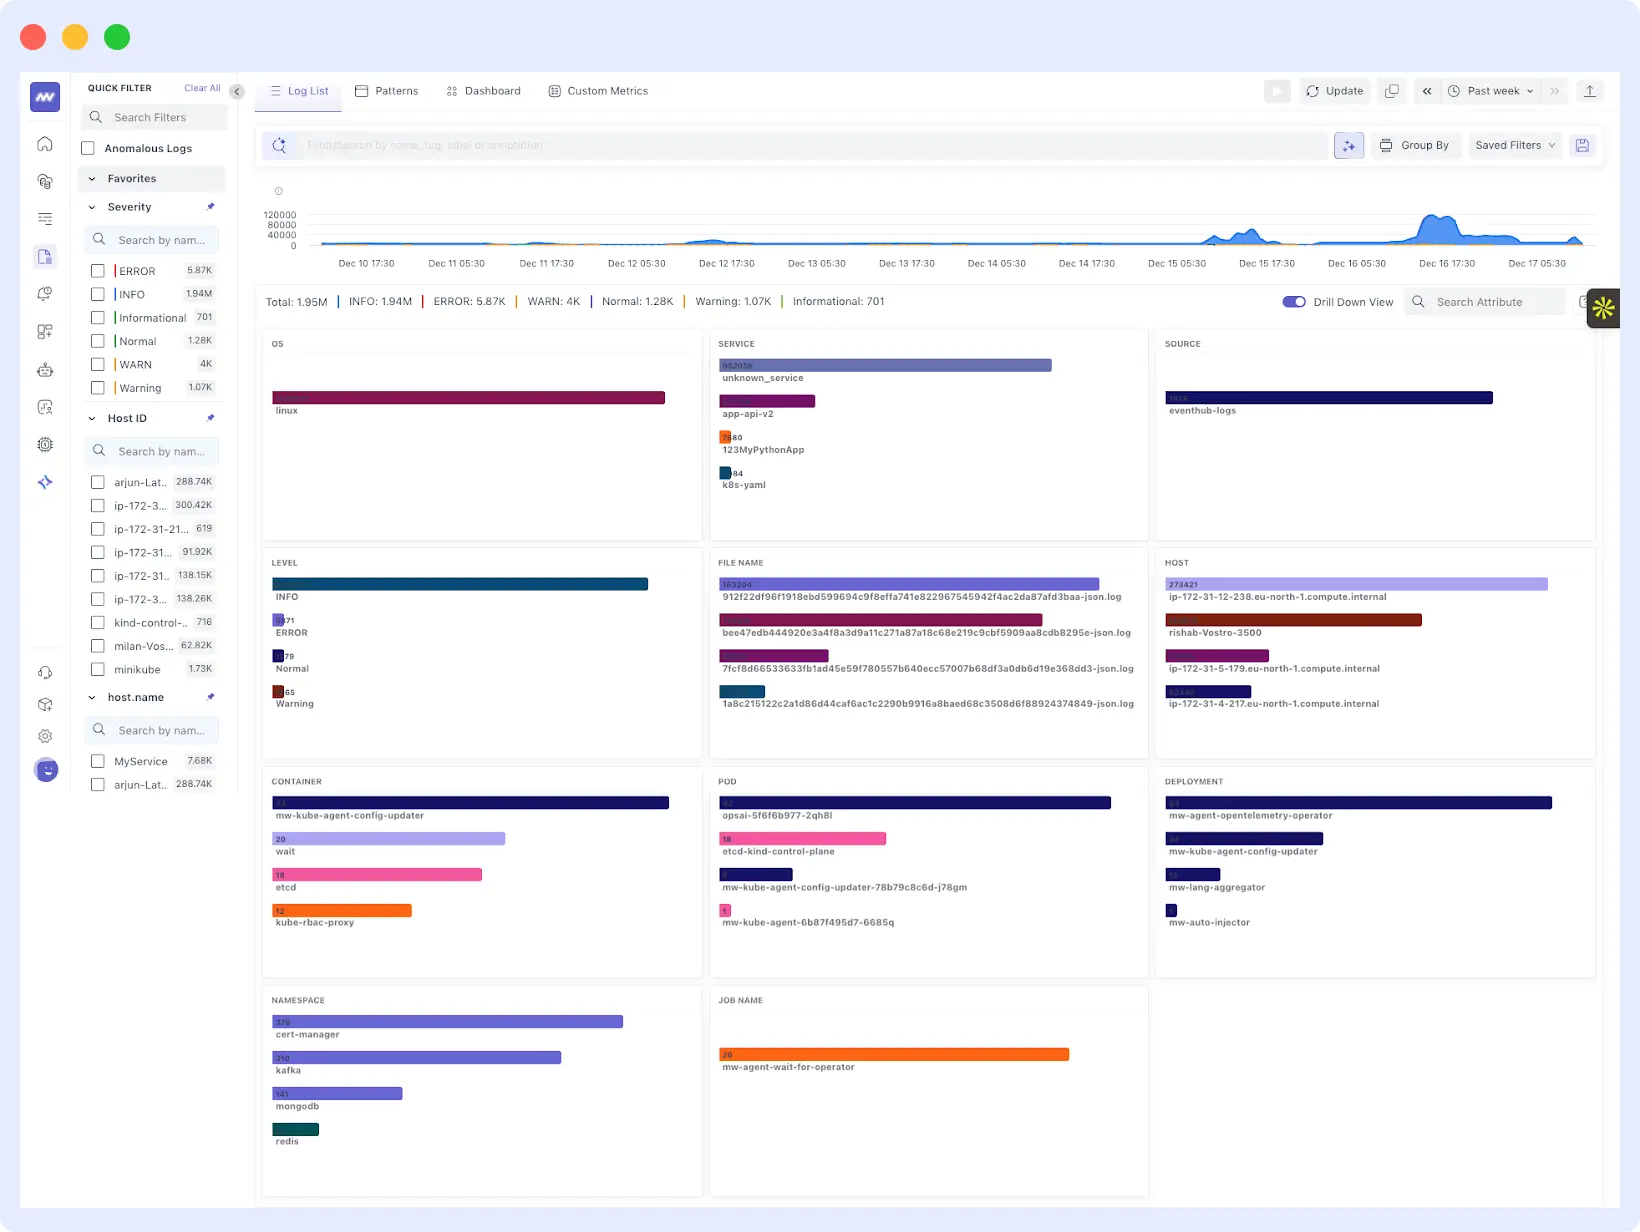
Updated Log Detail Layout
Log details are now grouped into:
- Parsed Attributes – extracted fields from the log body
- Log Properties – all structured fields
- RAW – full JSON view
This makes debugging structured logs significantly easier.
🤖 Build Dashboards with AI
You can now build dashboards using natural language.
How it works
- Describe your use case in chat (e.g., “Create a dashboard for API latency and error rate”)
- AI generates the dashboard automatically
- Modify or add widgets using chat commands
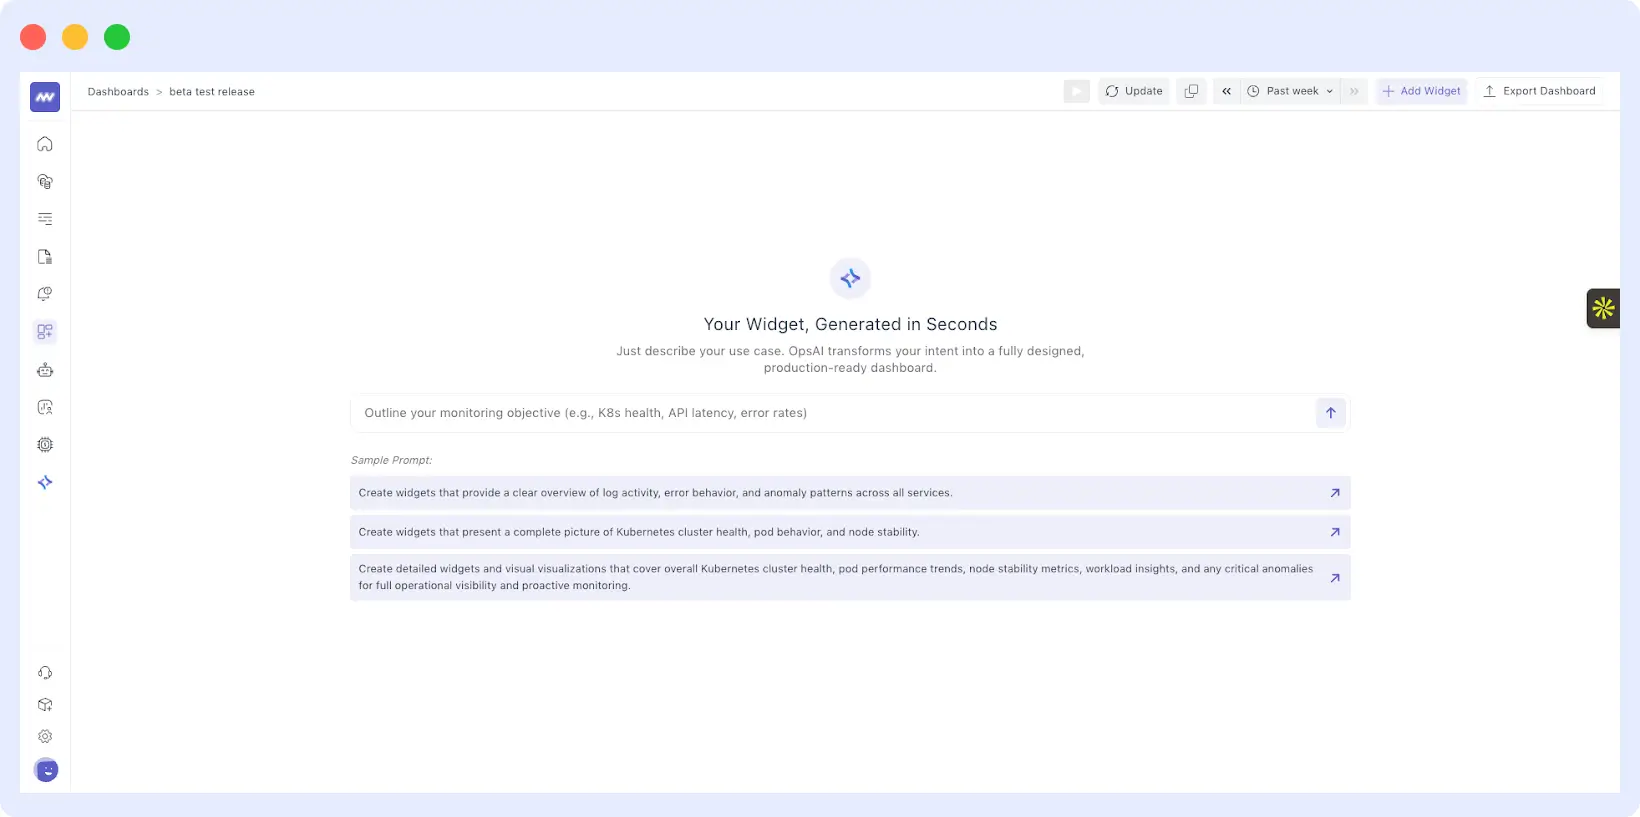
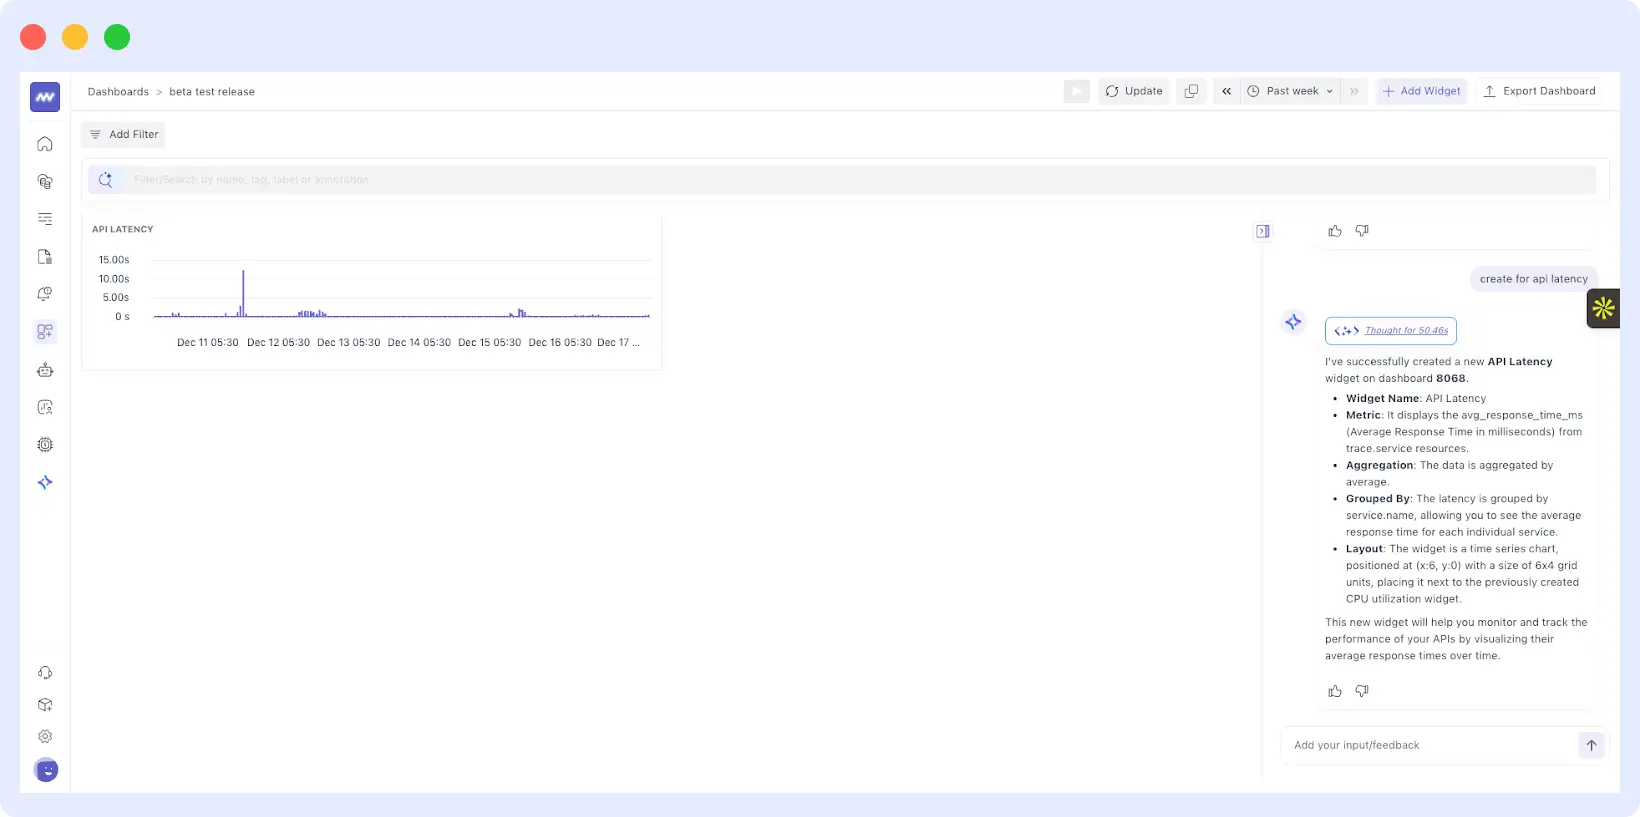
You can still create widgets manually via “Add Widget” anytime.
📱 RUM Updates
Flutter Support
RUM now supports Flutter applications for frontend monitoring.
Session Explorer as Default View
Session Explorer is now the first screen shown when opening application details in RUM.
🔌 Integration Improvements
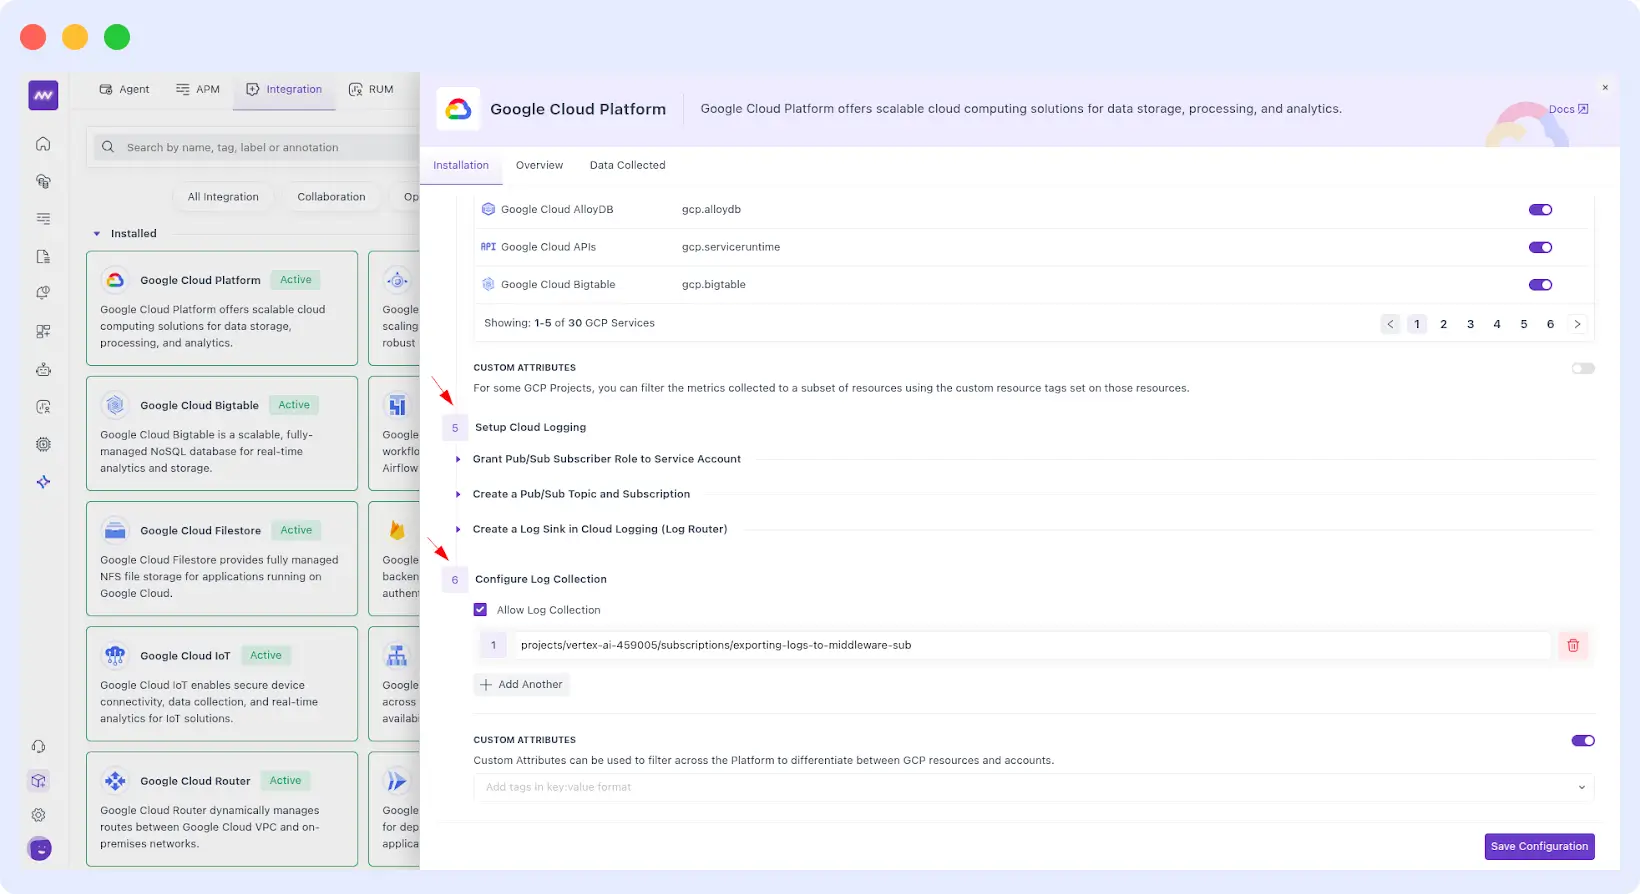
Google Cloud Platform
- Added Cloud Logging support via Pub/Sub
- Collect GCP logs directly through the integration pipeline
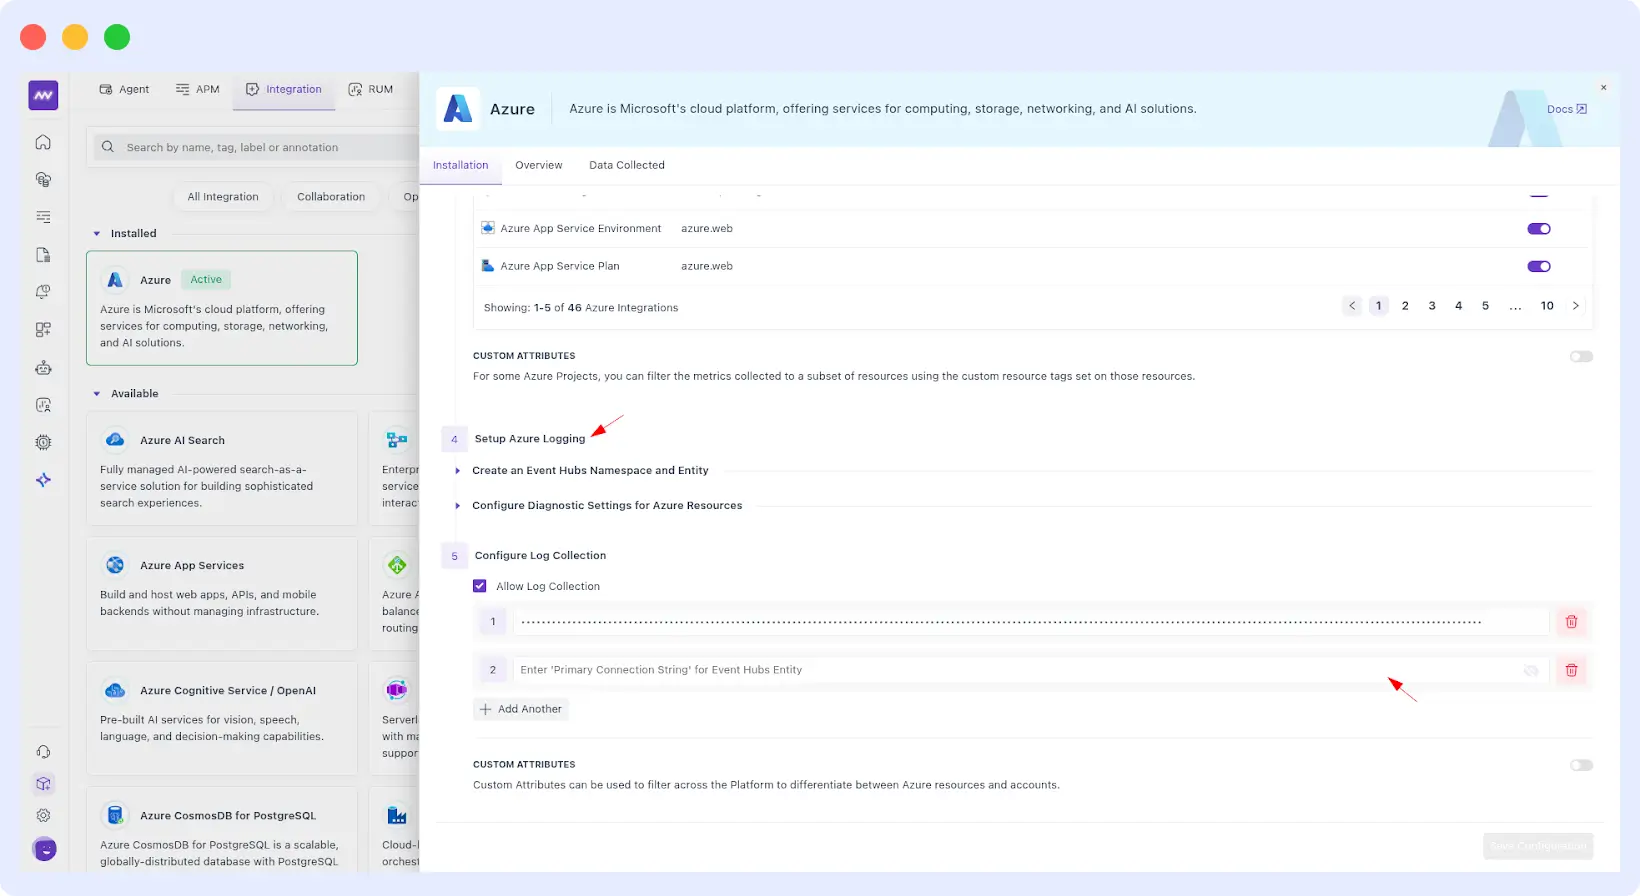
Azure
- Metrics support added for Azure App Services
- 90+ metrics supported (Microsoft.Web/sites)
- 90+ metrics supported (Microsoft.Web/sites)
- Logging via Event Hub flow is now supported. Refer this doc for more details.
Prometheus
Added UI form fields to configure scraping without restarting StatefulSets
⚙ Platform Improvements
Ops AI
- Fixed retry flow for GitHub PR generation
- Improved validation and error messaging in settings
RUM
Fixed session recording issues when users use Canvas
APM
Fixed trace waterfall loading issues for large datasets
Ingestion Control
- Reduced redundant API calls
- Fixed include/exclude namespace & deployment sync issues
Alerts
Fixed pagination in alert listing
Documentation
Added global search with keyword highlighting across all docs
Navigation
Left menu now expands with full labels on hover
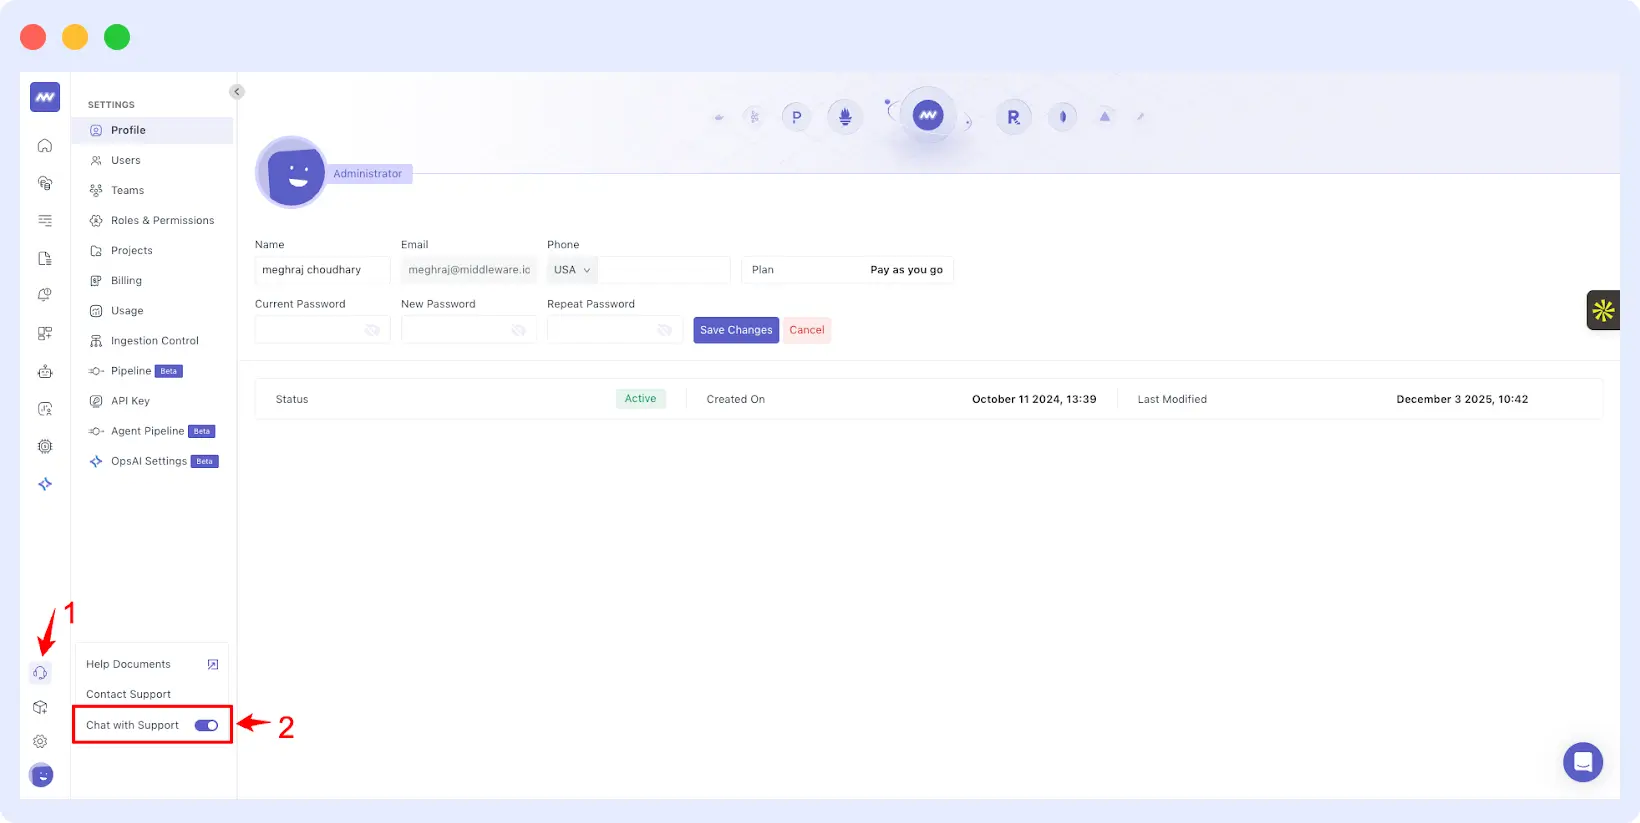
💬 Built-in Chatbot Support
- Users can now contact support via in-app and website chatbot
- Enabled by default
- Can be disabled from the left menu
🎨 UI / UX Enhancements
Integration UX upgrades
Improved setup flows for:
- Apache
- Nginx
- Redpanda
- RabbitMQ
- Kafka
- Custom data ingestion
Now includes clearer steps, prerequisites, and validation feedback.
Notification Integrations UI
Updated UX for:
- Slack
- Microsoft Teams
- PagerDuty
- Opsgenie
Now shows:
- Integrated channels
- Prerequisites
- Setup details
- Connection status