In February, we focused on improving user experience, performance insights, and cloud observability, while also introducing RUM Heatmaps for deeper frontend behavior analysis. Along with this, we made several improvements across APM, alerts, dashboards, and cloud integrations.
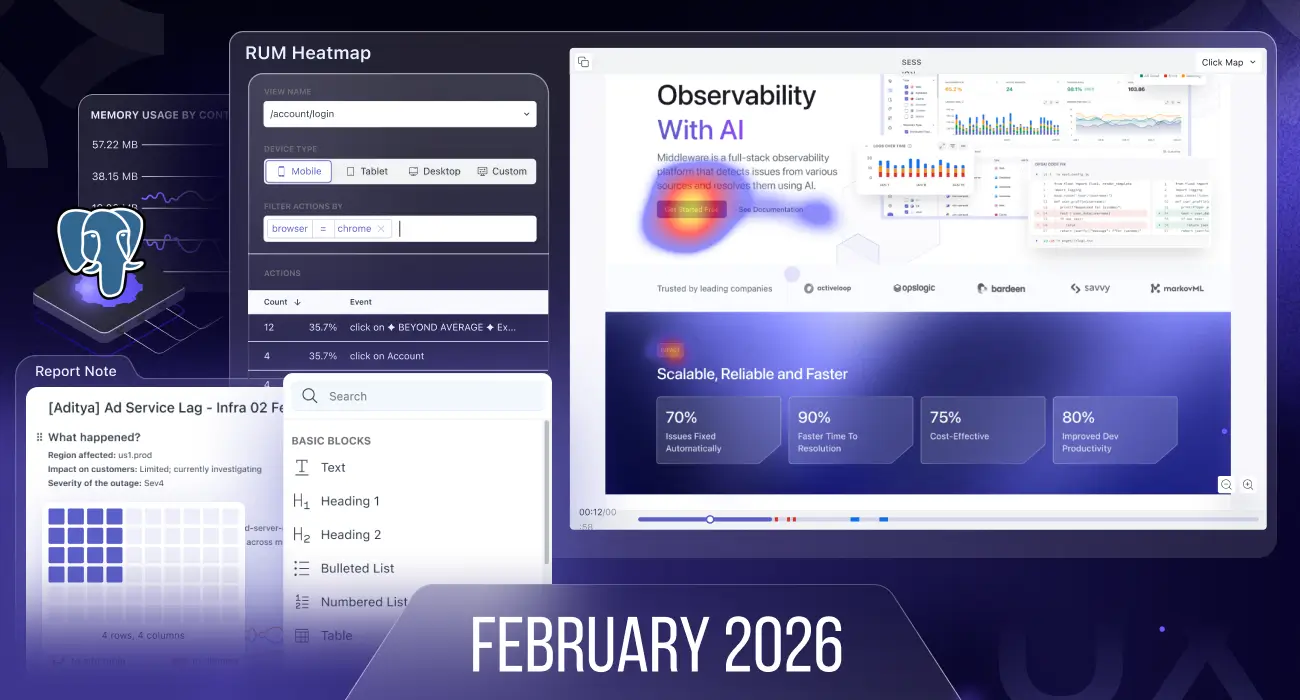
RUM Heatmap
We introduced Heatmaps for Real User Monitoring to help teams better understand how users interact with their web pages.
With heatmaps, users can:
- Analyze web page traffic visually to identify where users click the most.
- Detects rage clicks and abnormal user behavior patterns.
- View top clicked elements directly in the heatmap element view.
- Analyze actions with click counts and filters by session or action name.
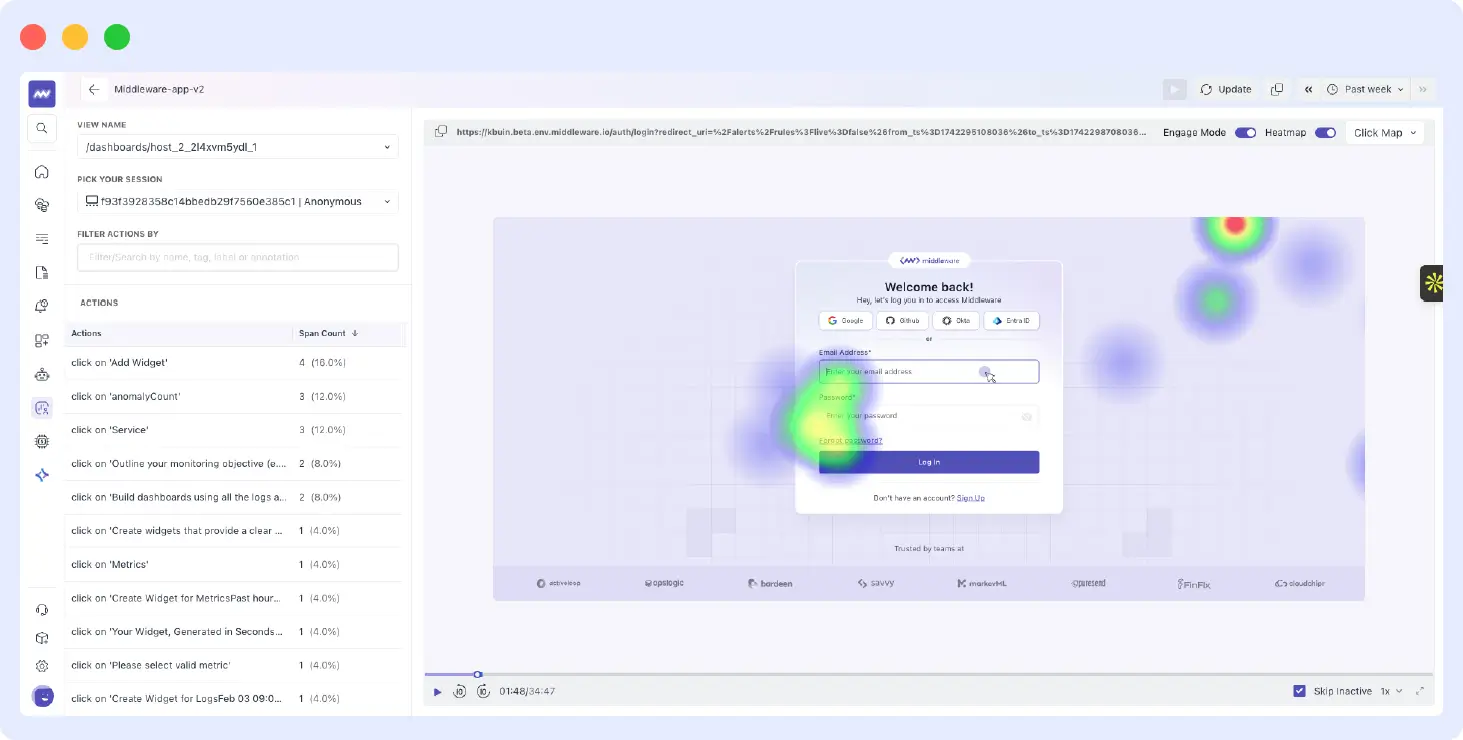
This helps teams quickly identify UX bottlenecks and engagement hotspots across web pages.
PostgreSQL Monitoring Improvements
We enhanced PostgreSQL database monitoring by scraping additional metrics. These new metrics allow users to:
- Build more detailed performance dashboards
- Monitor database health and query behavior
- Visualize database performance trends more effectively
Security Improvements
As part of our VAPT (Vulnerability Assessment and Penetration Testing) process, we implemented multiple security enhancements:
- Improved authentication mechanisms with stronger encryption
- Enhanced input validation controls
- Fixed potential vulnerabilities identified during testing
These improvements strengthen overall platform security and reliability.
APM Improvements
We introduced several usability and performance improvements in Application Performance Monitoring:
- Improved UI alignment inside span summary and error listings.
- Optimized data loading performance for the waterfall view inside span details.
These updates make trace analysis faster and easier for developers.
Alert UX Improvements
We improved the alert configuration experience:
- Added full-page scrolling while creating alerts for smoother navigation and configuration.
UI Improvements
Several UI issues were fixed to improve usability across the platform:
- Fixed repositioning issues for custom dashboard widgets.
- Resolved the issue where text was getting selected while resizing columns in the log listing view.
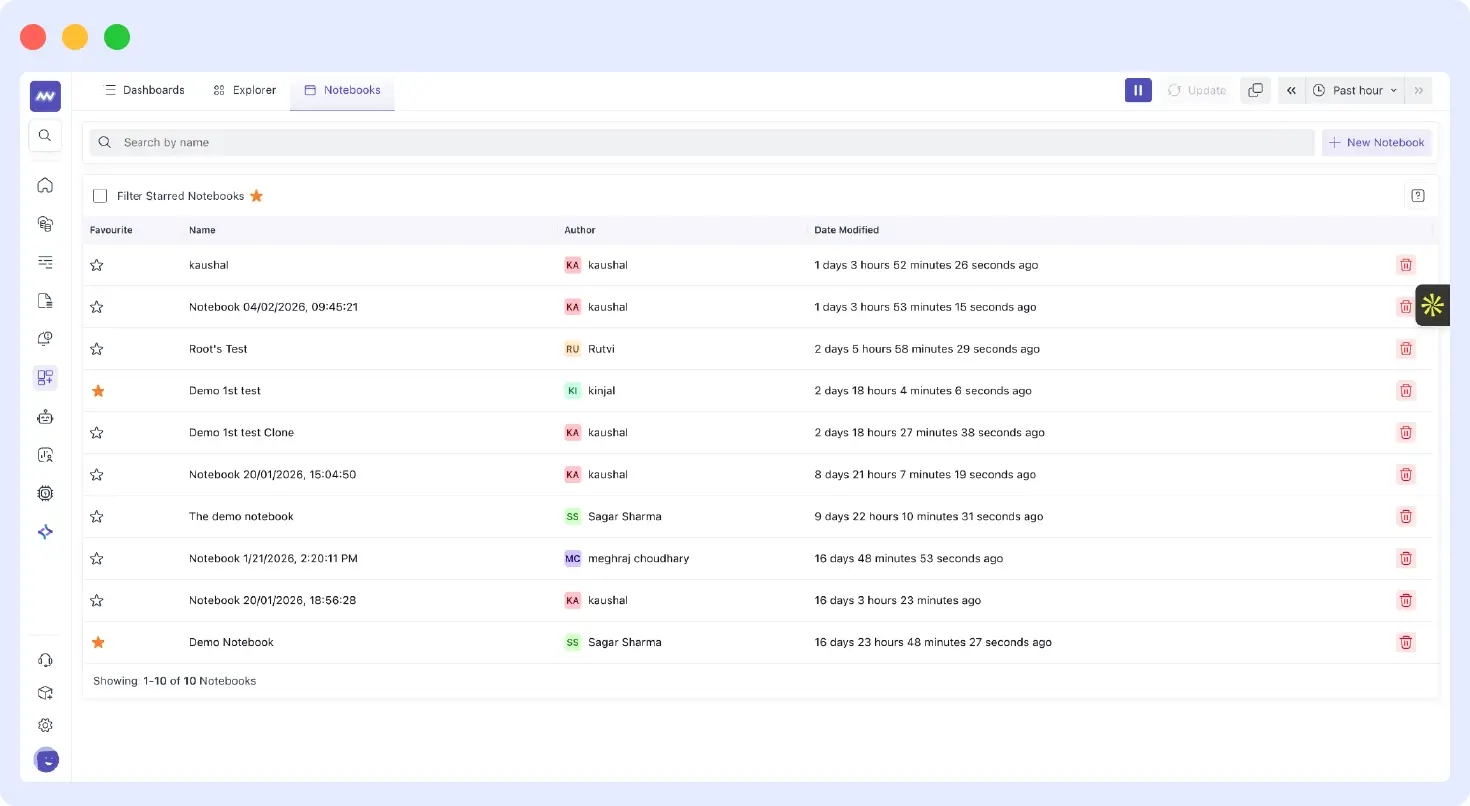
Notebook Update
The Notebook feature has been moved under Dashboards.
This change aligns with our future roadmap where we plan to expand notebooks with advanced dashboard-style capabilities for deeper analysis and collaboration.
Cloud Integration Improvements
We made several improvements to our cloud integrations.
AWS Improvements
- Revamped AWS RDS integration for Performance Insights metrics (polling).
- Added new widgets and improved legacy widgets.
- Updated AWS EC2 and ECS default dashboards with additional data points.
New GCP Dashboards
We introduced new dashboards for the following Google Cloud services:
- Cloud Run
- Load Balancing
- Pub/Sub
- Cloud Tasks
- Firestore
- Filestore
These dashboards provide better visibility into cloud infrastructure performance.
Other Improvements
Additional improvements across the platform include:
Saved Filters in Logs
- Added search and delete options for easier management.
Dashboard Charts
- Metric names now appear on hover as labels in pie charts.
RUM SDK Performance
- Improved SDK performance for better data collection efficiency.
APM Sidebar Filters
- Introduced grouped listings to reduce API calls and improve loading speed.
Default Dashboard Navigation
- Improved filter UX to retain selected dashboards when navigating back to the dashboard list.