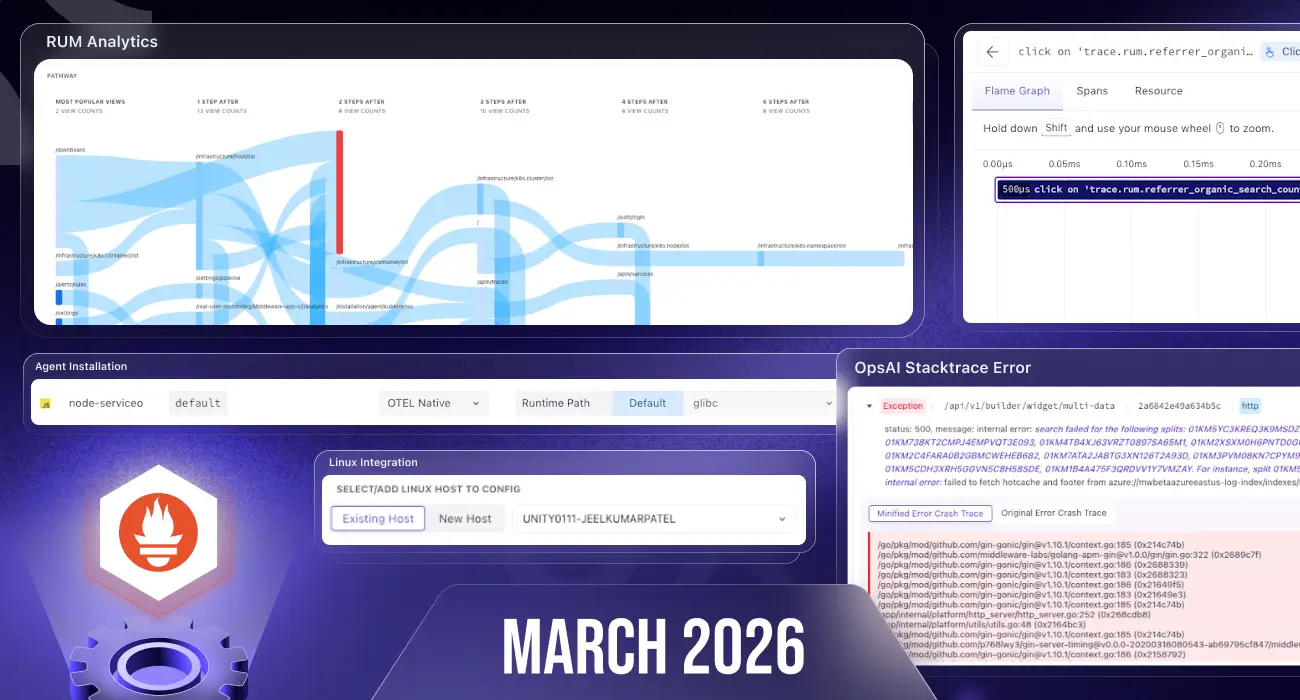
March focuses on security hardening, better observability integrations, improved UX across the platform, and deeper insights into RUM, APM, and alerts. We’ve also enhanced pipelines, serverless support, and database monitoring.
Here’s everything new this month 👇
🌐 RUM Updates
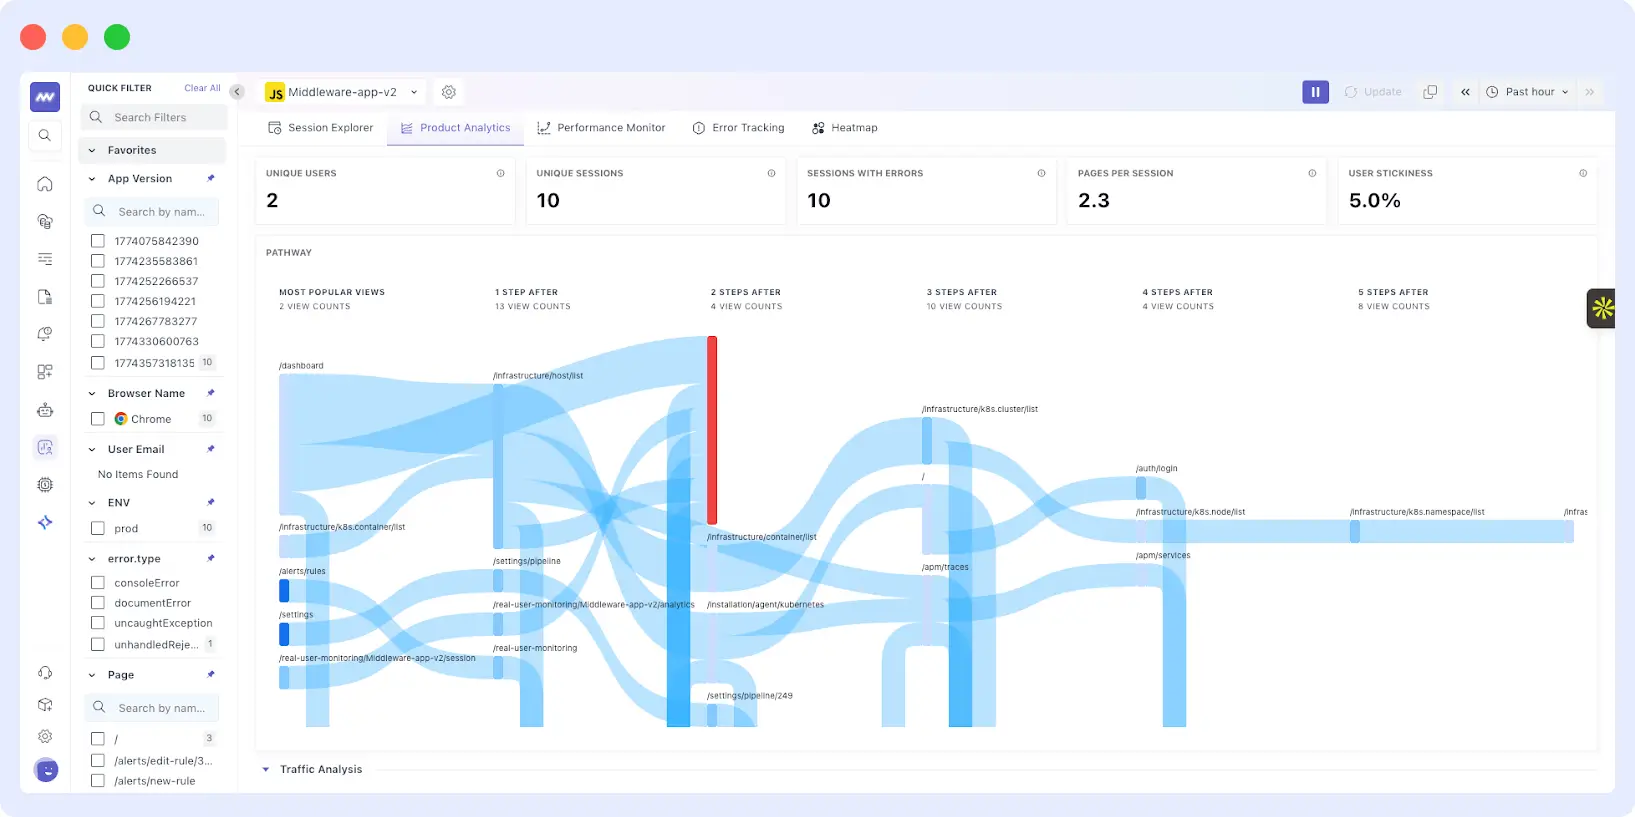
Product Analytics
Introducing Product Analytics Dashboard:
- Track user behavior and traffic patterns
- Visualize user journeys via Sankey charts
- Analyze user adoption and retention metrics
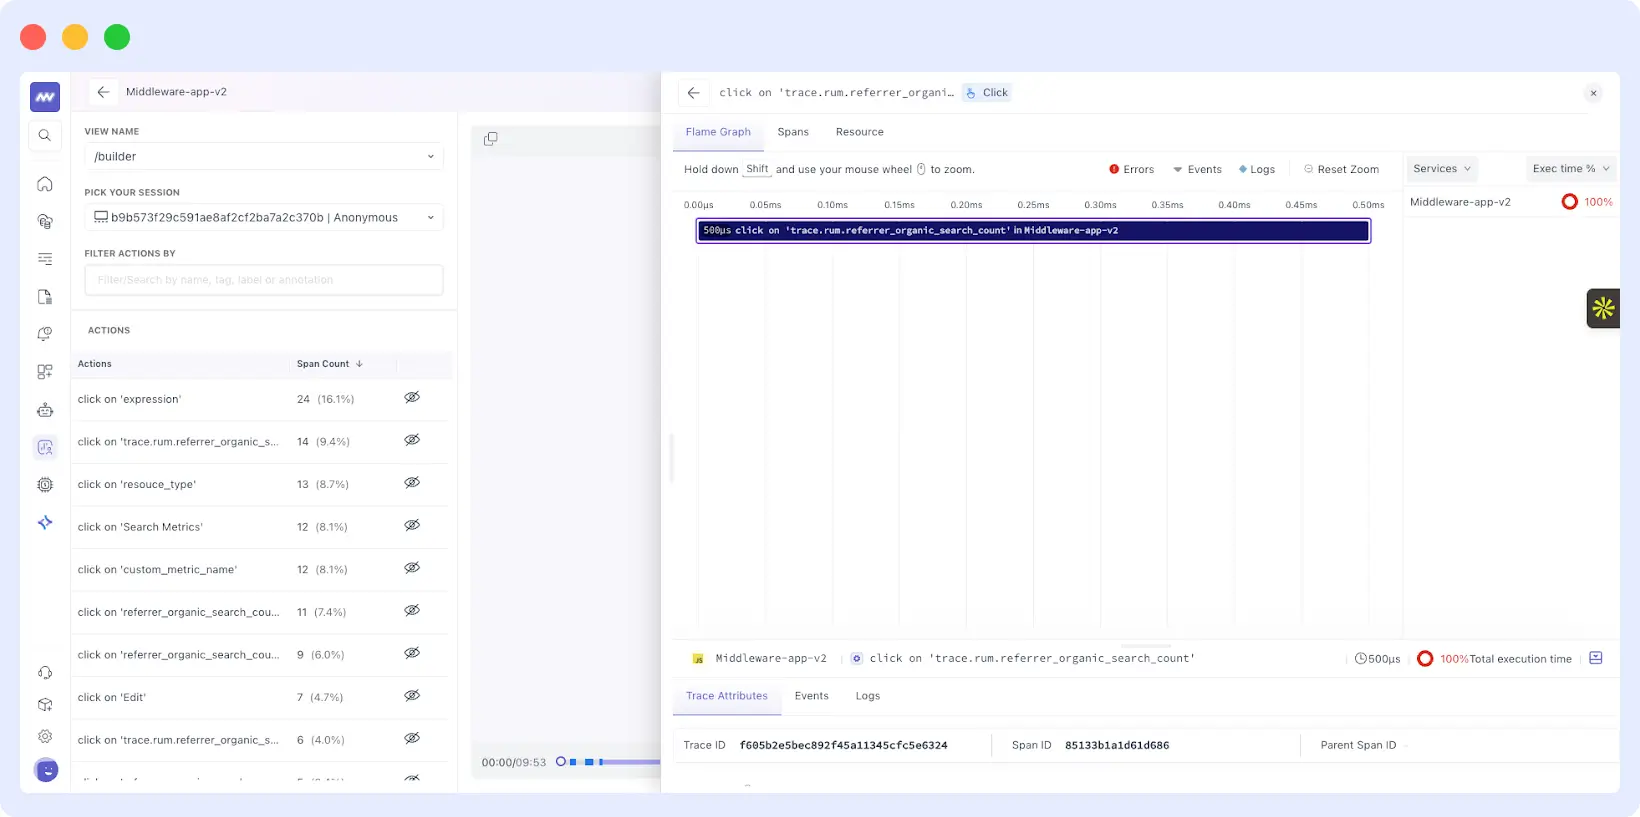
Heatmap + Backend Correlation
- Added Span Panel inside Heatmap details
- Correlate frontend clicks/errors directly with backend traces
🚨 Alerting Improvements
- Added interpolation functions for host-based alerts:
- Linear
- Last value
- Default Zero
- Auto-save for alert configuration
- Metrics and filters are preserved when navigating away
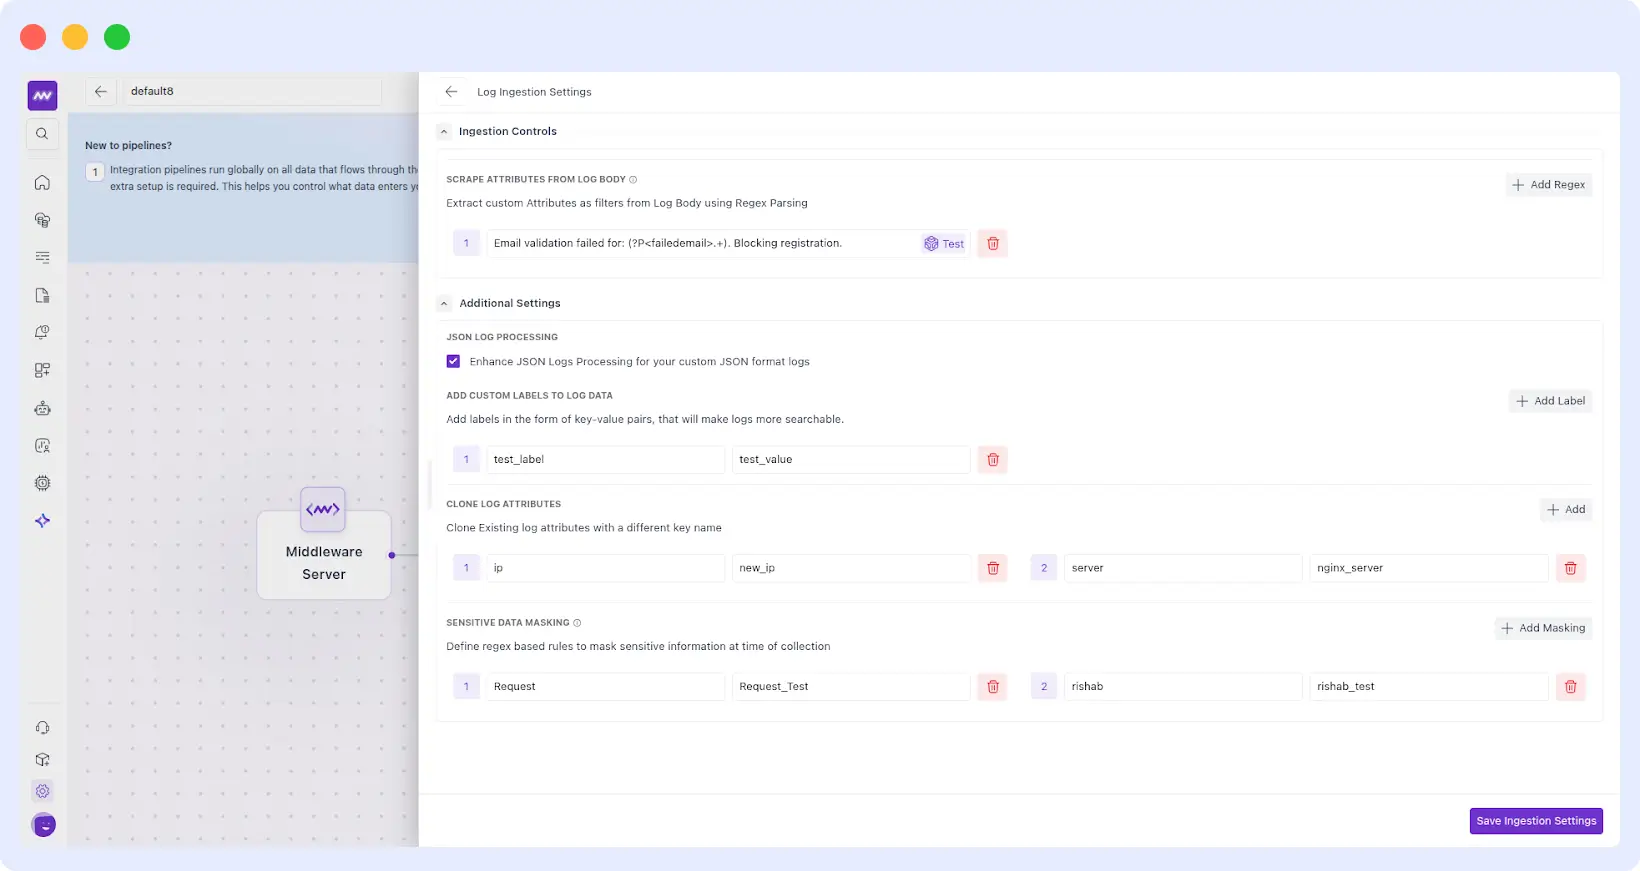
⚙️ Pipeline Enhancements for Serverless
Pipelines now fully support serverless environments:
- Log ingestion control
- JSON log parsing
- Custom labels
- Sensitive data masking
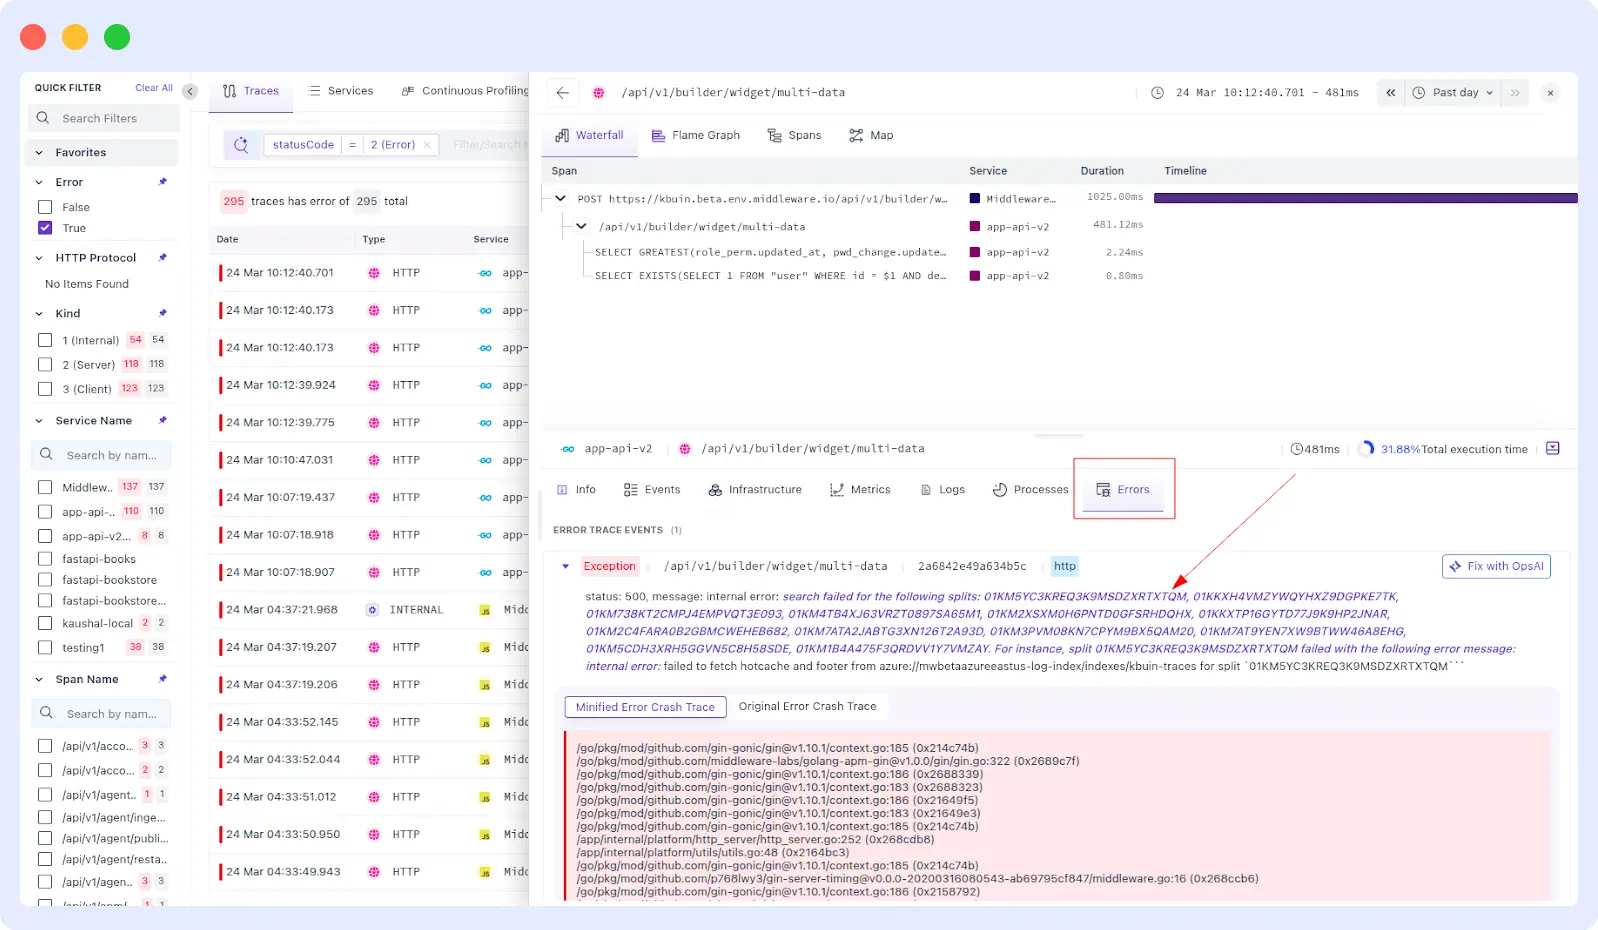
🔍 APM Improvements
- Improved stacktrace view in error tab
- Cleaner, more readable format
- Now consistent with OpsAI stacktrace view
🧩 Log & UI Enhancements
- Auto-detection of log severity
- Keywords like “error” or “warning” are now detected automatically
- Pie Chart Improvements
- Better labeling on hover based on grouped values
- Log Drilldown
- Added error message when no logs are available in “Related Logs”
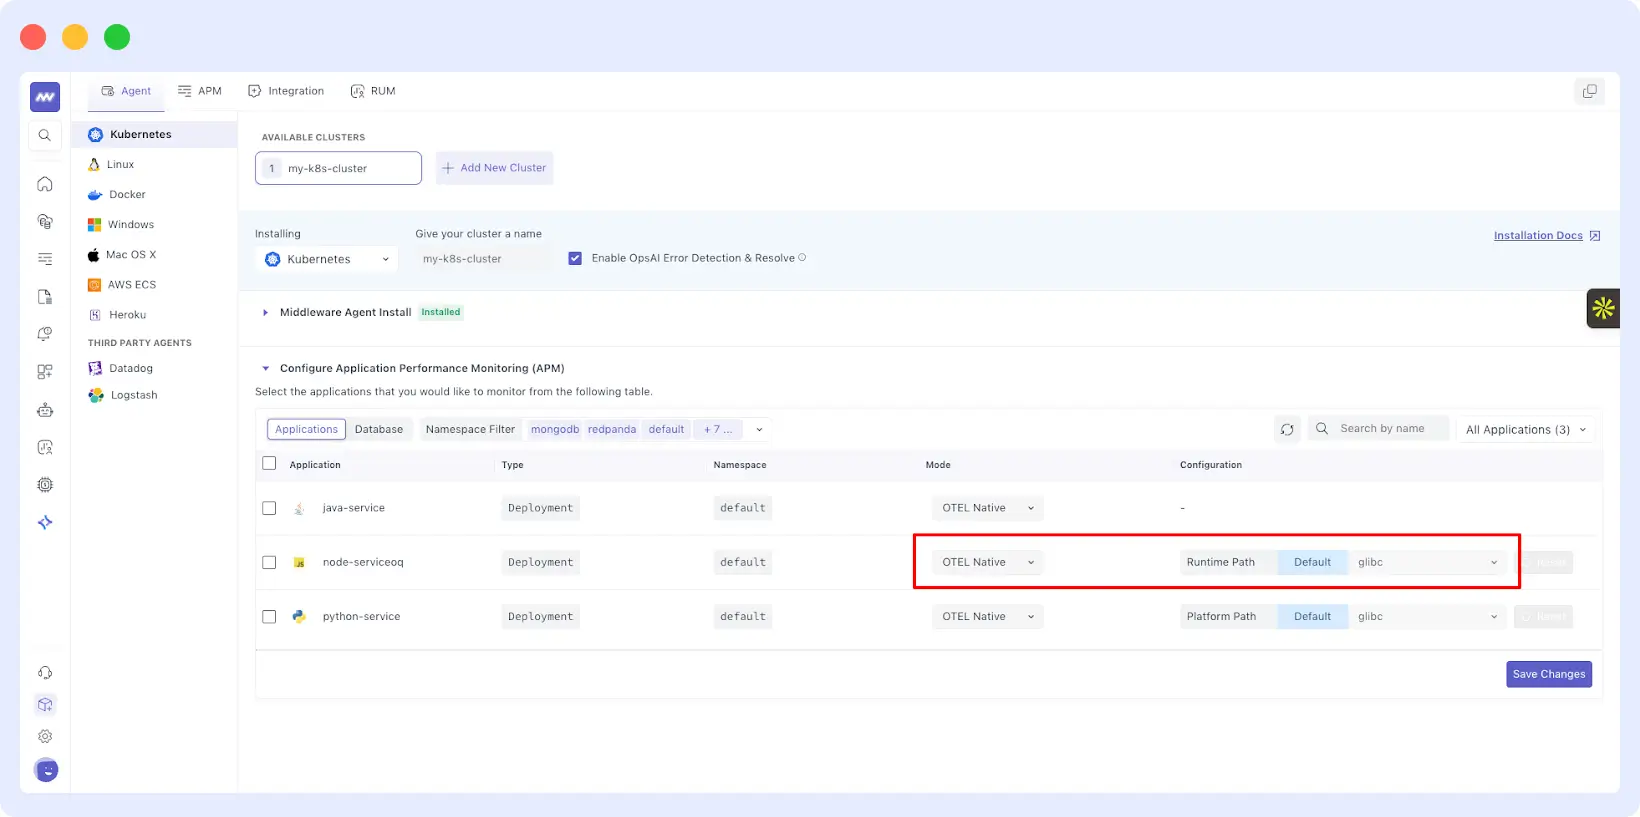
⚙️ Agent Installation Updates
Kubernetes Auto-Instrumentation
- Updated UI with:
- Auto-detection of executable paths
- Instrumentation mode with options:
- OpenTelemetry Native
- eBPF
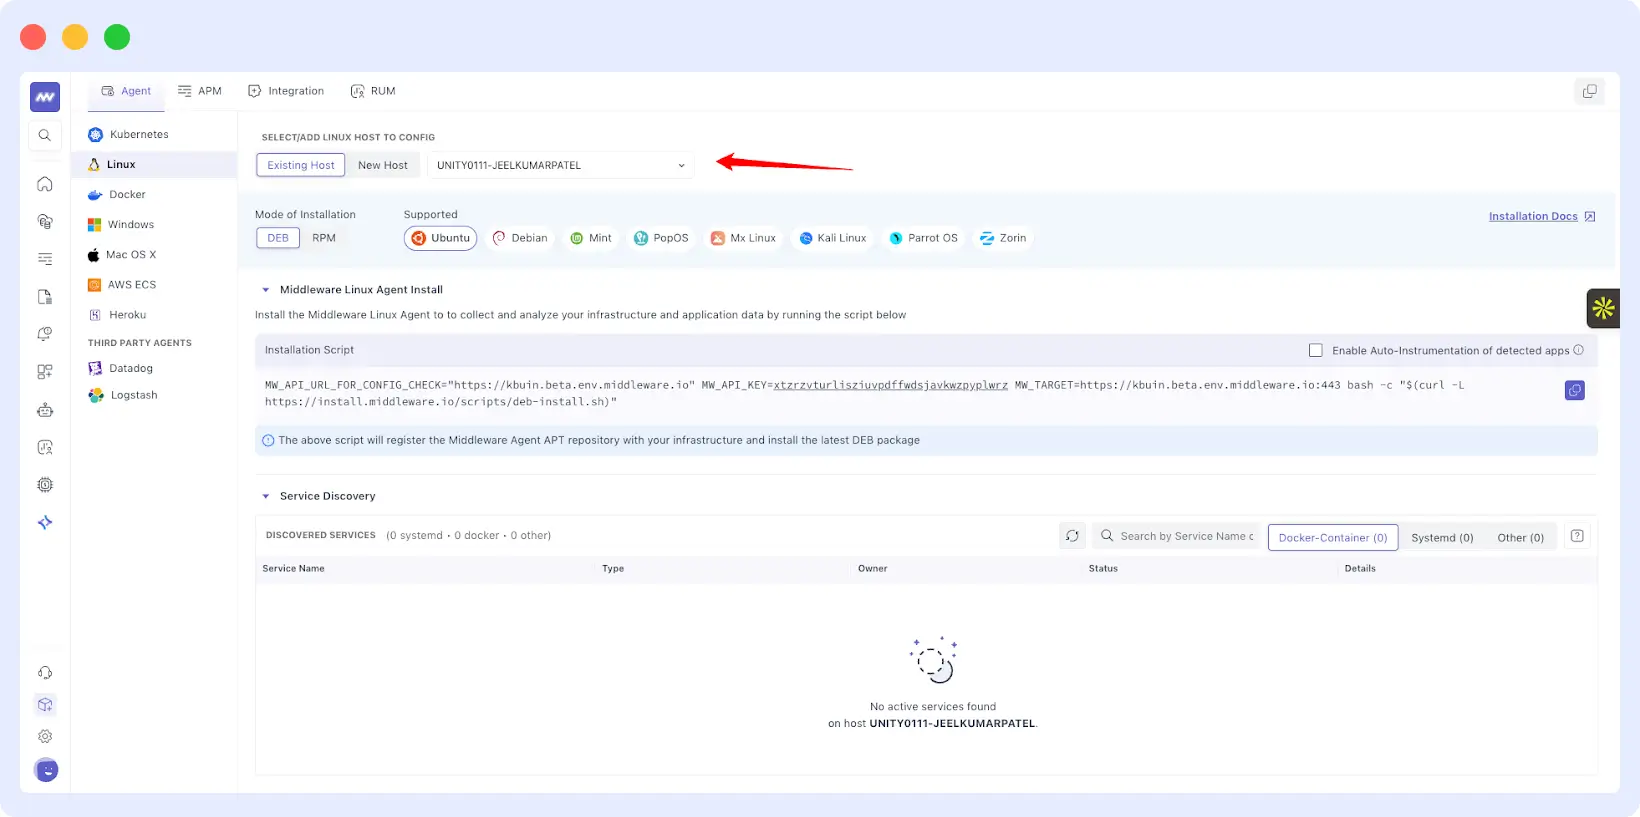
Linux Auto-Instrumentation
- Improved setup flow:
- Existing vs new host handling with new UI
- Better service discovery UX
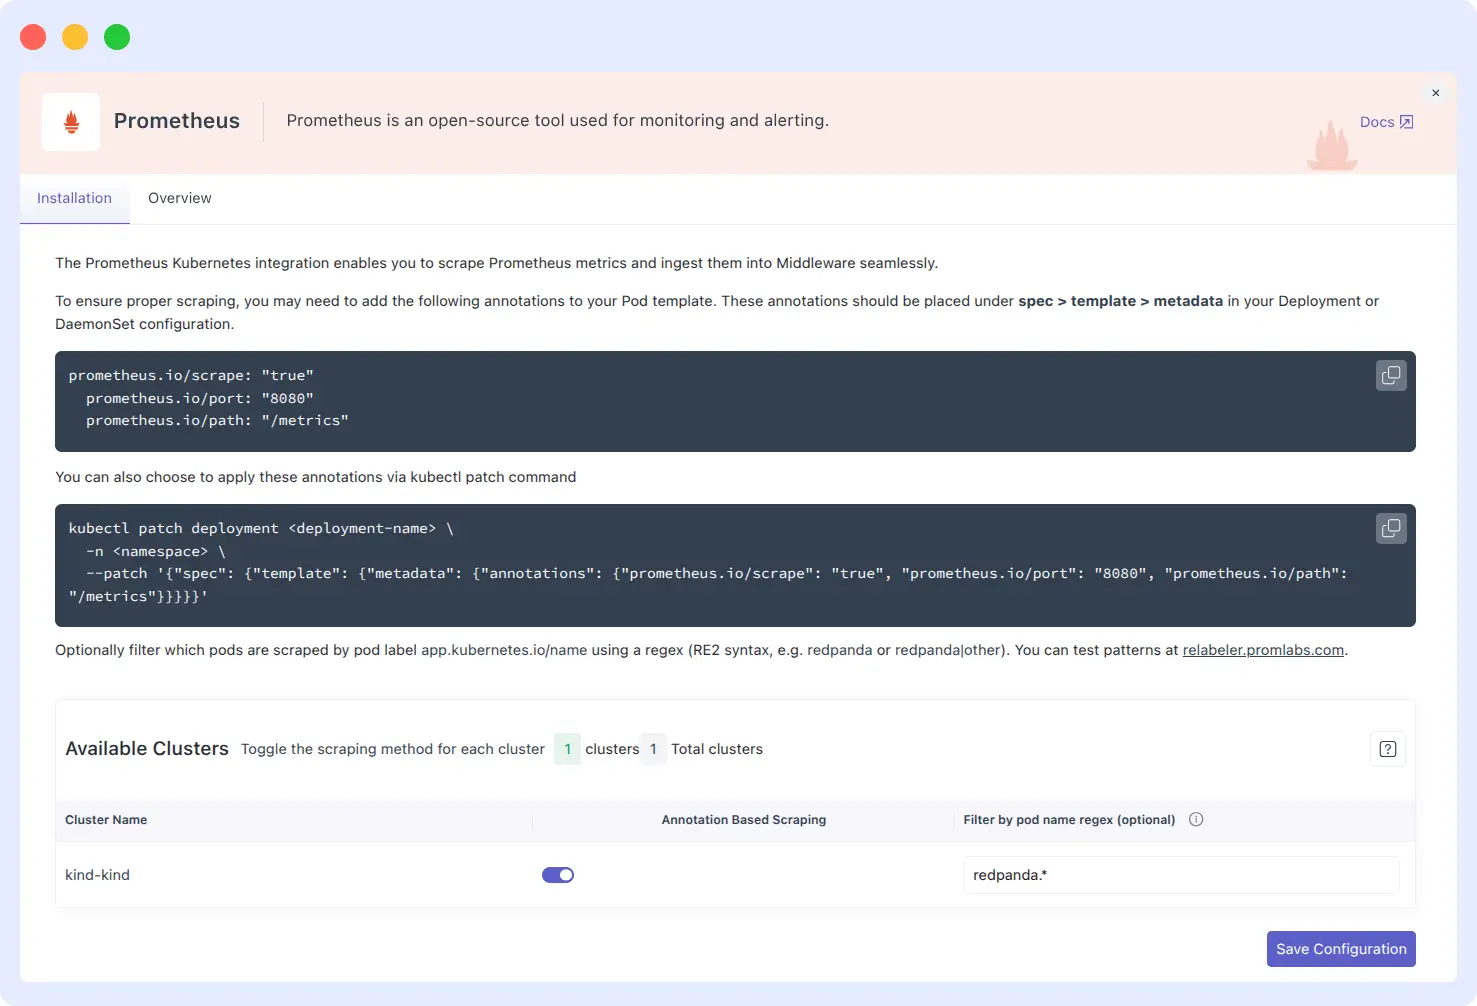
📈 Prometheus Integration Upgrade
- Added pod name regex filtering
- Enables scraping metrics for specific databases only
(e.g., Redpanda, MongoDB, PostgreSQL)
🐘 PostgreSQL Integration Upgrade
Expanded PostgreSQL observability with:
- Events tracking
- Query sample collection
- Top query insights
- Connection pool metrics
All available in default PostgreSQL dashboard
🐧 Linux Integration UX
Improved the experience for accounts with large infrastructure:
- Host list is now moved into a dropdown selector for auto-instrumentation.
- Makes it easier to manage environments with hundreds of machines.
🔌 Integration Enhancements
Redis
Support for multiple endpoints per machine for Redis integration
Kafka
- Fetch cluster-wide broker metrics from a single node
- No need to integrate Kafka on every node in a multi-node cluster
JVM
Updated JVM dashboards with new performance metrics
🎨 UX Improvements Across Platform
- Infra Monitoring
- Added Group By option in tables
- Table Component Upgrades
- Display total record count without scrolling
- Resize columns independently without affecting others
- Dashboard Builder
- Dropdowns now dynamically resize based on screen size
- Settings → Projects
- Click project name to open directly from list
🧪 Browser Testing
- Added support to import recordings from Chrome Recorder
- Makes test creation faster by reusing recorded user flows
🔐 Security Improvements
We’ve strengthened platform security
- Added rate limiting on API endpoints to prevent abuse.
- Updated third-party libraries and removed unnecessary dependencies.
- Improved authorization flows for:
- Role creation
- Permissions
- User invites