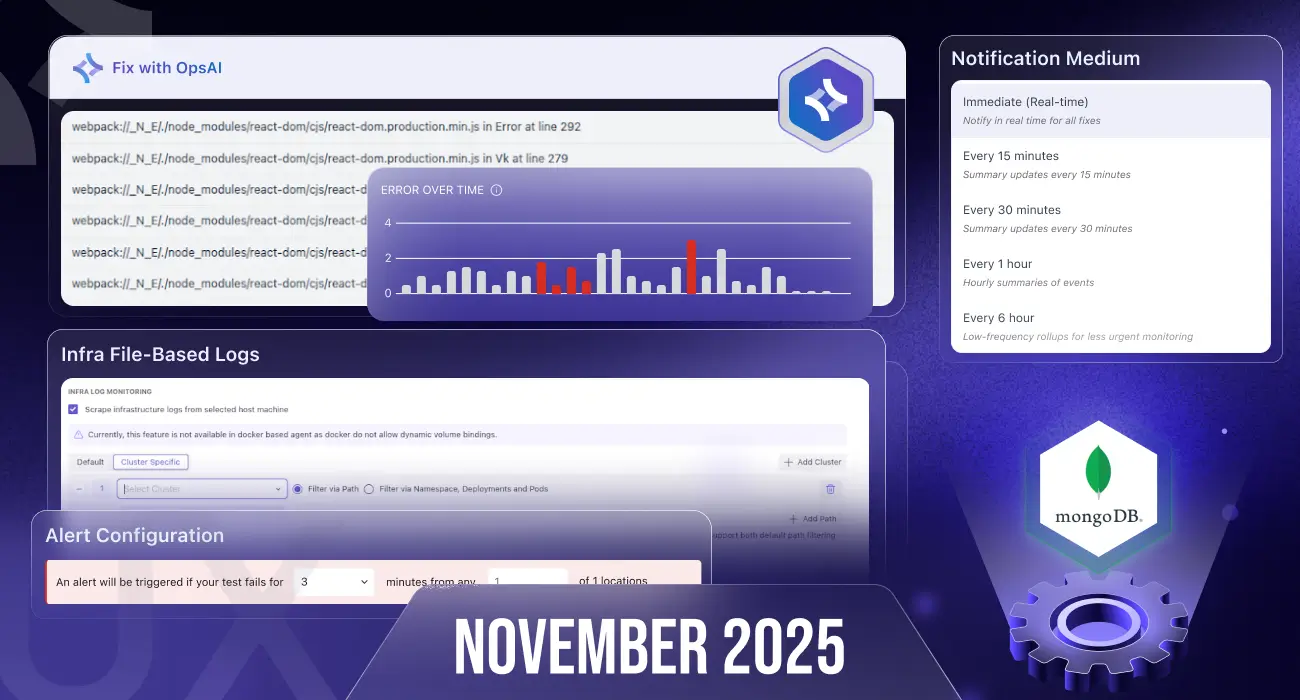
November brings major improvements across Ops AI, Synthetic Monitoring, Integrations, Ingestion Control, and UI/UX.
We focused on automation, clarity, and platform-wide performance enhancements.
🤖 Ops AI – More Control, More Automation, More Speed
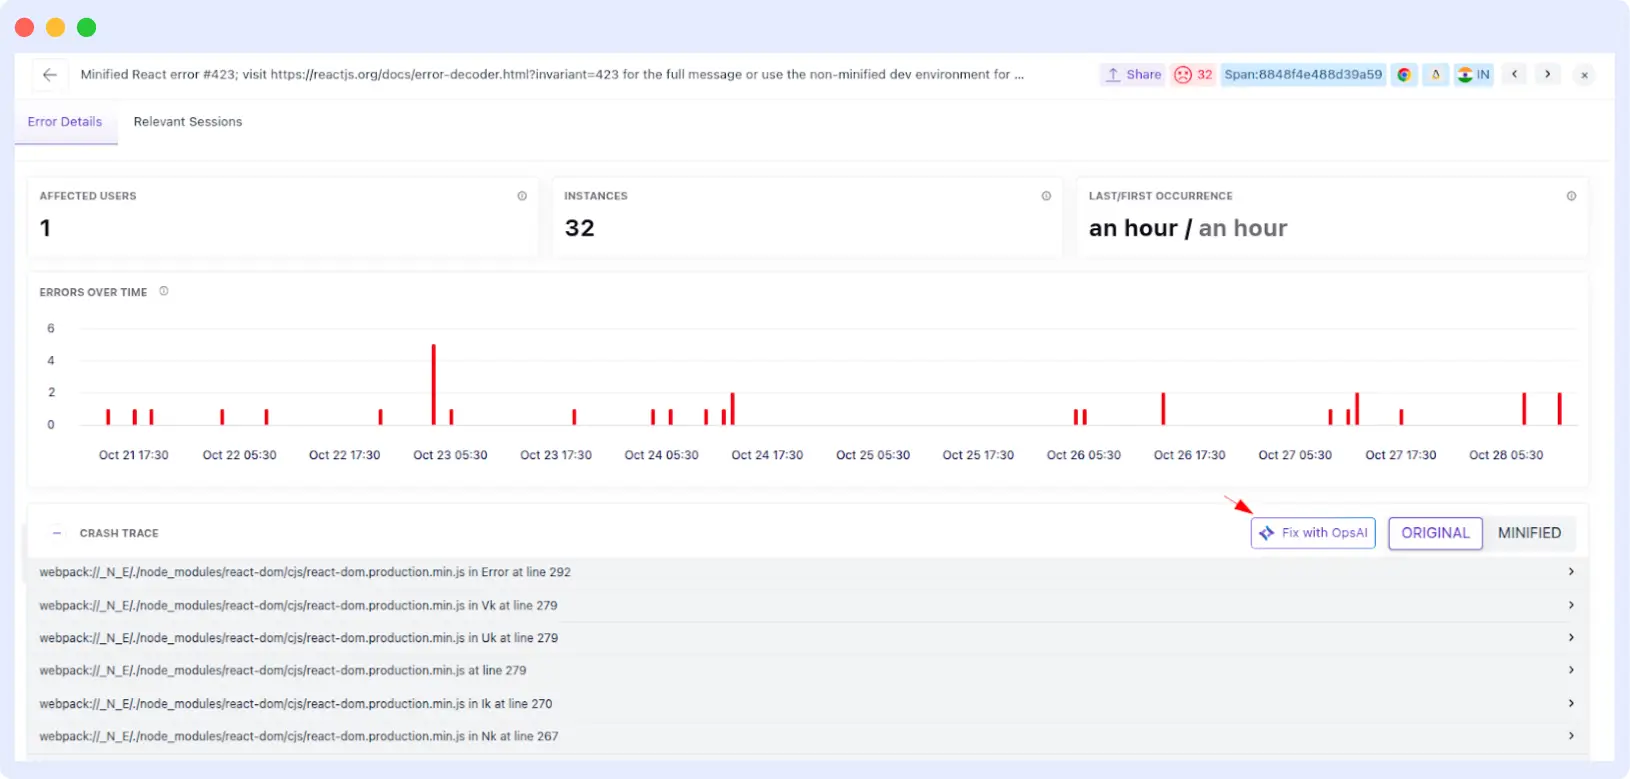
Fix errors directly inside APM & RUM
You can now trigger OpsAI fixes from within the APM and RUM error listing screens, making troubleshooting fully in-context and much faster.
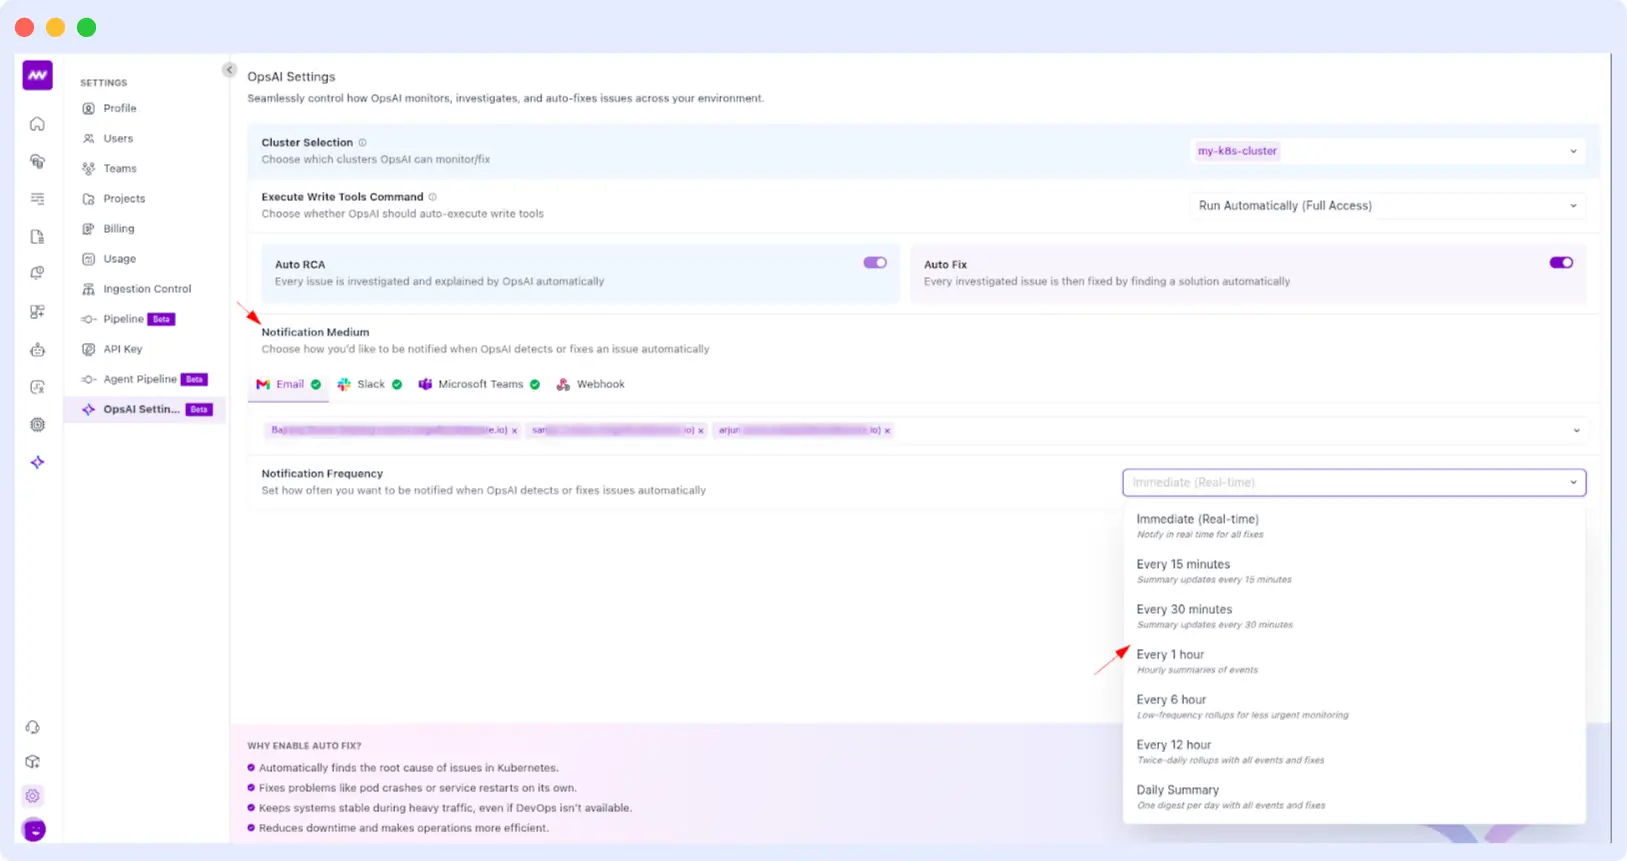
⚙️ OpsAI Automation Settings – Full Control Per Cluster
We introduced a more flexible automation workflow so teams can decide exactly where OpsAI should run.
- Select specific clusters for automation.
- Enable or disable Auto RCA and Auto Fix per cluster.
- Configure notification channels: Slack, Microsoft Teams, Email, Webhook.
- Customize notification intervals for updates on OpsAI auto-fixed issues.
UI Enhancements & Quality Fixes
- Resolved scrolling, spacing, and loading inconsistencies.
- Added search within OpsAI error listings so you can find errors by name instantly.
🔌 Integration Improvements
We expanded and stabilized several integrations to support more observability workflows.
Windows Event Log
Updated integration with improved documentation and examples for adding logs to custom channels.
Database Integrations
- Fixed dashboard builder UI for SQL Server and MongoDB Atlas.
- Added data collection visibility lists for:
- Redpanda
- Kafka
- OracleDB
- SQL Server
- MongoDB Atlas
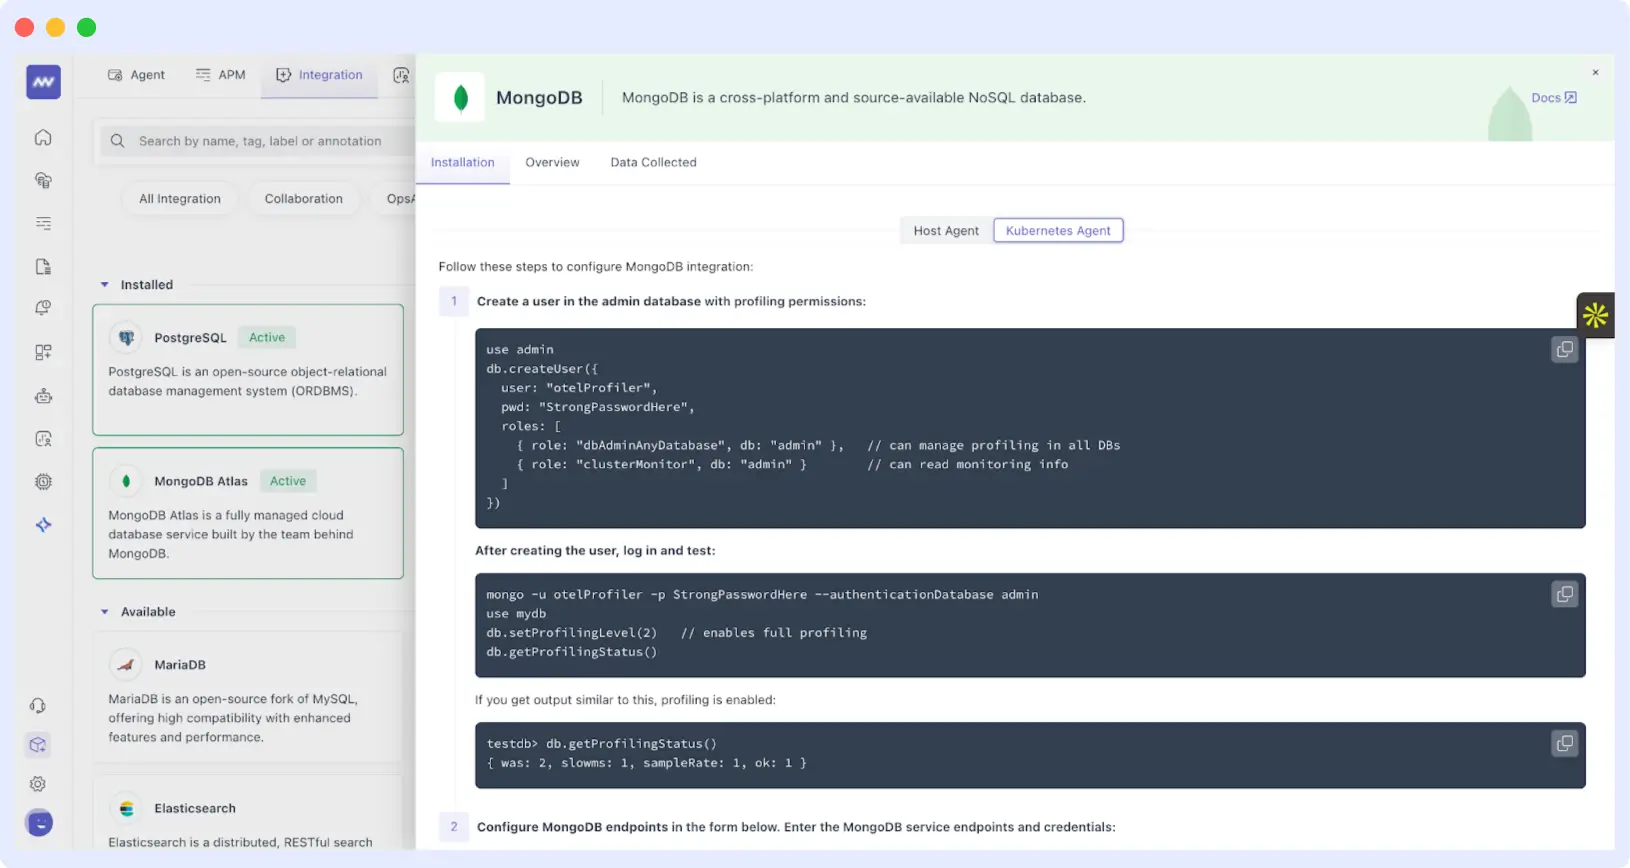
MongoDB for Kubernetes
MongoDB integration is now supported inside Kubernetes environments.
Cloud Integrations
Cloud providers (AWS, Azure, GCP) are now moved from Account-level → Project-level for better multi-cloud and multi-env support.
📚 New Documentation Portal
Our completely redesigned docs are live:
👉 https://docs.middleware.io/quickstart Includes:
- Full-content search
- Cleaner structure
- Faster navigation
📊 Pipeline Enhancements
Added an option to disable histogram metrics from the Metrics Pipeline settings to reduce metric volume and control cost.
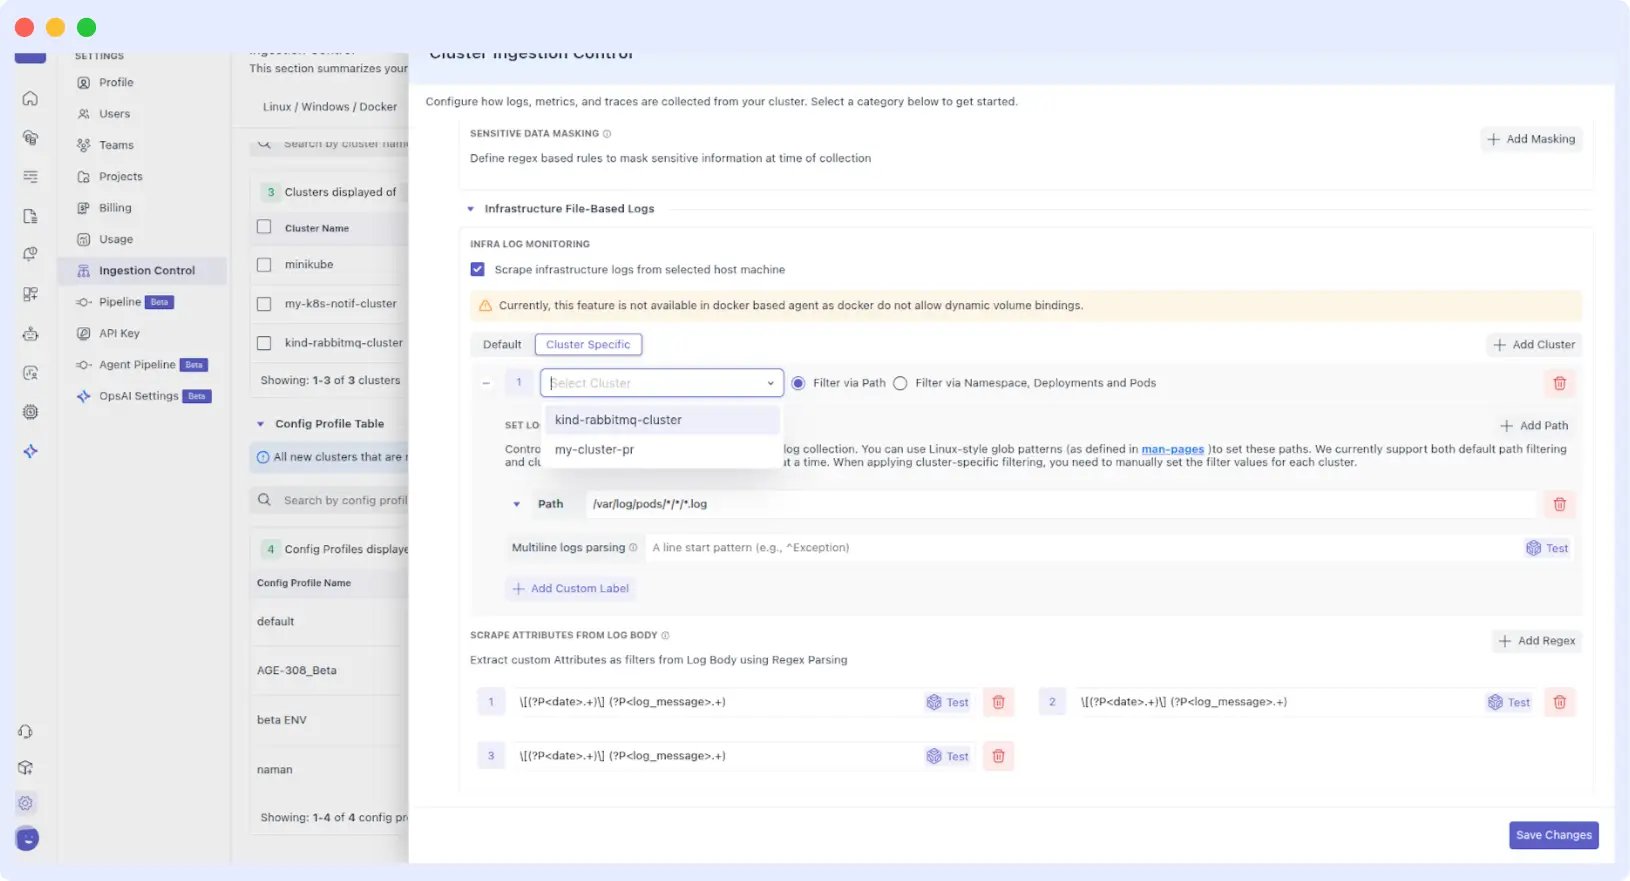
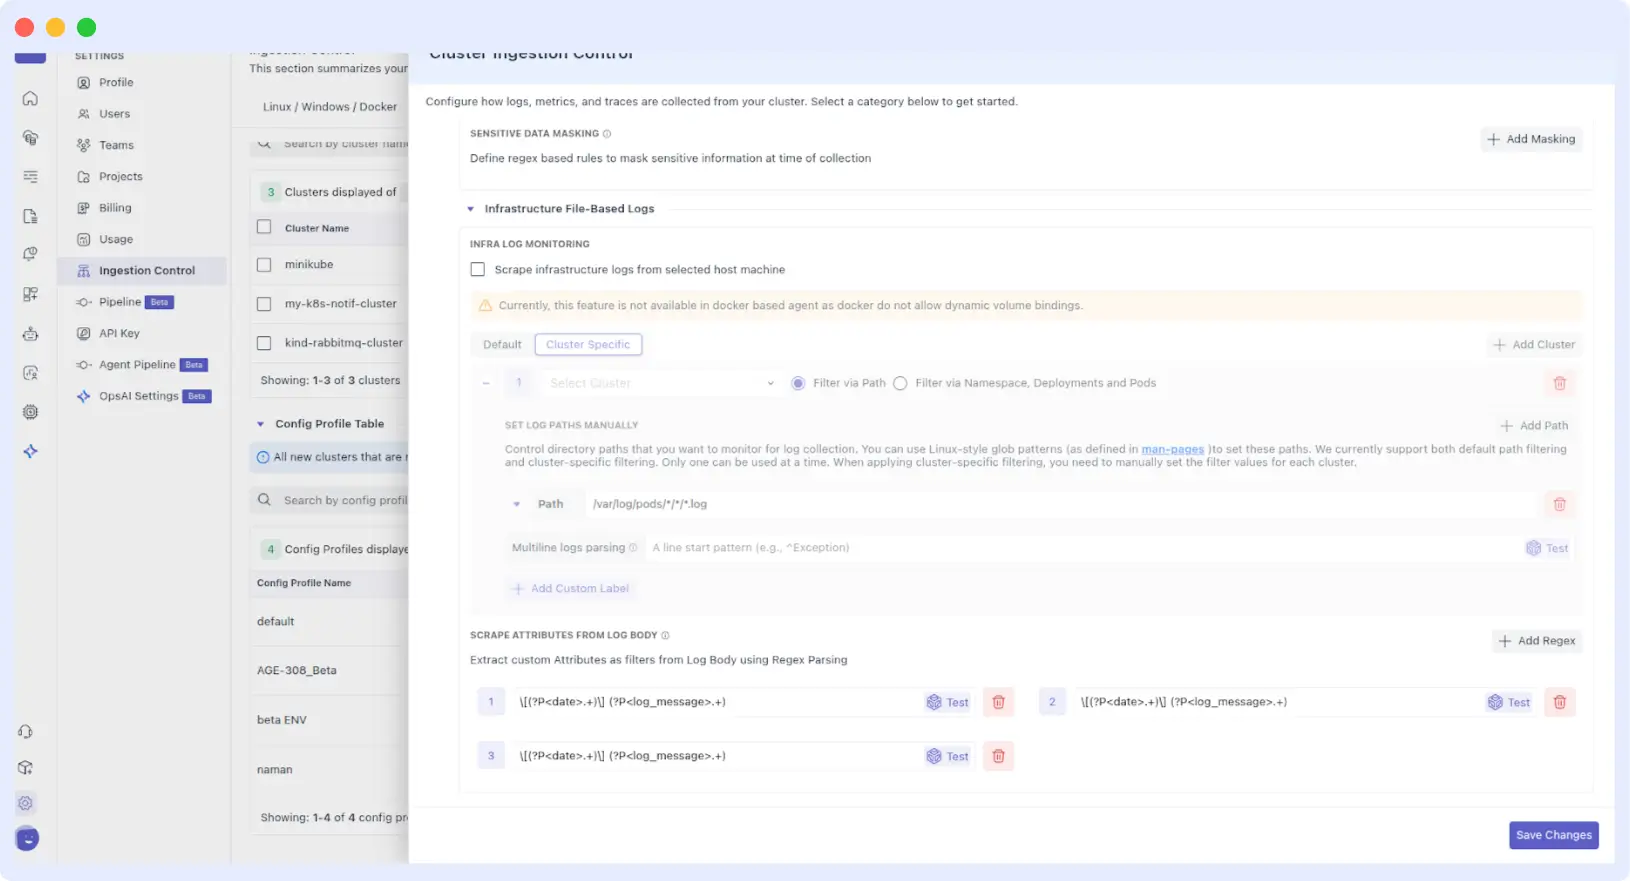
🗂️ Ingestion Control – Better Cluster-Level Configuration
Updated UI/UX for K8s ingestion controls:
- Moved cluster-specific log paths from:
K8s Ingestion Control → Infrastructure → File-Based Path Logs - Added two configuration modes:
- Default cluster path config
- Cluster-specific path config
This gives deeper control for including/excluding namespaces, deployments, and pods for data collection.
🚨 Alerts + PagerDuty Improvements
We improved the sync between Middleware alerts and PagerDuty:
- Alerts auto-resolving inside Middleware now auto-update PagerDuty to “Recovered.”
🔐 Fixes & Platform-Wide Improvements
Role & Access
- Write permissions automatically enable corresponding read permissions.
- Dashboard Builder now supports granular access:
- View
- Create
- Edit
- Delete
OpsAI Security
- Added HMAC-based authentication for more secure request validation.
- Additional UI stability and consistency fixes.
AWS Integration
- Improved ingestion limits and introduced a batching mechanism for high-volume metrics.
- ECS fix: Resolved errors caused by empty task lists.
🎨 UI Enhancements
- Fixed tooltip visibility in Deployments, ReplicaSets, and DaemonSets.
- Cloud integration pages now have simplified layouts with no nested scrolling.
- Updated Settings → Usage charts to a new library for better performance and precision.
- Standardized validation messages across Login, Signup, and Password flows for clearer user feedback.
📈 Status Page Optimization
APIs for fetching service history now load faster and with less overhead.
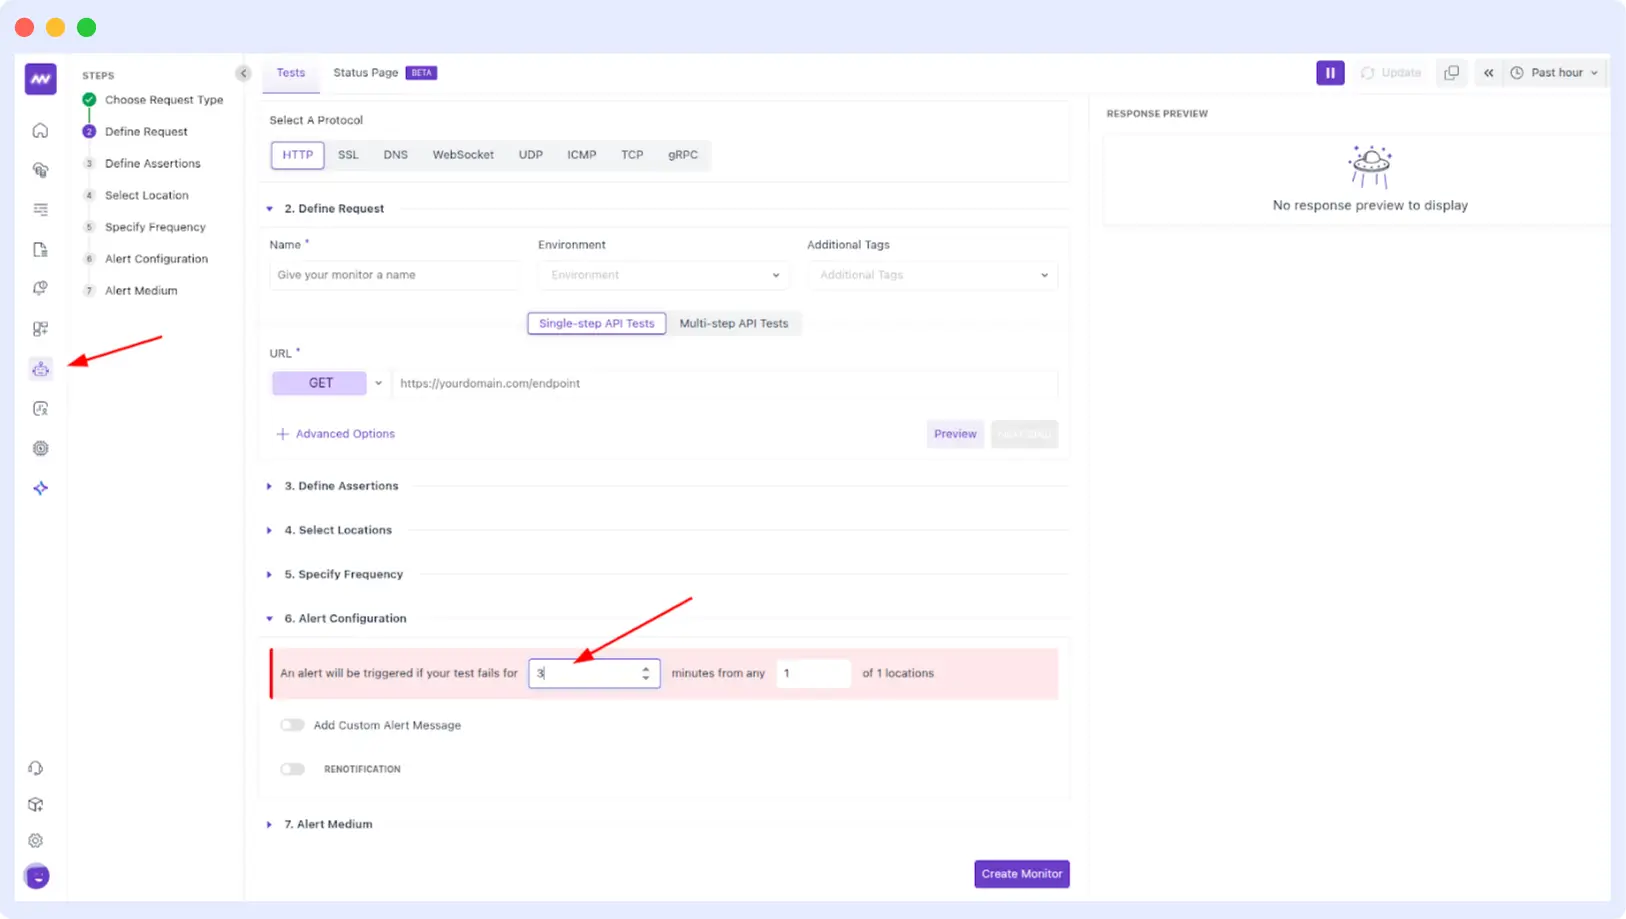
🌐 Synthetic Monitoring Enhancements
- Added support for selecting Kubernetes clusters as test locations for on-premise synthetic checks.
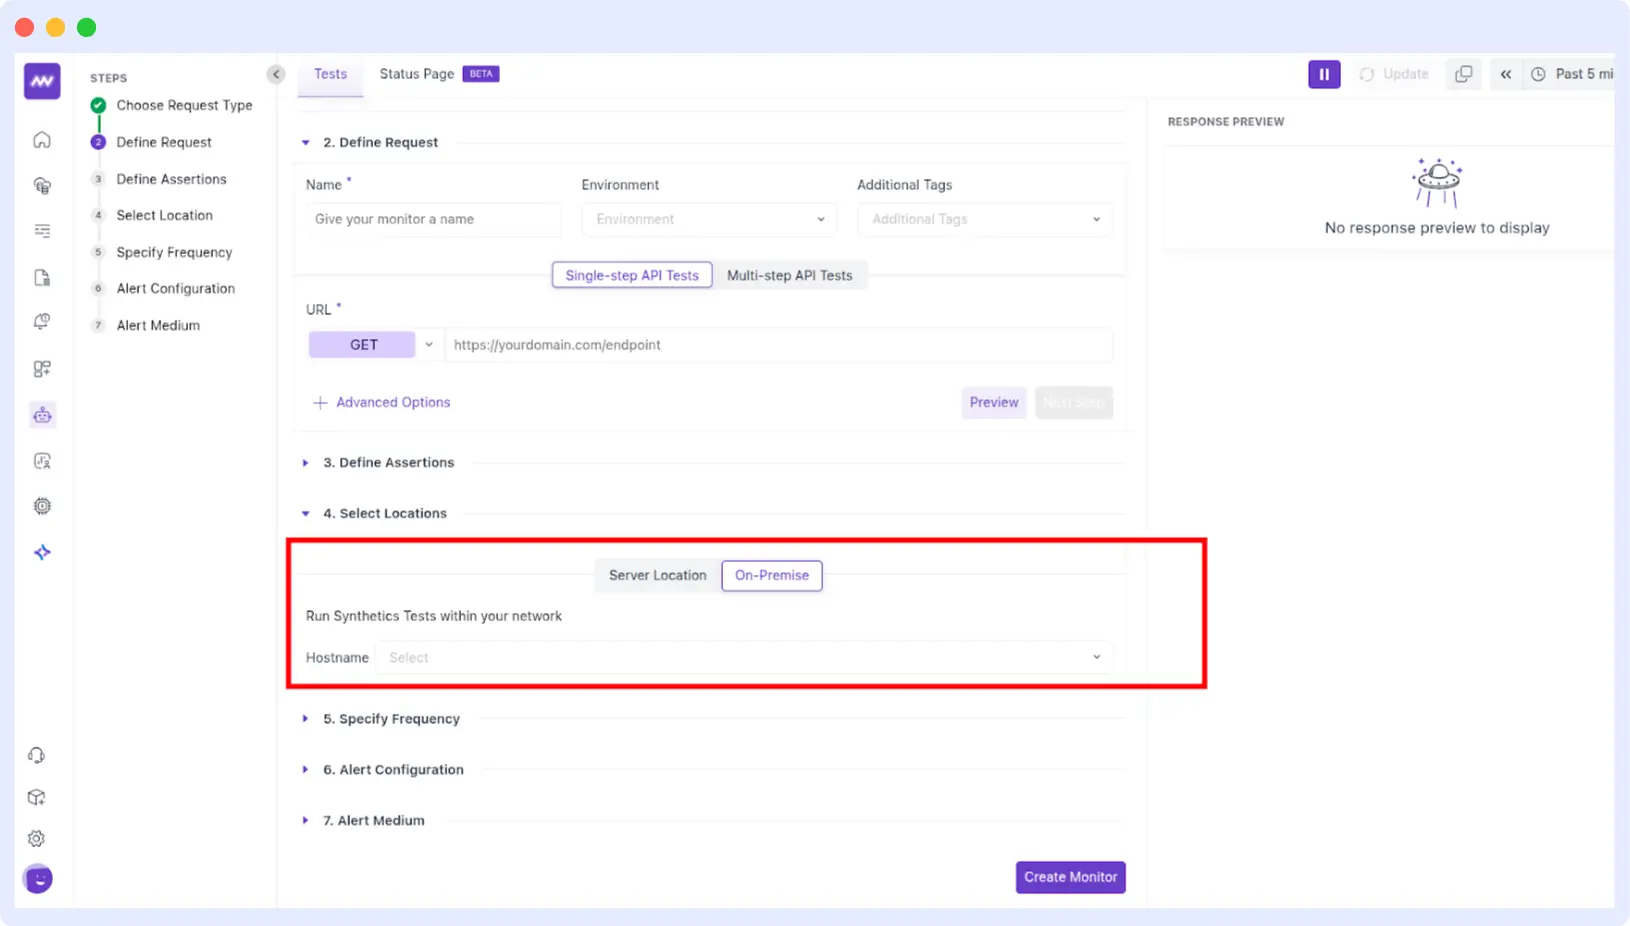
- Removed mandatory location selection for on-prem synthetic checks.
- Fixed issue where alert updated time didn’t reflect after editing.
- Added custom time selection for synthetic alerting rules.
🐞 Fixes
- Agent Pipeline: Host is now auto-assigned for the default profile.
- APM: Logs now appear correctly inside the Logs tab of Span Detail view.
- Infrastructure Monitoring:
- Fixed missing data for “Most RAM-intensive” and “Most CPU-intensive” containers.
- Resolved cluster dashboard time-range mismatches.
Logs UI: New logs now load correctly after scrolling — no more stuck views.