We’ve shipped a bunch of new features and improvements across Middleware to give you more control, clarity, and speed in managing your observability workflows. Here’s everything new this month:
🔍 Logs – More Context, Less Guesswork
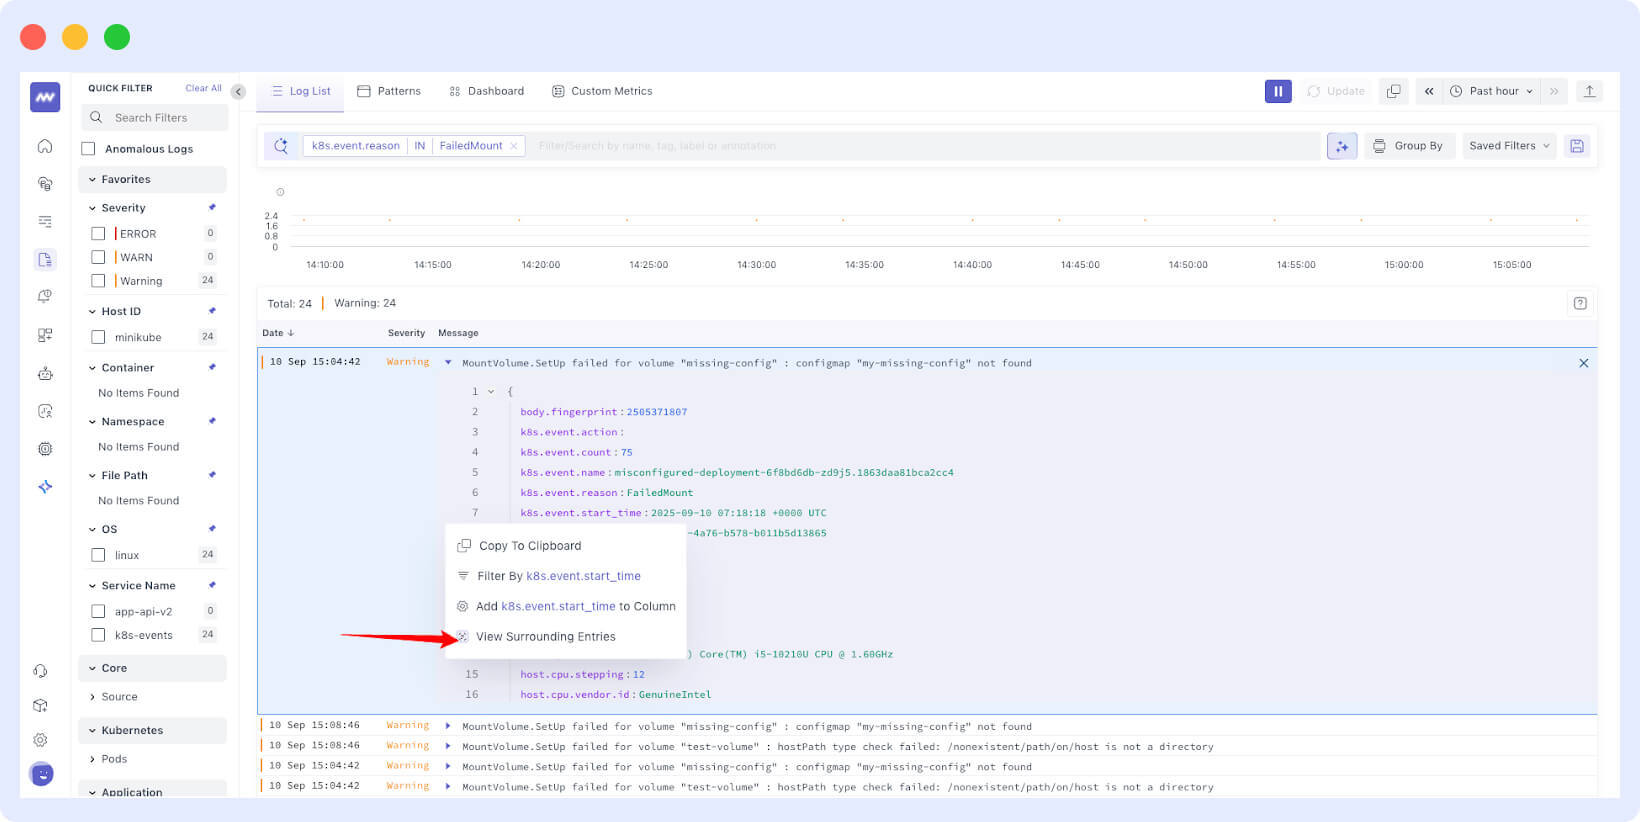
- Surrounding Logs View
You can now view logs with the same attribute using the new “Surrounding Logs” option — making it easier to spot patterns and investigate related events.
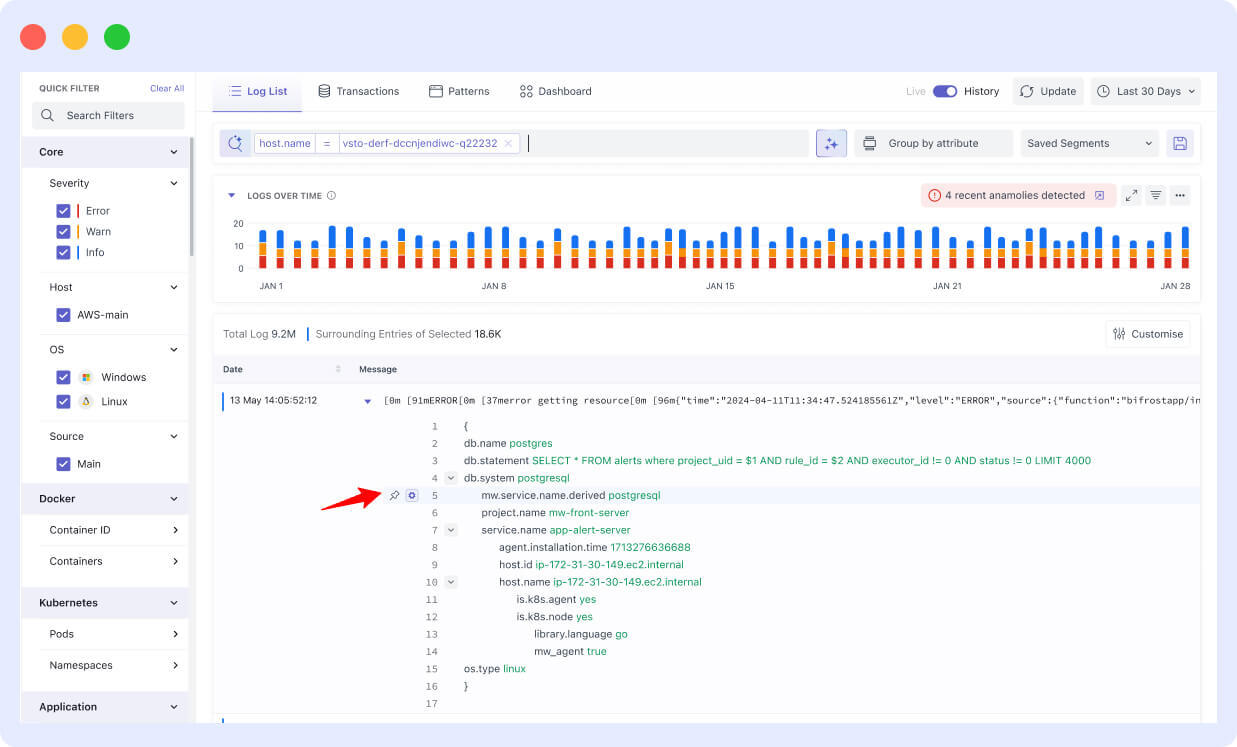
- Pin Attributes in Log View
In the expanded log view, pin important attributes to keep them fixed at the top for faster analysis.
👥 Project-Level Access Control
- Admins can now assign access per project to specific users.
- While inviting users, you can directly select which projects they should have access to — and edit these later as needed.
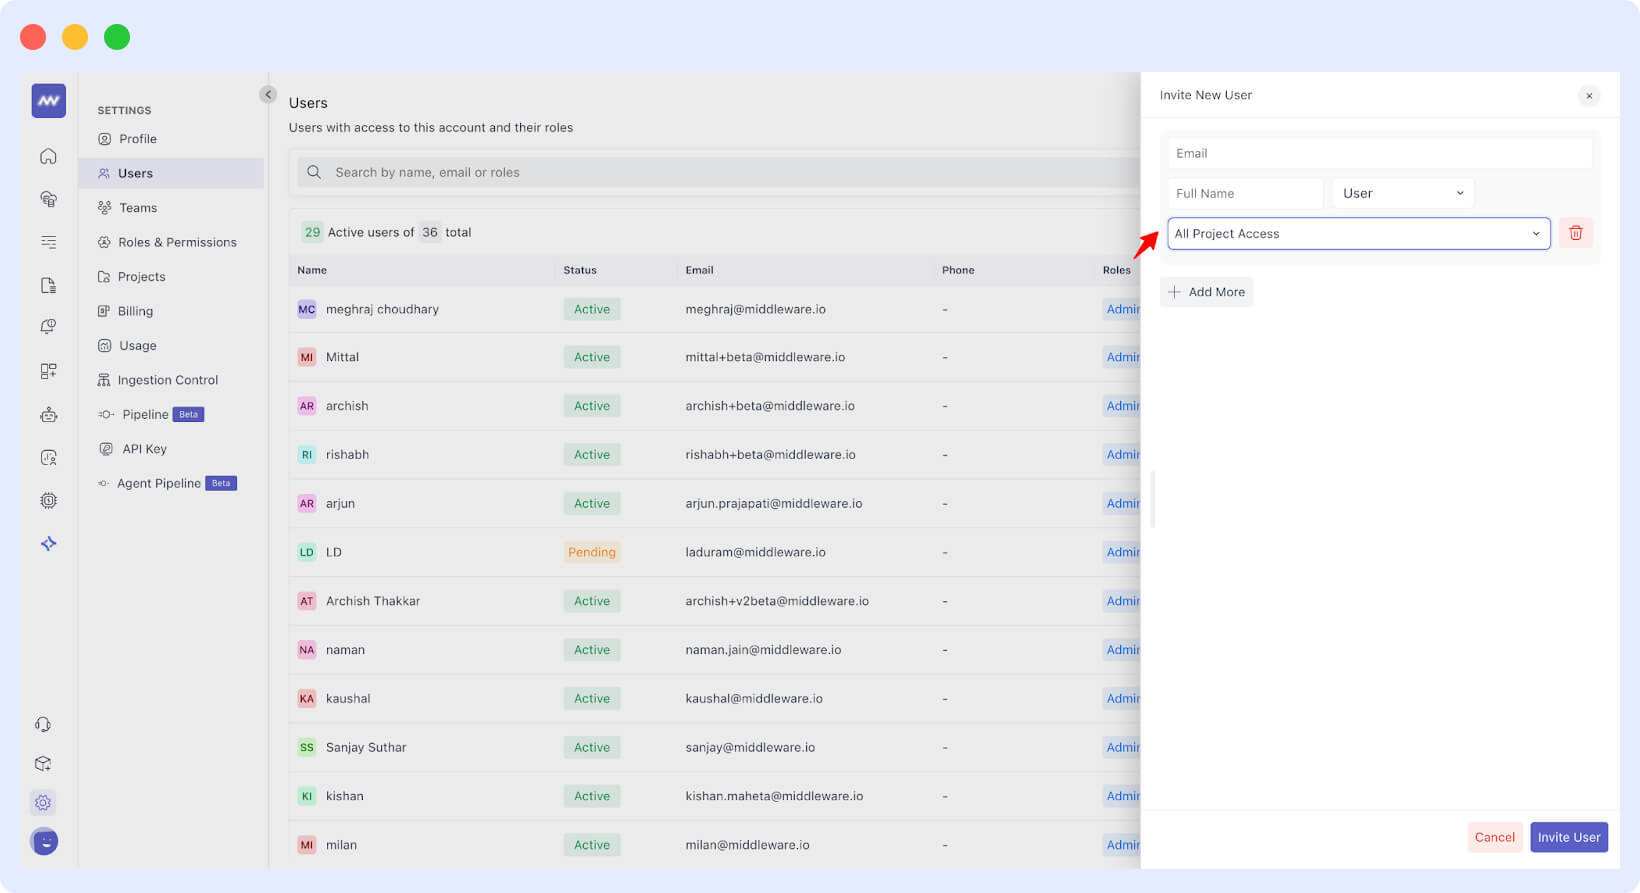
Perfect for teams managing multiple projects with different access needs.
🔐 Azure Entra ID SSO (Single Sign-On)
- Users can now log in using SSO via Microsoft Azure Entra ID.
- Admins can add users from the Identity Provider (IDP) directly — no need to send manual invitations via Middleware.
👉 View full SSO setup documentation »
🧪 Browser Test Pricing Update
- Free Tier: 10 browser test runs per month
- Pay-as-you-go: $9.99 for every 1,000 additional runs
You can now scale browser monitoring as per your usage.
🤖 Ops AI – Smarter, Safer, Cleaner
- New UI Theme: A lighter, cleaner design to help you resolve issues faster with better clarity.
- Agent-Level K8s Control:
- New toggle to enable/disable Kubernetes issue access at the agent level (enabled by default).
- Kubernetes Fix Permission Prompt:
- Ops AI now asks for explicit permission before performing any write actions for K8s fixes.
- User Attribution:
- See exactly who created a PR or approved a Kubernetes fix via Ops AI.
- Improved Event Listing:
- Kubernetes events are now grouped by object.kind for better filtering and investigation.
🔧 APM – Visibility + Performance
- Chart Improvements across all APM screens
- Automatic Profiling for Java APM – No manual setup required
- Python Support added for Google Cloud Run
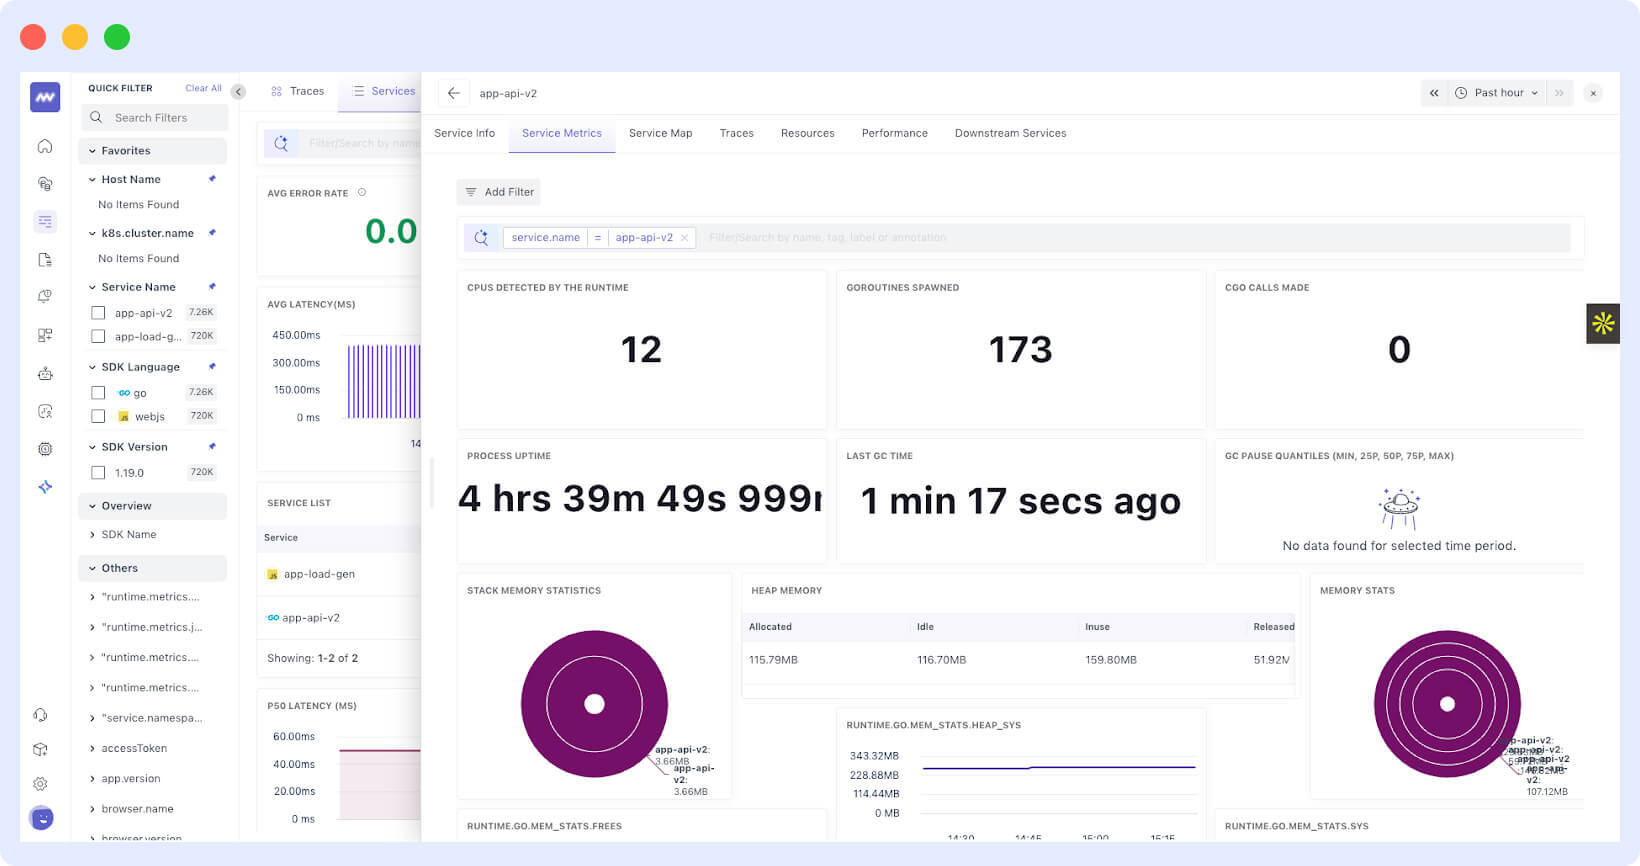
- Service Metrics Tab – Quickly jump from APM > Service to its metrics dashboard
- Trace Screen Optimizations – Reduced API calls, faster rendering, updated graphs, and new quick filters for parent/child spans
🎨 UI & UX Enhancements
- Better filter handling inside Dashboard Builder
- RUM Module – Search improvements + minor bug fixes
- Login & Signup UI – Updated with a cleaner, more modern design
That’s it for this month!
We’re continuing to build and iterate with developer-first priorities. Got feedback? Feature requests? Drop us a line at support@middleware.io. we’re listening.