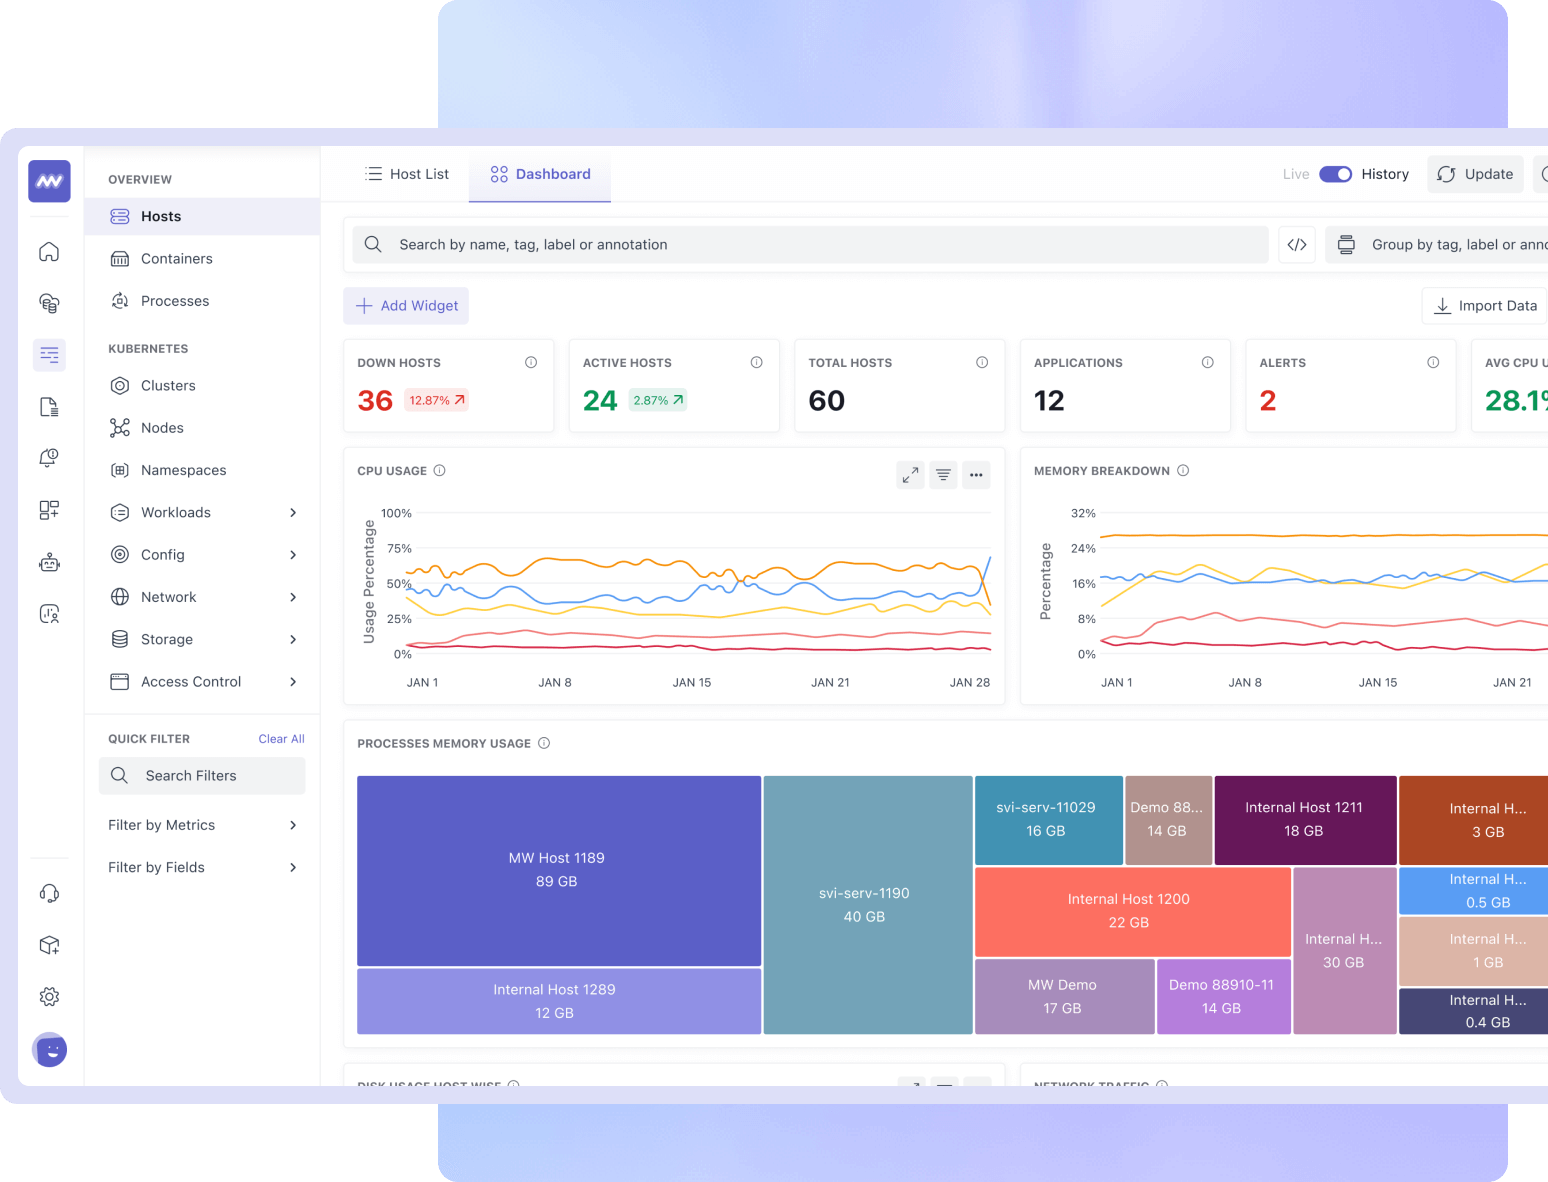
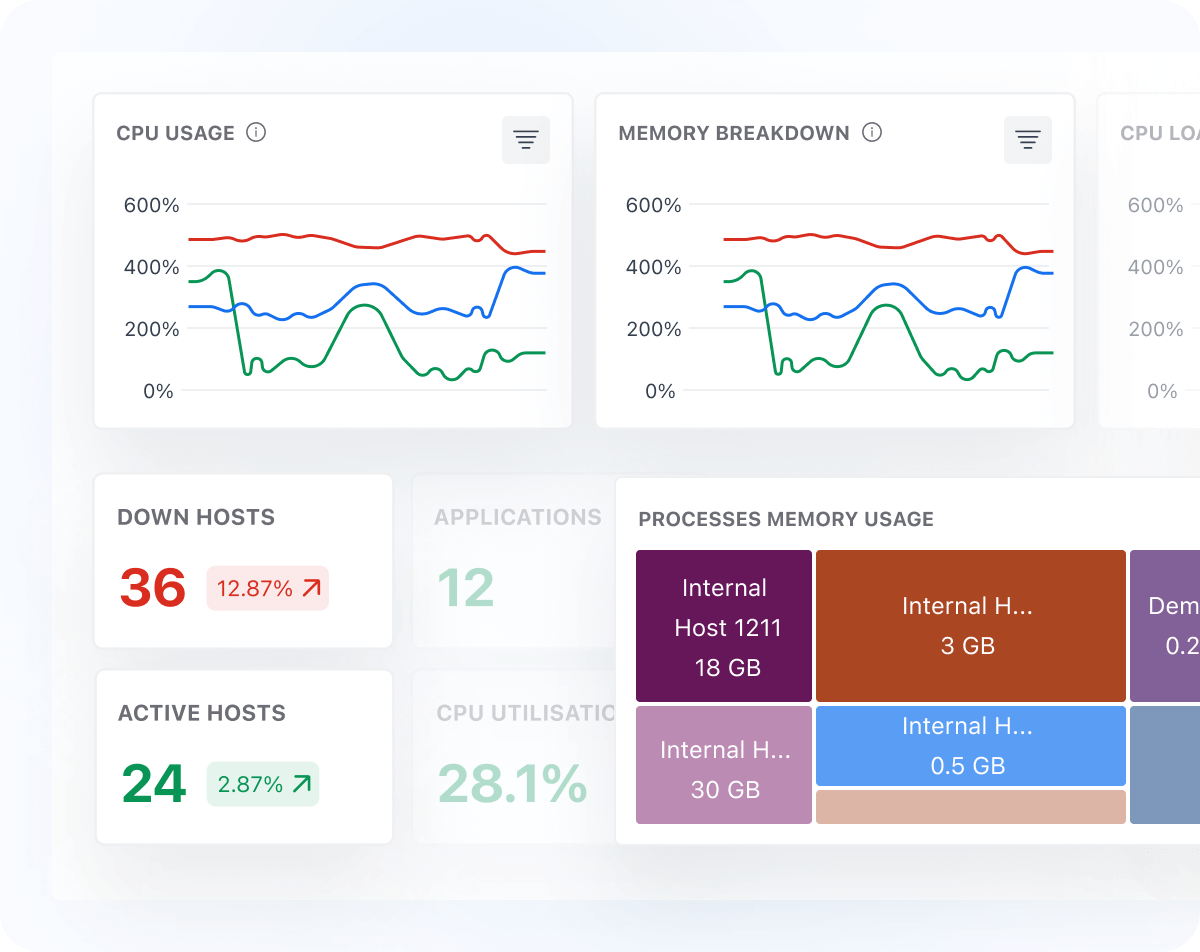
End-to-End Visibility
- Get a list of all hosts running inside your infrastructure with key metrics like CPU utilization, memory utilization, and resource status.
- Drill down from any starting point to related metrics, logs, processes, services, pods, nodes, etc.
- Quickly identify and resolve issues with one-click correlation of metrics, traces, and logs.
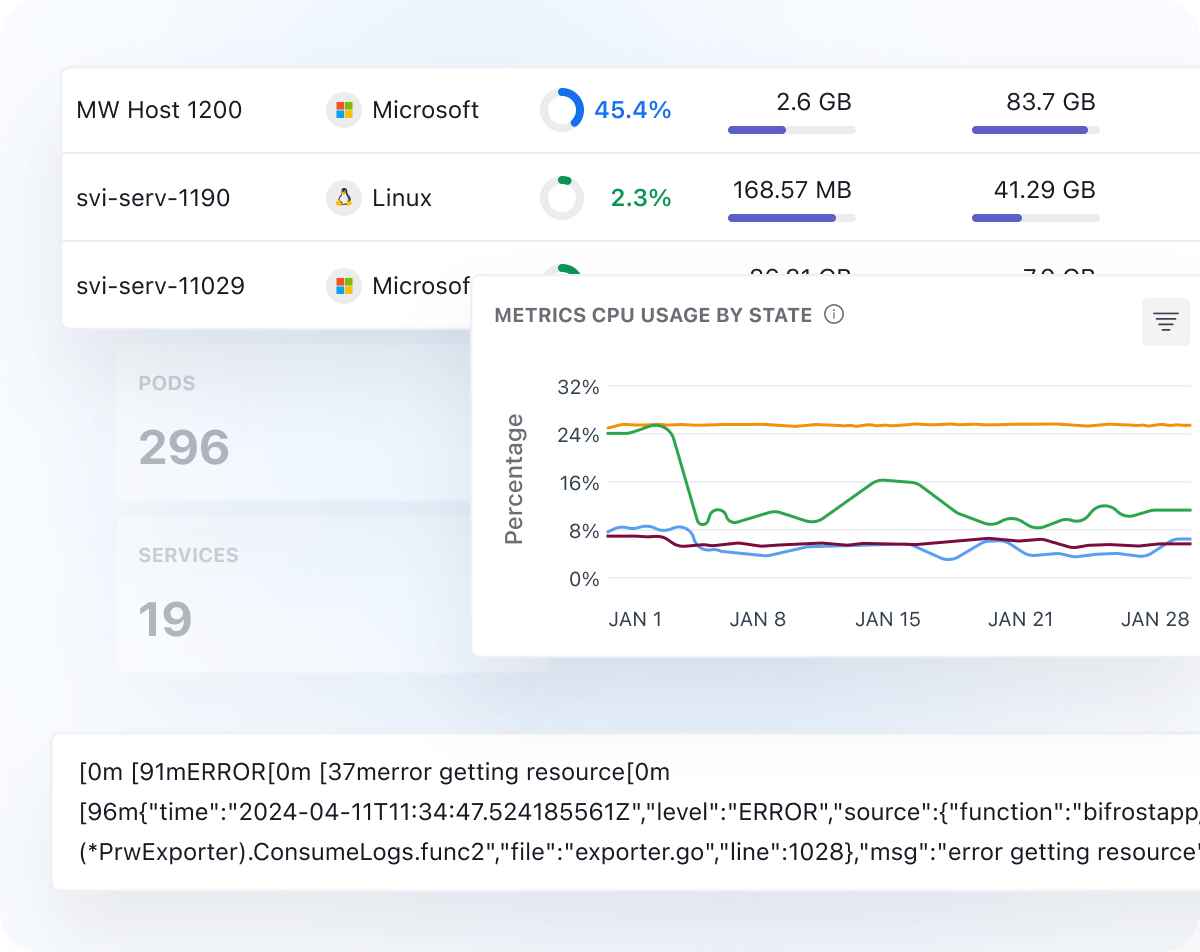
Anomaly Detection
- Detect anomalies in your infrastructure and receive real-time alerts on any issues
- View the forecast of your metrics and predict them before any issues arise that could impact the business
- The Historical View lets you explore queries over time to understand anomaly patterns
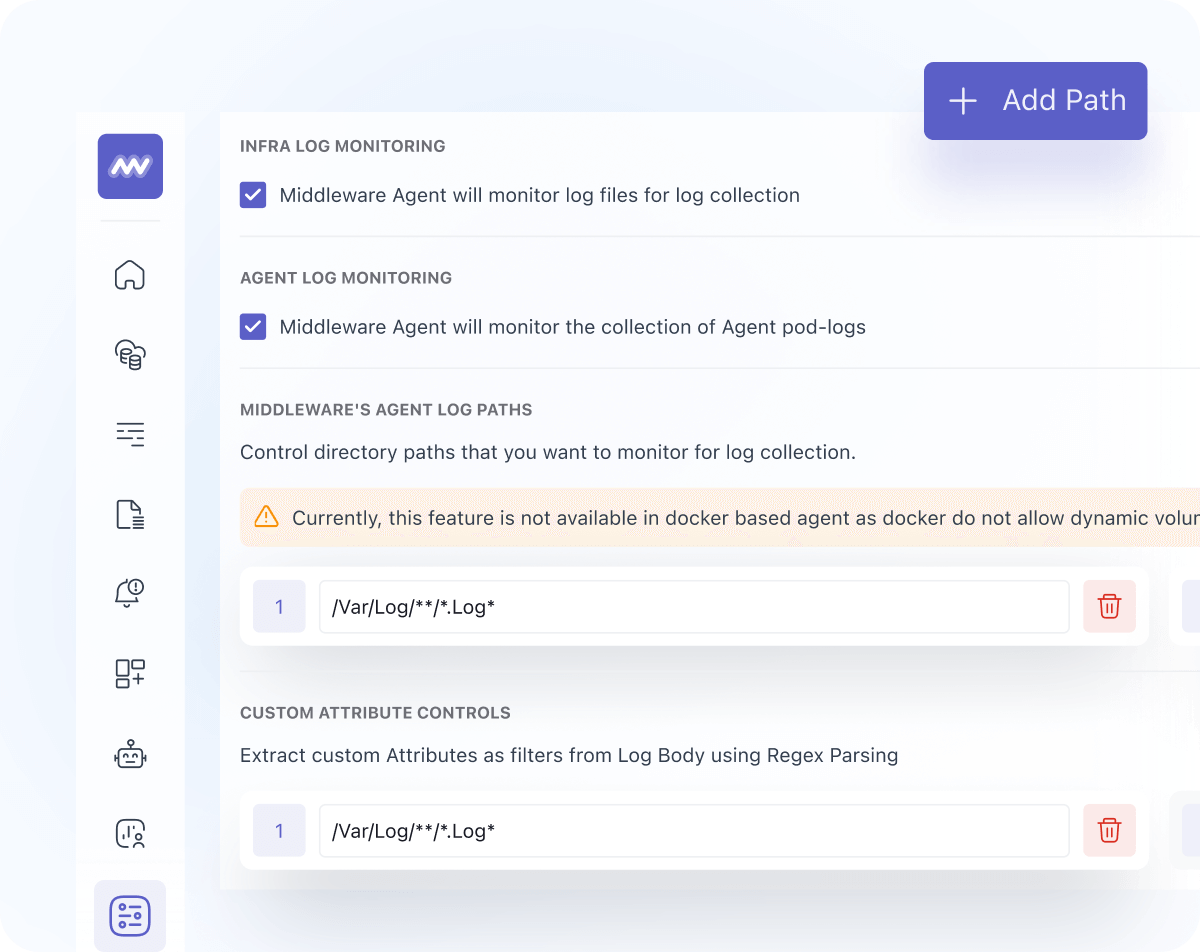
Controllable Data Ingestion
- Track the size of each collected metric and control data ingestion by toggling metrics on and off
- Reduce overall spend on observability with purposeful collection
- Collect only what matters
- Reduce metrics ingestion by removing unnecessary metrics
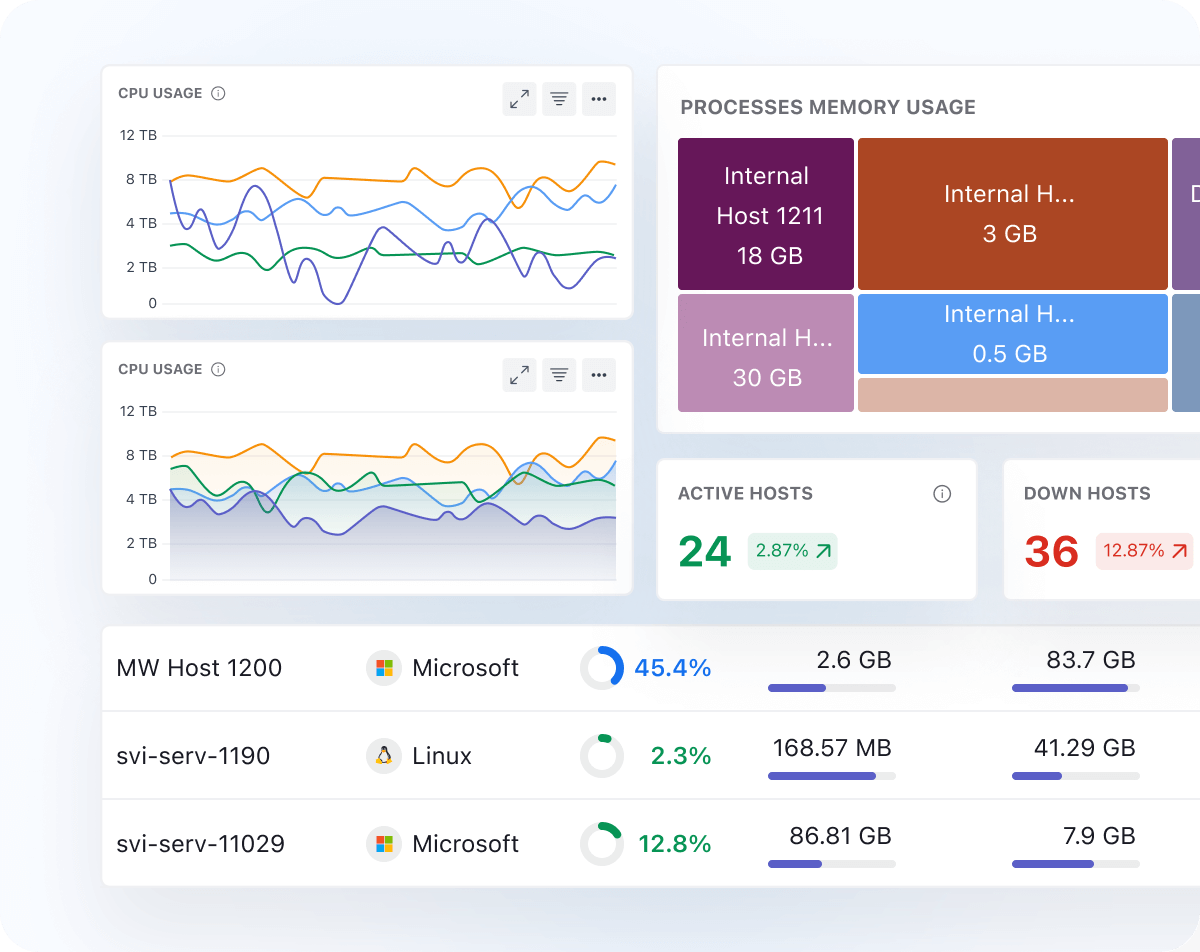
Comprehensive Dashboards
- Get default dashboards for all Infrastructure components, including VMs, On-Prem, Kubernetes Containers, Docker and Cloud-hosted machines
- Customize dashboards easily to monitor metrics that matter to your business
- Enable teams to own their experience with a user-friendly interface
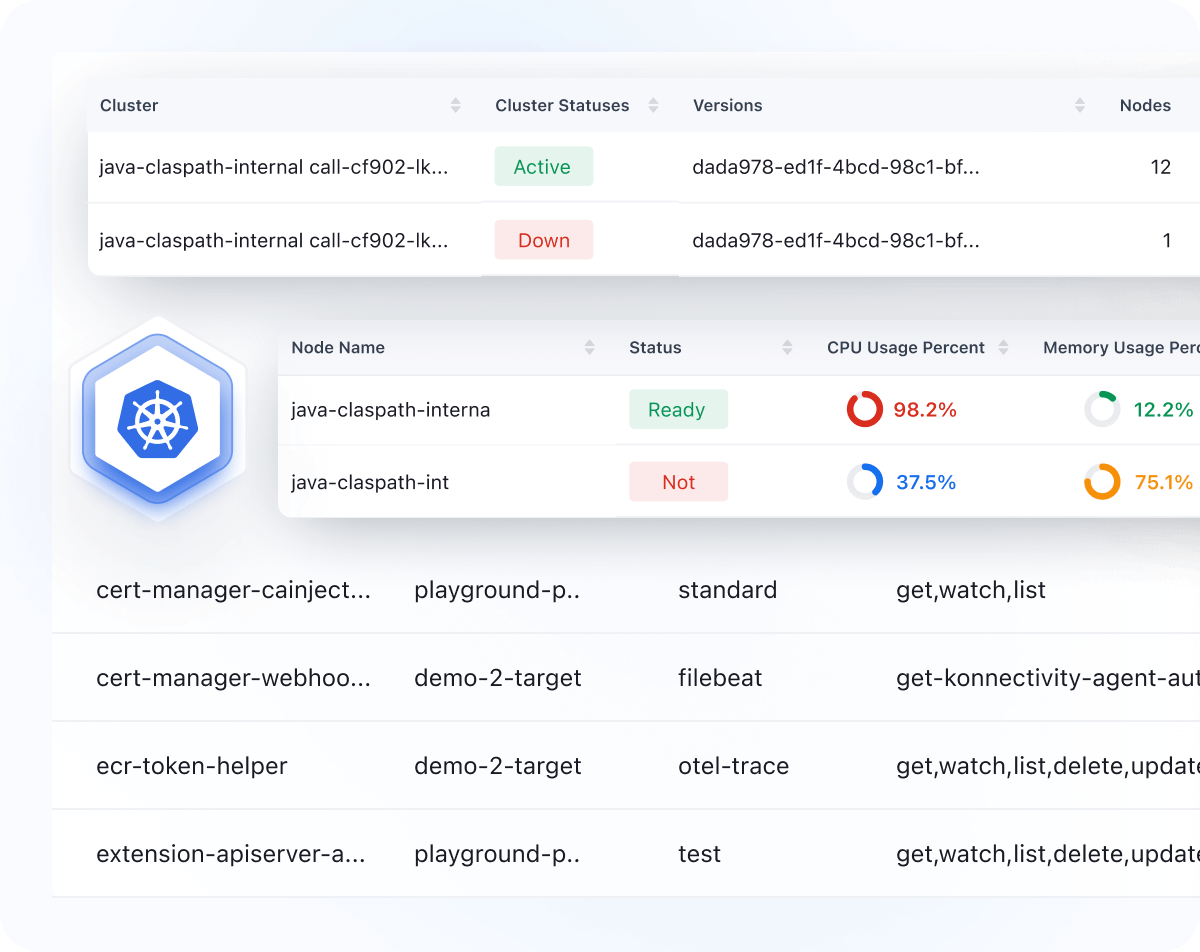
Kubernetes Monitoring
- Monitor the performance of Kubernetes clusters, nodes, and pods and drill down to their metrics
- Default dashboards to view key performance metrics for Kubernetes
- Auto-detect Kubernetes events and issues and get the solution for them with our OpsAI
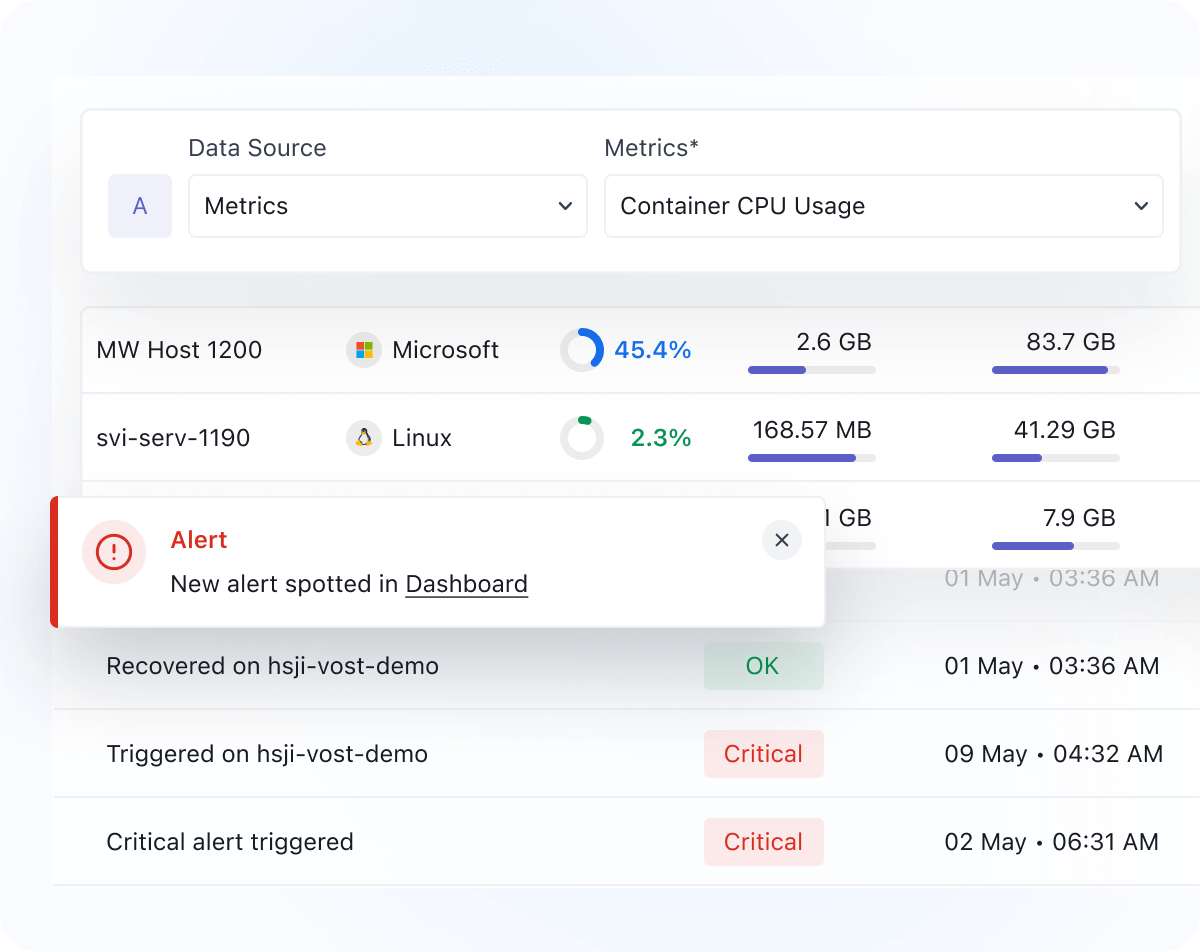
Alerts That Matter
- Create alerts on any performance metrics for your infrastructure
- Get real-time and accurate alerts to reduce mean time to detect (MTTD)
- Tailor alert thresholds and metrics according to your key performance indicators
