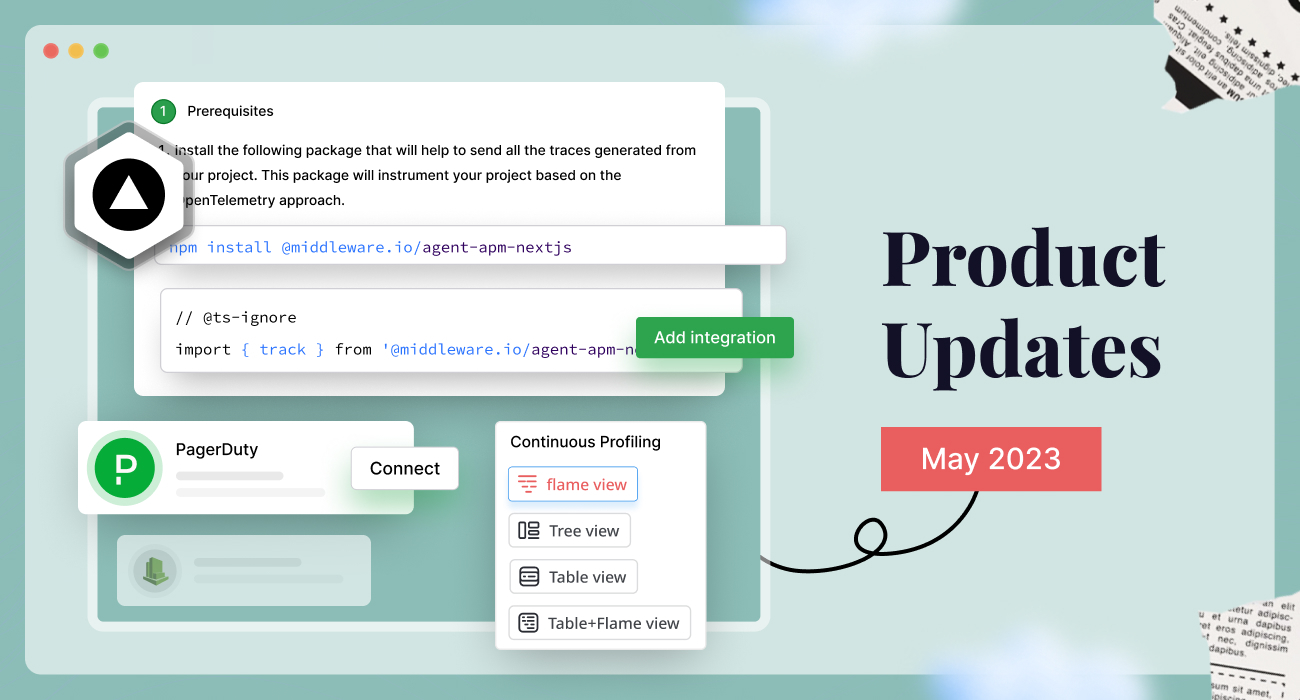
We are excited to bring the critical features, including continuous profiler, cloud watch metrics, new integrations, and UX improvements, in our latest release.
To see what’s new in May 2023, read this release along!
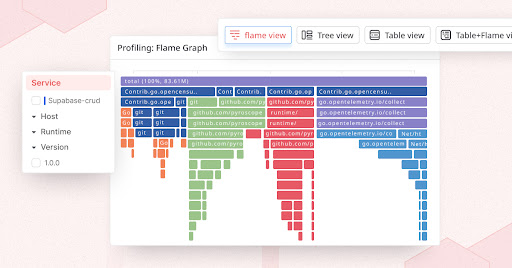
1. Continuous profiler
Gain real-time visibility into your application’s performance with our new Continuous Profiler. Visualize performance through interactive timeline graphs and flame charts, allowing you to identify bottlenecks quickly. Utilize comprehensive filters, labels and values to optimize your application performance.
Best of all, there’s no additional installation required! Start utilizing Continuous Profiling in our APM section today.
2. AWS Monitoring: AWS cloud watch metrics
With our latest AWS integration, we now support AWS monitoring. Now you can correlate and track amazon cloud watch with related metrics, traces, network data, logs, and more from across your entire stack.
We provide a default dashboard featuring all the essential metrics:
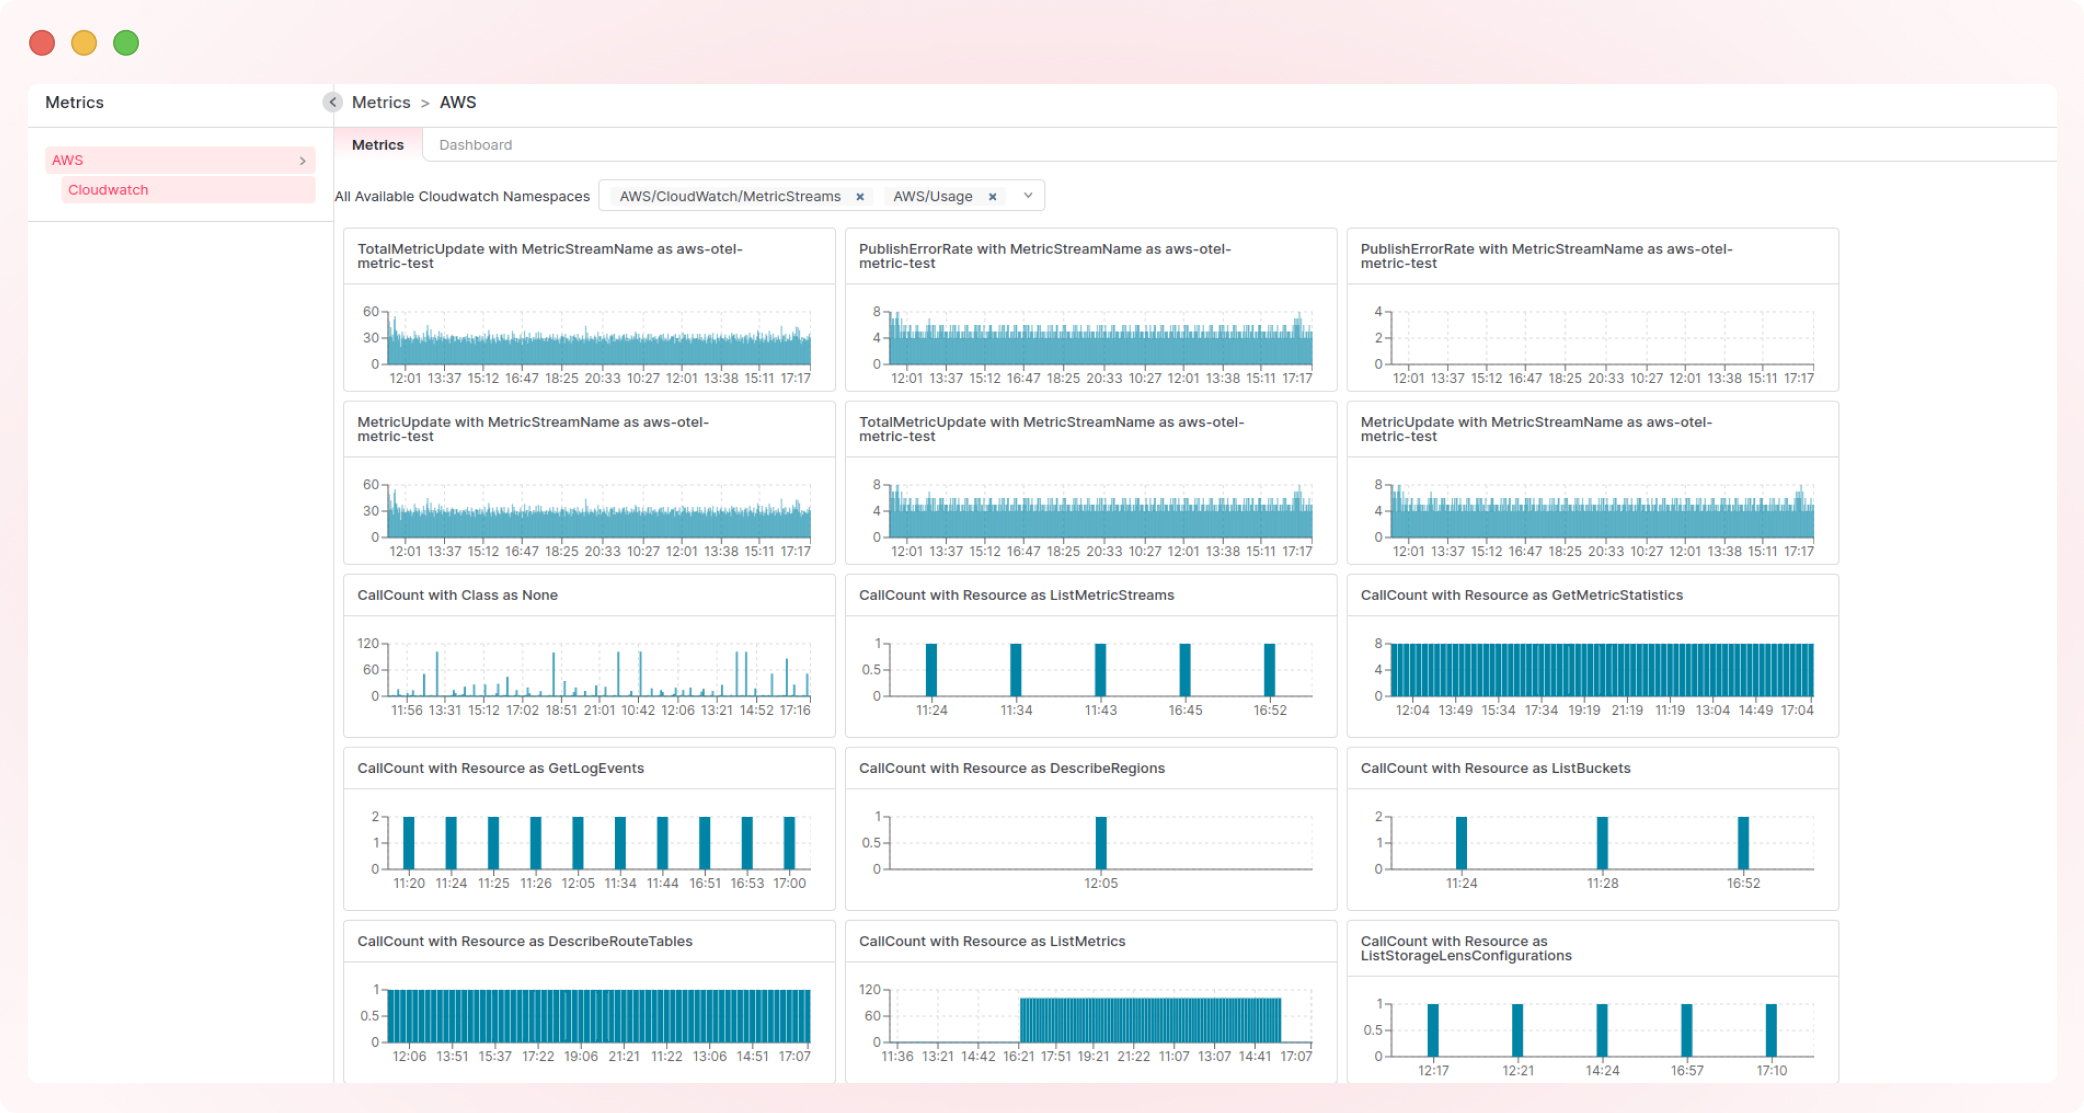
You also have the option to create a custom dashboard with AWS metrics that matter most to you.
3. Vercel Integration
Thanks to our partnership with Vercel, we now offer a monitoring solution for your Vercel serverless functions and website performance. Monitor metrics such as latency, success rate, flame graphs, traces, and API performance.
Integrating Vercel with Middleware is just a few steps away.✨ Try these steps
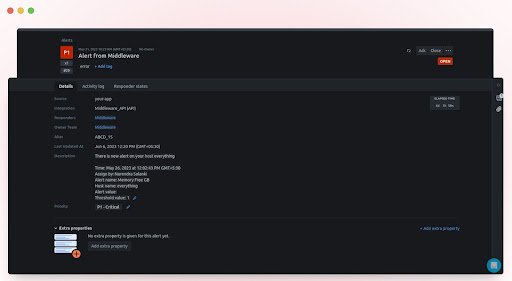
4. Pagerduty and OpsGenie Integration
In our ongoing effort to provide comprehensive alerting options, we have integrated with alert tools Pagerduty and OpsGenie.
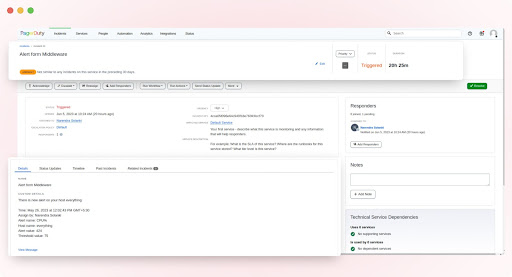
Now you can seamlessly send your Middleware alerts to Pagerduty and OpsGenie, and view all the alert details directly on your preferred alert platform.
5. UX Improvements
- We have made significant improvements to the user experience in Middleware. Enjoy a default dashboard that consolidates all your infrastructure metrics into one convenient location. Easily customize the dashboard to prioritize the data that matters most to you.
- We have added the capability to perform on-premise synthetic monitoring:
- Once you set up a synthetic test from Middleware UI and select the “on-premise” option, The Middleware agent, which is running inside your infrastructure, receives a job to perform this synthetic test from the agent itself and sends back the result to Middleware.
This way, you can test your endpoint with security and compliant concerns without performing a test from an external server.
That’s all from last month. Subscribe to our newsletter for weekly product updates and recommended reads from us.