According to data from the latest IT spending reports, SaaS companies spend 18% of their total revenue on IT. The number is 11% for Tech hosting/cloud companies. Cutting costs is no longer optional, it’s a 2025 business imperative..
The fastest way to improve profit margins? Make your IT budget work smarter, not bigger.
Observability is the key that can help businesses reduce their IT spending.
So, what is observability? How can we reduce IT Costs with observability?
Observability, as we all know, is the ability to identify a system’s internal state based on the data from its external state.
We’ll answer the second question by breaking it down into eight ways to use observability to reduce costs while improving uptime, data transparency and analytical power. Continue reading for more!
Observability and IT Costs
In 2025, enterprises face growing pressure to do more with less.
According to a recent survey by Gartner, an average enterprise will spend 7.9 percent of its IT operations and maintenance (O&M) in 2025, with an estimated 11.3 percent going toward software licenses.
That’s nearly one-fifth of the total IT spend tied up in keeping systems running, resources that could be invested in innovation, growth, or customer experience.
The good news? Observability can turn cost centers into value drivers, helping organizations optimize infrastructure, reduce expenses, and prevent expensive downtime before it happens.
“Every minute of downtime is a cost. Observability ensures you catch problems before they start costing you.”
8 Ways To Reduce Costs With Observability
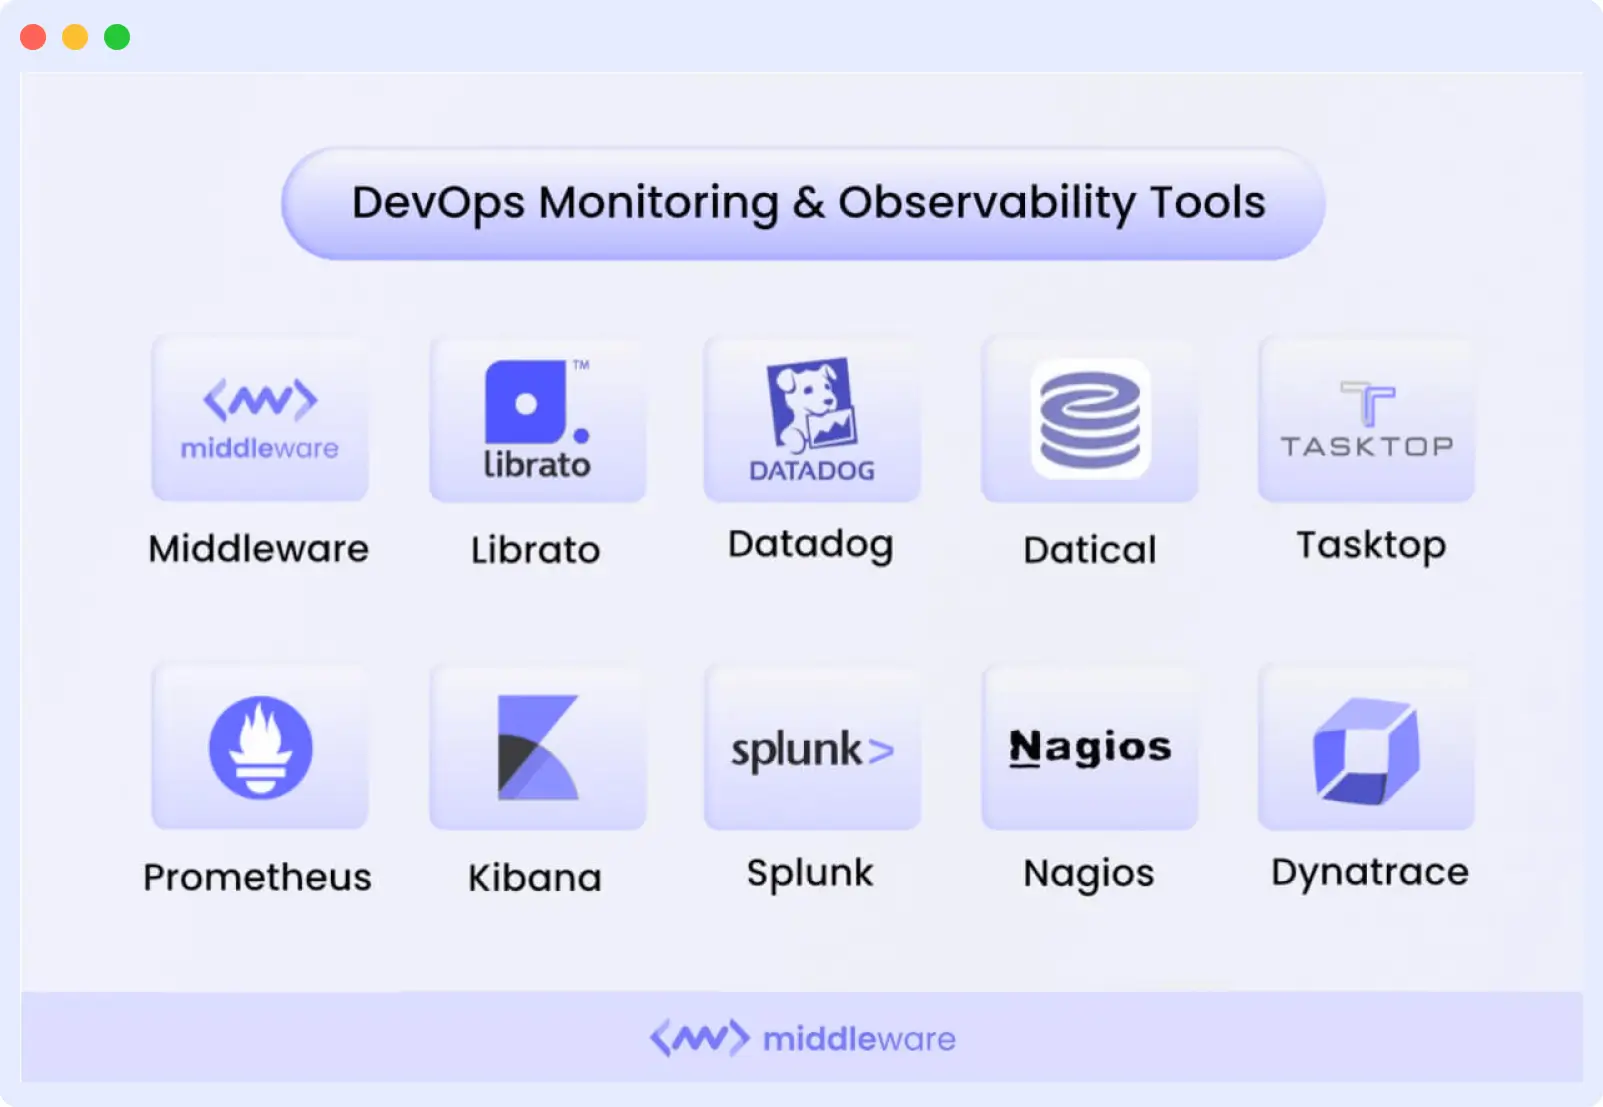
You may have heard about observability from people discussing monitoring, logging and metrics. While those are all critical parts of observability, it’s more than just the tools used to capture data.
It’s also about how you use that data to decide about your services, applications and infrastructure.
Here are 8 proven observability techniques that can help you cut unnecessary expenses and get more value from your IT investments.
1. Building a FinOps and Cost-Aware Culture
Observability isn’t just about keeping systems running; it’s about making every resource count. By using observability tools, you can quickly spot and eliminate expenses, such as unnecessary CPU, memory, or storage usage, before they impact performance or cost you money.
For example, if an application runs on a server that needs only 50% of its CPU but currently uses 100%, this could be due to an inefficient algorithm or lousy code. Identifying such issues early allows you to refactor code, optimize configurations, and prevent costly performance problems.
Every CPU cycle you don’t need is a cost you don’t have to pay.
The ability to respond quickly to changing business needs is critical for any software company. If your application stops working at any moment, it may cause huge losses for your company, your clients and partners.
For example, with observability tools, you can easily monitor how your system behaves from start to finish without writing a single line of code or restarting your app every time it crashes unexpectedly.
Observability tools can identify wasted CPU, memory, and storage saving thousands in unused cloud resources.
You can also see how long each request takes from beginning to end, so you’ll know exactly what’s going wrong if there’s any problem with an endpoint or microservice.
2. Reduce the Need for Multiple Observability Tools
Using one centralized platform for managing all your applications and infrastructure allows you to get a holistic view of the health of your entire system.
This is especially important regarding security incidents because they can happen anywhere in the system.
Once you’ve got everything in one place, you can quickly identify problems and take action before they turn into serious issues that impact customer experience or business operations.
Grafana Labs’ latest Observability 2025 report claims, “Centralized observability saves other teams from having to build their own monitoring infrastructure.”
With a single, centralized observability tool like Middleware, you can get all the data you need in one place: logs, traces and metrics.
Middleware lets you collect data from all over your stack, from microservices and containers to message queues and databases, so that you don’t have to use separate tools for each part of your application stack.
Middleware helps you reduce the need for multiple cloud monitoring tools by providing visibility into all aspects of your infrastructure. It is a powerful observability platform that offers insights into your applications, servers, containers and networks.
3. Decrease Data Storage Costs
In today’s zero-downtime world, you need to know how your systems perform and if they meet their SLAs (service-level agreements).
However, it faces a key challenge: the cost associated with handling, storing, and reading the data.
Yes, observability data is essential. But storing everything is expensive and unnecessary. That’s where Middleware’s Ingestion Control Pipeline helps you:
- Filter out unnecessary traces, logs, and spans before storage.
- Retain only the essential information that drives decisions.
- Accelerate resolution time by removing noisy data at the point of ingestion.
Observability isn’t about collecting more data, it’s about collecting the right data.
Master the art of filtering, storing, and acting on only what matters. Explore Observability’s best practices
Platforms like OpsAI go even further, using machine learning to detect issues, automate root cause analysis, and even execute fixes in a single click. This slashes MTTR, reduces manual work, and lowers infrastructure costs.
Every byte you don’t store is budget you can reallocate to growth.
Middleware only sends the necessary data, and we store it on S3/customer’s cloud storage as needed, reducing data costs by up to 10X.
Access to the correct data to the right people at the right time can help you significantly optimize your systems and reduce the chances of downtime.
4. Reduction in MTTR (mean time to respond) and MTBF (mean time between failures)
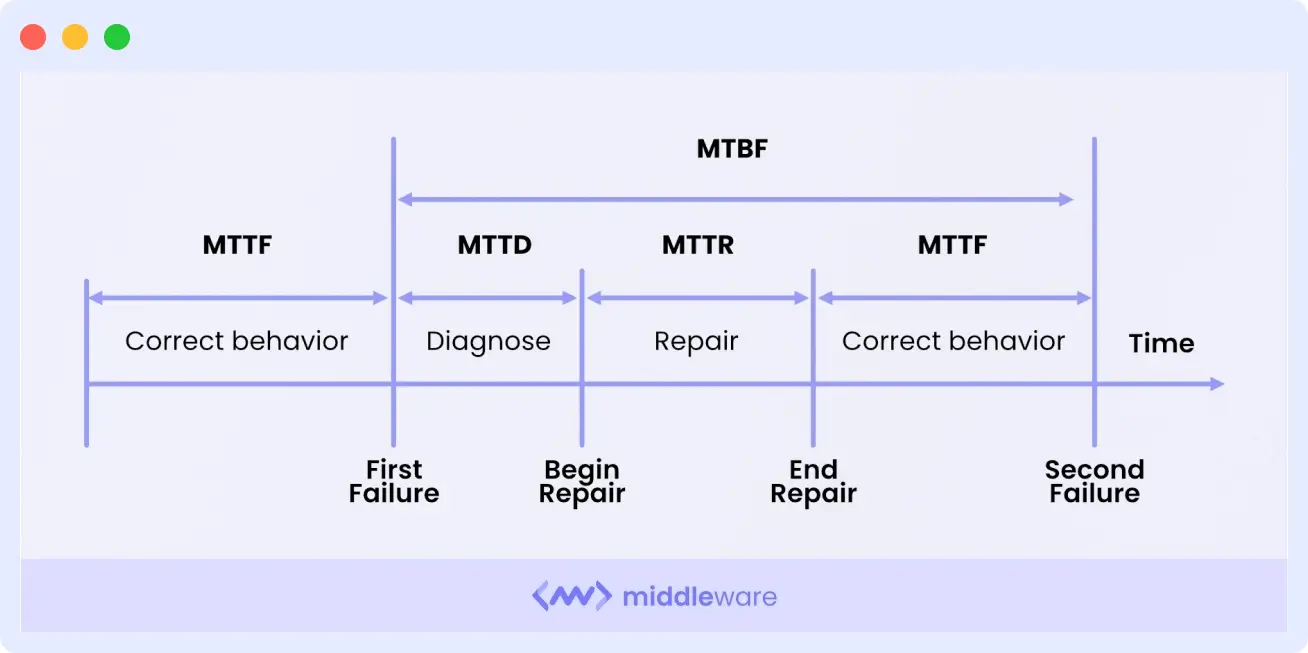
MTTR (Mean Time To Resolution) measures how long it takes for an issue to be identified, diagnosed, and fixed.
Observability tools help reduce MTTR by providing visibility into what’s happening inside your application at any given time and alerting you when something goes wrong so that you can fix it as soon as possible.
This allows you to resolve issues faster, with less downtime and fewer errors for your users.
MTBF (Mean Time Between Failures) is a measure of how often an item fails during its lifetime.
Observability tools allow you to catch failures early on so that they don’t happen again later on down the road, which means that failures are less likely to occur repeatedly throughout an application’s lifetime or across multiple instances of its deployment.
Middleware’s distributed tracing feature can help teams identify various factors like latency, response time, and errors which help them reduce MTTR and MTBF
You can reduce MTBF and increase the overall reliability of your application by catching failures early on and fixing them before they become problems.
5. Improve Uptime with Proactive Root Cause Analysis
Collecting data from multiple sources gives you a holistic view of your application’s performance. But sending all that data to an observability tool can be expensive if you’re not careful about how much data you collect and send.
With Middleware, you can filter out unnecessary metrics and focus on what truly impacts uptime.
For example:
- Use custom time series for non-critical metrics that only matter in specific scenarios.
- Send high-cardinality metrics (e.g., request latency) only when they directly affect performance.
- Avoid flooding your pipeline with metrics. Middleware doesn’t need to keep it clean and cost-efficient.
By keeping your data lean, Middleware enables faster root cause analysis, allowing your team to resolve issues before they impact customers.
The faster you find the ‘why,’ the sooner you get to 99.99% uptime.
6. Reduce Incidents, Outages and Unplanned Work
IT teams often spend up to 30% of their time on non-value-added tasks like firefighting issues. Observability changes that enable real-time visibility into your infrastructure and applications.
Reduce incidents by creating more visibility into production systems (physical or virtual). With more visibility, you can detect anomalies before they become problems.
This lets you quickly resolve issues before they impact your users or customers.
The best outage is the one your users never notice.
Reduce outages by detecting problems before they impact customers and users. By detecting issues early on, you can take action before they become a problem, such as quickly restoring a server after an outage.
7. Prepare for the Unplanned
Real-time diagnostics help you quickly identify problems as they occur.
By monitoring your systems’ performance over time, you can determine whether there is any deviation from standard behavior patterns and take action accordingly.
This will help to reduce costs associated with downtime by fixing critical bugs in production environments.
Before deploying observability tools, it’s hard to diagnose problems in real-time. For example, you might have a slow worker node or a resource contention issue.
The only way to find out is by inspecting the logs afterward. With observability tools, you can monitor your application in real-time and get visibility into your systems so you can fix issues as they happen.
This will help you avoid unplanned downtimes and increase uptime for your customers.
Similarly, if your application uses 10TB of data per month but never more than 2TB at any one time, you can limit your storage costs by storing only 2TB in S3.
🛡️ Stay Ready for Anything. Start Real-Time Monitoring with Middleware Today.
8. Utilize AI and ML to Detect Anomalies
In today’s cloud-native and distributed environments, manual monitoring simply can’t keep up. Engineering teams are flooded with logs, metrics, and traces, but often lack the bandwidth to extract meaningful insights quickly enough. AI-powered observability changes that.
By utilizing superior features like anomaly detection, teams can proactively identify uncommon spikes in data ingestion or resource utilization and regularly detect the early signs of misconfigurations, inefficiencies, or potential security threats.
Instead of reacting to incidents when they affect customers, AI surfaces those troubles in real-time, enabling faster intervention.
AI transforms observability from a passive tracking device into a clever, proactive assistant that allows maintaining systems healthy, performant, and value-driven.
In the current world in which uptime, pace, and efficiency are vital, AI-powered observability is no longer a pleasant-to-have; it’s a strategic necessity.
Key Takeaways
Observability is vital to maintaining a healthy infrastructure and reducing costs.
As we see in the above examples, where sites have suffered from downtime due to cascading errors, observability ensures that even simple changes are appropriately authorized and accounted for before implementation.
That’s what it means to keep an eye on your applications.
More and more companies are going to start pushing the envelope when it comes to increasing the visibility of their infrastructure. It’s not just important that your Apache servers are healthy.
Whether you’re operating a modern SaaS, large-scale websites, or enterprise applications, there’s no reason to lose sleep over troubleshooting that minor issue.
Middleware is here to help ensure you have all the information you need to make the best decisions. It’s never been so simple or cost-efficient. Sign up now to see it in action!
FAQs
How does observability save IT costs?
By identifying inefficient resource usage, reducing downtime, and automating issue detection, observability tools prevent unnecessary spending.
Is observability the same as monitoring?
No monitoring tells you when something is wrong; observability helps you understand why it’s bad and how to fix it.
How much can I save using Middleware?
Middleware’s ingestion control and AI-powered analytics can reduce data storage costs by up to 10x and significantly cut downtime-related losses.
Can small businesses benefit from observability?
Yes, observability improves efficiency and reduces unexpected infrastructure costs for companies of all sizes.
📚 Related Reads on Our Blog
- Observability vs Monitoring: Key Differences, Use Cases & How They Work Together
- Observability 2.0: The Next Generation of System Visibility
- How to Cut Cloud Costs with Smart Monitoring