TL;DR
- Observability is the ability to understand why a system is failing by analyzing logs, metrics, traces, and continuous profiles in real time, not just alerting that something broke.
- It differs from monitoring because it lets engineers investigate failures they never predicted, without writing new code or building new dashboards.
- The four core telemetry signals are logs, metrics, traces, and continuous profiling.
- Teams using observability reduce MTTR by 25%+ and cut developer debugging time from 50% to under 10%.
- AI-powered observability is now standard for cloud-native engineering teams in 2026.
What is observability?
Observability is the ability to understand a system’s internal state by analyzing the telemetry it produces, including logs, metrics, traces, events, and continuous profiles. It answers why a system is failing, not just that it failed, letting engineers ask new questions about live system behavior without shipping new code.
In engineering communities, observability is often shortened to o11y, where 11 represents the letters between the first “o” and last “y.”
“The proliferation of microservices and distributed systems has made it harder to understand real-time system behavior a critical requirement for troubleshooting problems.”
Laduram Vishnoi, Founder and CEO of Middleware.
Observability combines practices and tools that help you:
- Monitor system performance end-to-end
- Debug applications and infrastructure efficiently
- Detect anomalies before they cause downtime
- Align reliability with CI/CD pipeline processes
Observability by the numbers (2026)
Based on 407 global engineering leaders surveyed in the Middleware State of Observability 2026 report:
- Only 7.4% of engineering organizations operate from a single unified observability platform
- 80%+ manage two or more tools simultaneously, creating context switching, inconsistent alerting, and duplicated instrumentation
- 89.4% struggle with tool fragmentation across multi-cloud environments
- 73.5% of teams spend 2 to 10 hours every week on reactive root cause analysis
- 59% flag lack of a unified solution as the industry’s primary unmet need
- 63.6% would probably or definitely switch tools for better customization features
- Improving MTTR by even 20% recovers more value than the annual cost of most observability platforms
A brief history of observability
Observability originates in control theory, where scientists inferred internal system behavior using external signals.
1990s: Siloed Monitoring. Organizations deployed separate tools for servers, networks, and uptime, creating fragmented visibility.
2000s: APM. Tools like AppDynamics and Dynatrace introduced transaction-level visibility, shifting focus from infrastructure to application performance.
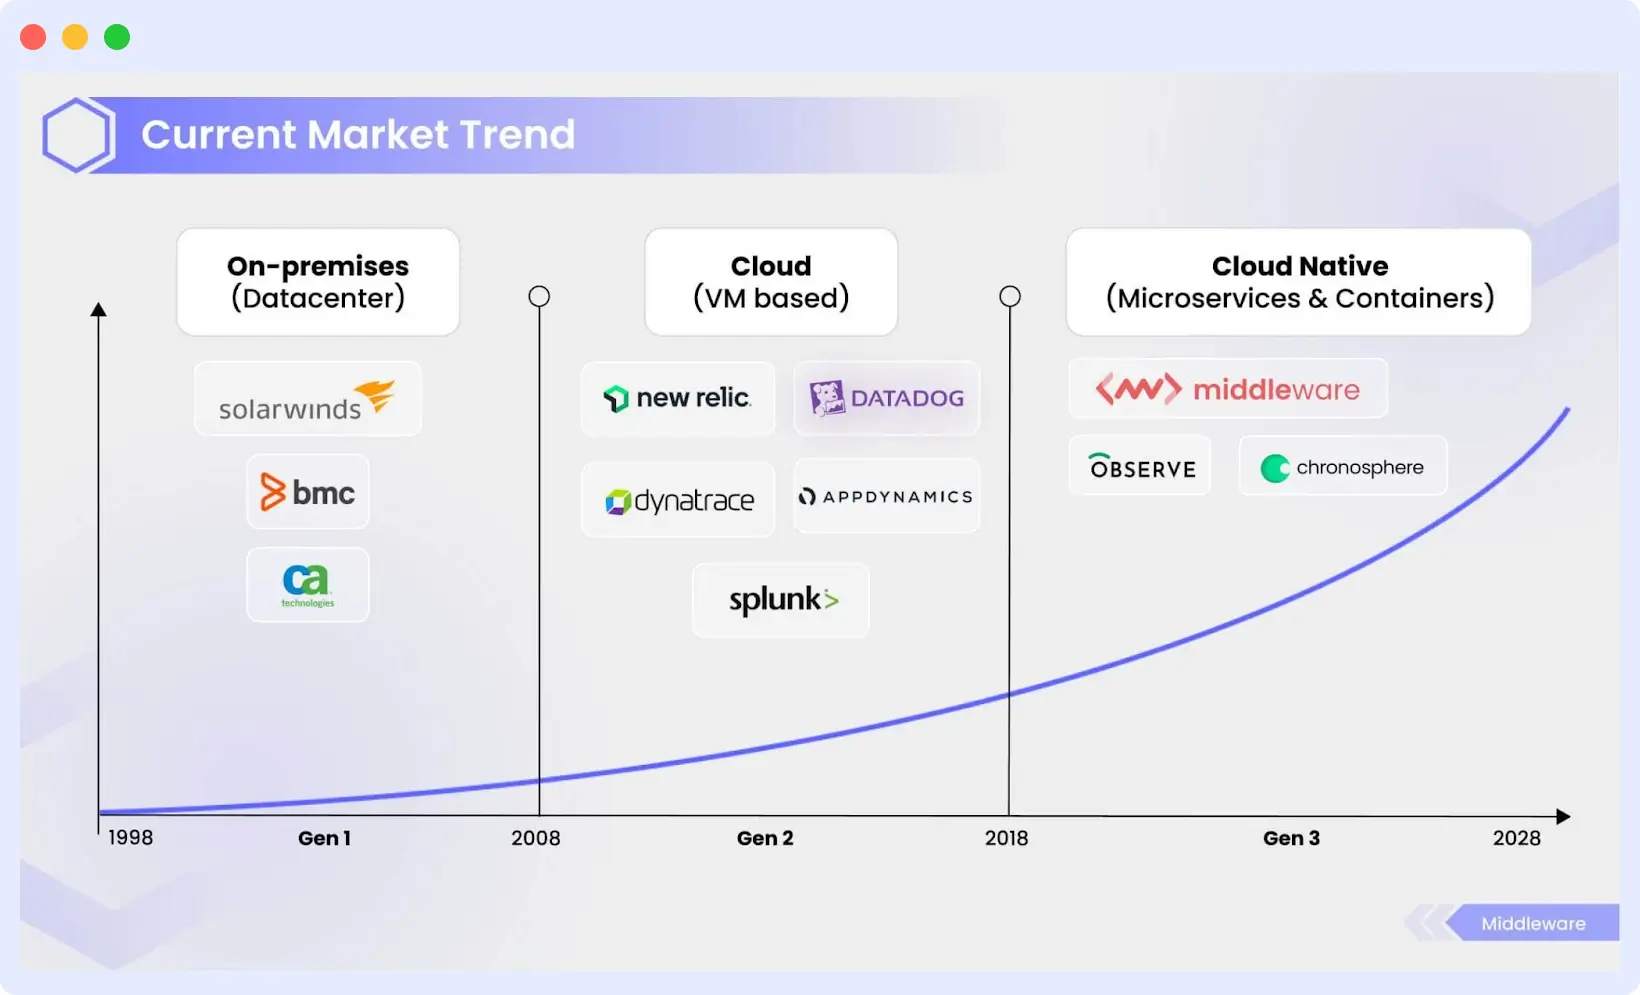
2010s: Cloud-Native Complexity. AWS and Azure launched native tooling. Datadog unified logs, metrics, and traces. Prometheus democratized telemetry.
Today: AI-Assisted Observability. Modern platforms use AI to automate anomaly detection and root cause analysis. Engineering teams are shifting from “detect and react” to “predict and prevent.”
“Each decade has transformed how observability is expected to function from on-prem to cloud to cloud-native.”
Laduram Vishnoi, Founder and CEO of Middleware.
“Across high-performing engineering organizations, observability maturity strongly correlates with faster deployment cycles and shorter incident recovery times.”
How does observability work? The four telemetry signals
Observability operates on four primary telemetry signals. By collecting and correlating these, teams bridge the gap between understanding what is happening and why it is happening.
1. Logs
Logs are timestamped records of individual events inside an application. They are the most granular signal and are used to diagnose unusual behavior in specific components.
Three types: plain text (unstructured), structured (JSON), and binary (used for replication and journaling).
Start collecting and monitoring logs from any environment in 60 seconds. Get started!
2. Metrics
Metrics are numerical values describing service or component behavior over time, including timestamps, names, and values. They provide a broad overview of system health but cannot explain the root cause of issues on their own.
Metrics offer a comprehensive overview of system health and performance across your infrastructure. However, metrics have limitations. Though they indicate breaches, they do not shed light on underlying causes.
3. Traces
Traces follow a request’s full journey through a distributed system, recording every service interaction from start to finish. They make it easier to identify latency issues, pinpoint bottlenecks, and understand service dependencies.
They help analyze request flows and operations encoded with microservices data, identify services causing issues, ensure quick resolutions, and suggest areas for improvement.
4. Continuous profiling
Continuous profiling provides real-time visibility into CPU usage, memory allocation, and code-level performance. It identifies exactly which functions consume the most resources and where memory is being leaked, down to the line of code.
Modern observability platforms increasingly treat continuous profiling as the fourth core telemetry signal, especially for cloud-native and high-scale systems.
👉 To learn more about how continuous profiling works and why it’s becoming essential, read our detailed guide on Continuous Profiling.
Unified observability
The real power emerges when all four signals are consolidated into a single platform. According to the Middleware Observability Forecast 2026, only 7.4% of teams achieve this today. Teams with unified telemetry consistently report faster MTTD, faster MTTR, and fewer high-impact outages than those operating siloed tools.
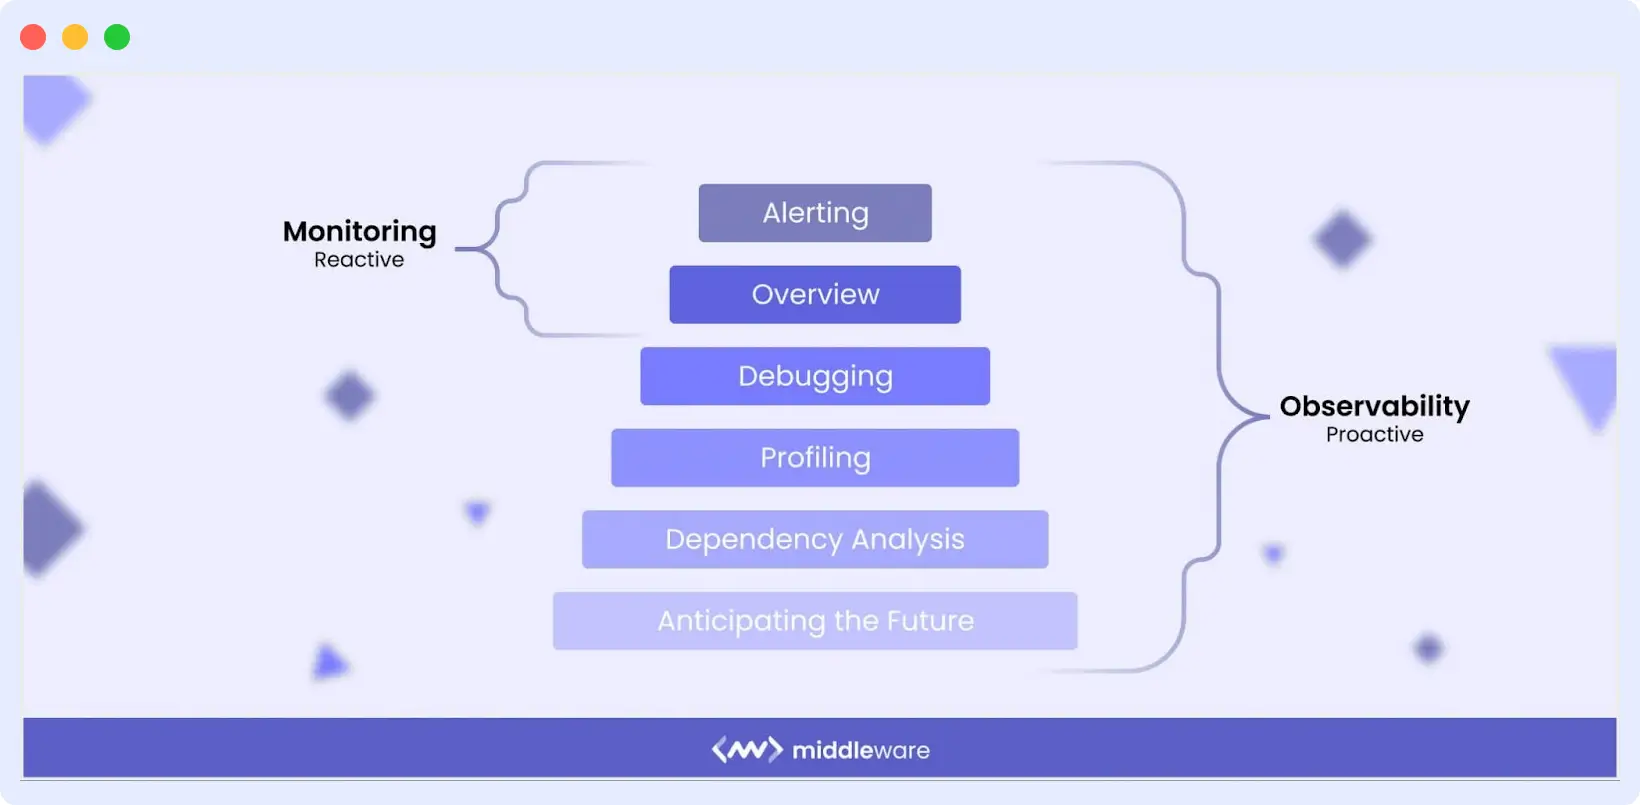
Observability vs Monitoring
Monitoring tells you something broke. Observability tells you why it broke. Monitoring relies on predefined dashboards and threshold-based alerts for failure modes you anticipated in advance. Observability handles the “unknown unknowns”: failures and edge cases you could not have predicted, without writing new monitoring code.
| Monitoring | Observability | |
|---|---|---|
| Primary question | What is broken | Why it is broken |
| Requires predefined alerts | Yes | No |
| Handles unknown failures | No | Yes |
| Suited for distributed systems | Partially | Yes |
| Root cause analysis | Limited | Deep and correlated |
| Core signals | Metrics, uptime | Logs, metrics, traces, profiles |
| Approach | Detect and react | Predict and prevent |
Nearly 64% of organizations report a 25%+ MTTR improvement after adopting observability practices.
👉 Explore our detailed guide on Observability vs Monitoring to learn more.
Why is observability important for business?
Over 90% of enterprises now operate multi-cloud environments, dramatically increasing operational complexity. Traditional monitoring tools cannot keep pace with dynamic, distributed architectures.
What is Business Observability? Business observability connects technical telemetry directly to business outcomes: revenue impact, conversion rates, and cost-per-outage metrics. Teams using it can answer: “How much did this latency spike cost us?” or “How many users abandoned checkout because of this API error?
The Middleware 2026 survey found that the hourly cost of downtime for 41.8% of organizations ranges from $1K to $10K per hour, with 29.2% seeing $10K to $50K per hour. Teams spending 6 to 10 hours weekly on RCA lose approximately $600 to $1,500 in direct labor per engineer per week.
The observability market is projected to reach USD 4.1 billion by 2028.
The benefits of observability
1. Faster incident detection and resolution
Observability correlates logs, metrics, traces, and profiles to pinpoint root causes faster, reducing MTTR and MTTD. Organizations adopting mature observability practices frequently report MTTR improvements of 25% or more.
2. Improved system reliability and uptime
Real-time visibility lets teams resolve issues before they escalate. Instead of reacting to failures, engineers proactively stabilize infrastructure and improve Mean Time Between Failures (MTBF).
3. Higher developer productivity
Developers often spend a significant portion of their time debugging production issues. Observability reduces this burden by delivering actionable insights instead of fragmented alerts.
“Developers spend nearly 50% of their time debugging. Observability has the potential to bring that down to nearly 10%.”
Sam Suthar, Founding Director at Middleware
With faster troubleshooting, teams can focus more on innovation and shipping features rather than firefighting.
“I don’t want my developers to stay up all night to try to fix issues. That’s a waste of everyone’s time. Middleware helped us become faster. It saves at least one hour of my time every day, which I can dedicate to something else.”
Akshat Gupta, Trademarkia.
With AI-powered dashboard builders, engineers can generate dashboards from plain-English prompts instead of spending hours on manual configuration.
For example: “Build a dashboard for my Kubernetes clusters in US-East that correlates memory leaks with recent GitHub deployments.”
Within seconds, teams gain a unified view of relevant telemetry, reducing setup time and enabling faster troubleshooting. Instead of spending hours configuring visualizations, developers can focus on identifying root causes and improving system reliability.
4. Lower Cloud and Monitoring Costs
The 2026 Observability Forecast found that 26.35% of teams cite high costs of scaling as their biggest challenge. Observability pipelines that filter low-value data and route signals to the right storage tiers can reduce observability spend by 60 to 80%.
See how Middleware helped Generation Esports slash observability costs & improve MTTR by 75%!
5. Stronger security visibility
Continuous telemetry analysis makes it easier to detect unusual activity and vulnerabilities faster. 46.44% of teams in the Middleware 2026 survey now use observability for security and compliance monitoring.
6. Better customer and user experience
Real User Monitoring (RUM) lets teams detect latency, errors, and frontend bottlenecks from the user’s perspective, before customers are impacted. Hotplate, a popular food delivery platform, achieved a 90% reduction in errors after implementing Middleware’s observability solution.
7. AI-Ready infrastructure
As AI-driven applications grow, observability is essential for monitoring model behavior, infrastructure usage, and LLM performance.
👉 Learn more about LLM Observability.
“Teams rarely struggle with observability because of tooling they struggle because they collect vast amounts of telemetry without defining what healthy system behavior looks like. Effective observability begins with clarity, not volume.”
How to implement observability (step by step)
Effective observability is not about collecting more data. It is about collecting the right data, correlating it correctly, and defining what healthy system behavior looks like before problems occur.
Step 1: Instrument using open standards. Use OpenTelemetry to add vendor-neutral instrumentation to your services. This prevents vendor lock-in from the start.
Step 2: Define healthy baselines first. Establish baselines for your four golden signals: latency, traffic, error rate, and saturation. The 2026 survey found 54.1% of teams cite dashboard and alert configuration as their top setup challenge, largely because teams alert before they have defined normal.
Step 3: Consolidate signals into one platform. Only 7.4% of organizations operate from a single unified observability platform. Consolidating reduces context switching, inconsistent alerting, and duplicated instrumentation, the three primary causes of the MTTR friction loop.
Step 4: Alert on symptoms, not thresholds. Configure alerts based on user-facing symptoms such as elevated error rates and latency spikes, not raw CPU or memory thresholds. This reduces alert fatigue while keeping focus on what affects users.
Step 5: Add continuous profiling. Once logs, metrics, and traces are in place, continuous profiling completes code-level visibility, identifying the exact functions causing performance degradation.
Ready to implement? Get Started Free with Middleware — no credit card required.
Real-world observability examples from high-scale engineering teams
Here are global companies showing top observability strategies, each designed for their size, systems, and customer experience goals.
1. Netflix: chaos engineering at scale
Netflix uses observability alongside chaos engineering to intentionally test system failures, identifying weaknesses before users are impacted.
Key takeaway: observability is not just for monitoring but for proactively testing failure tolerance.
2. Meta (formerly facebook): high-scale distributed tracing
Meta combines open-source and proprietary tooling to monitor highly distributed services in real time, maintaining performance for billions of users.
Key takeaway: Unified visibility across complex global architectures is a requirement, not a luxury.
3. Uber: real-time system-level insights
Uber depends on real-time telemetry to maintain uptime and accuracy across millions of rides. Observability allows teams to quickly detect anomalies, trace requests, and ensure platform stability during peak demand.
Key takeaway: Real-time visibility is critical for systems where delays directly impact customer experience.
4. Airbnb: Optimizing the Guest Experience
Airbnb uses observability to monitor service health, detect booking flow issues, and resolve performance bottlenecks before they affect hosts or guests. This proactive approach helps maintain trust in their platform.
Key takeaway: Observability directly influences customer satisfaction and revenue, improves user experience, and solves system issues before they impact bookings.
Can AI make observability better?
AI-powered observability automatically identifies patterns, anomalies, and probable root causes from large volumes of telemetry, reducing the manual effort of debugging.
According to the Middleware 2026 Observability Forecast, the top AI investments engineering teams want are:
- Anomaly detection: 59.46%
- Automated incident summaries: 51.35%
- Predictive alerts: 44.47%
- Dashboard generation: 35.14%
- SRE co-pilot / agent: 30.47%
The adoption approach most teams prefer is incremental: start with anomaly detection and incident summaries, build an evidence base, then expand toward predictive alerts and SRE agent autonomy. 48.3% of teams remain cautious about full SRE autonomy, not due to technophobia but appropriate caution toward systems making consequential decisions about production infrastructure.
“AI is ready to help but trust must be earned, not assumed. Teams will adopt automation incrementally, anchored in accuracy, security, and human oversight.”
Laduram Vishnoi, CEO and Founder of Middleware
The emergence of Generative AI is pushing this further. Advanced models can surface relevant telemetry signals, highlight risk areas, and recommend remediation steps.
What is AI observability?
AI observability is the practice of monitoring AI models and LLM-powered systems using telemetry specific to AI workloads, including token usage, inference latency, response quality, model drift, and hallucination rates. Traditional observability tools track deterministic systems where identical inputs produce identical outputs. AI systems are probabilistic, requiring AI-specific telemetry layers on top of the standard three pillars.
Observability challenges in 2026
Tool sprawl and the unification gap
The Middleware 2026 survey found that only 7.4% of organizations operate from a single unified platform. Over 80% manage two or more tools simultaneously. The consequences: context switching between dashboards, inconsistent alert configurations, and duplicated instrumentation, all driving longer MTTR. When asked what needs improving, 59% of teams flag lack of a unified solution as the industry’s primary unmet need.
Rising costs
Nearly 80% of companies reported pricing or billing challenges with observability vendors. Telemetry without a strategy becomes expensive. Organizations need platforms with transparent pricing and flexible ingestion strategies.
Data overload and alert fatigue
54.1% of engineering teams cite dashboard and alert configuration as their top setup challenge. When every signal triggers an alert, critical insights get buried in noise, slowing response times and increasing storage costs.
From correlation to causation
Connecting technical signals to real business outcomes remains one of the toughest observability challenges. 73.5% of teams still spend 2 to 10 hours per week on reactive troubleshooting, at a direct labor cost of $600 to $1,500 per engineer per week.
The future of observability
The Middleware 2026 Observability Forecast surveying 407 global engineering leaders confirms the industry is at an inflection point: whoever delivers true full-stack coverage without compromise will gain a lasting market advantage.
Key trends shaping the next phase:
AI-Native Observability. AI-driven systems detect anomalies earlier, automate root cause analysis, and surface actionable insights, helping teams move from reactive troubleshooting to predictive operations.
Natural Language Interfaces. Observability platforms powered by LLMs allow engineers and non-technical stakeholders to query system behavior conversationally, lowering the barrier to insight.
Observability for AI-Driven Systems. As AI-generated code and autonomous agents proliferate, organizations need observability architectures that handle probabilistic, non-deterministic workloads.
Consolidation as a Priority. The next generation of observability leaders will not be defined by how many tools they run, but by how intelligently and efficiently they consolidate their operational visibility.
Explore the complete Middleware State of Observability 2026 Report
Middleware observability platform
Middleware is a full-stack cloud observability platform that consolidates metrics, logs, traces, and events into a single timeline, with AI-powered root cause analysis, an AI dashboard builder, and LLM observability built in.
Many businesses have seen a 10x reduction in observability costs and a 75% improvement in MTTR after switching to Middleware.
“Middleware has proven to be a more cost-effective and user-friendly alternative to New Relic, enabling us to capture comprehensive telemetry across our platform. This improved our operational efficiency, service delivery, and accelerated incident root cause analysis.”
John D’Emic, Co-Founder and CTO at Revenium.
FAQs
What do you mean by observability?
Observability is the ability to understand a system’s internal state by analyzing the data it produces, including logs, metrics, traces, and events. It differs from monitoring because it lets teams investigate failure modes they never predicted, without writing new code. In distributed systems, observability is the primary method engineering teams use to detect anomalies, identify root causes, and maintain reliability. The term is abbreviated as o11y in engineering communities.
What is Cloud Observability?
Cloud observability is the practice of monitoring, analyzing, and understanding cloud-native systems in real time using logs, metrics, and traces. It is designed for dynamic architectures including microservices, containers, serverless functions, and multi-cloud environments, where traditional monitoring tools fall short.
Why is observability important in modern systems?
Observability is important because modern cloud-native systems are too complex for traditional monitoring. Monitoring tells you a threshold was breached. Observability tells you why, which service caused it, when it started, and which downstream systems are affected. Organizations using observability reduce MTTD and MTTR by 25% or more on average.
What are the three pillars of observability?
The three pillars are logs, metrics, and traces, collectively called telemetry data. Logs record individual events with timestamps. Metrics capture numerical values like error rates and latency over time. Traces follow a request’s full journey through a distributed system. Continuous profiling is increasingly recognized as a fourth core pillar for cloud-native systems.
How do I implement observability?
Start by instrumenting applications with OpenTelemetry for vendor-neutral telemetry collection. Establish baselines for the four golden signals (latency, traffic, errors, saturation). Consolidate logs, metrics, and traces into a unified platform. Configure alerts based on user-facing symptoms, not resource thresholds. Add continuous profiling last for code-level visibility.
What are some observability tools?
Common tools include Middleware, Datadog, Splunk, Dynatrace, New Relic, Prometheus, Grafana, and OpenTelemetry. Middleware is a full-stack platform that consolidates all telemetry signals into a single timeline with AI-powered root cause analysis and LLM observability built in. OpenTelemetry provides the vendor-neutral instrumentation layer that feeds data into any backend.
What are the 4 golden signals of observability?
The four golden signals are latency, traffic, errors, and saturation, originally defined by Google’s SRE team. Latency measures how long requests take. Traffic measures demand volume. Errors measure the rate of failed requests. Saturation measures how close a resource is to its capacity limit. Monitoring all four together gives the earliest reliable warning of service degradation.
What is the difference between monitoring and observability?
Monitoring uses predefined dashboards and threshold alerts for failure modes you anticipated in advance. Observability goes deeper by correlating logs, metrics, and traces to explain why something broke, including failures you never anticipated. Organizations that adopt observability report at least 25% MTTR improvement over monitoring-only approaches.