
Monitoring and Visibility
- Monitor all services running inside your application in one place
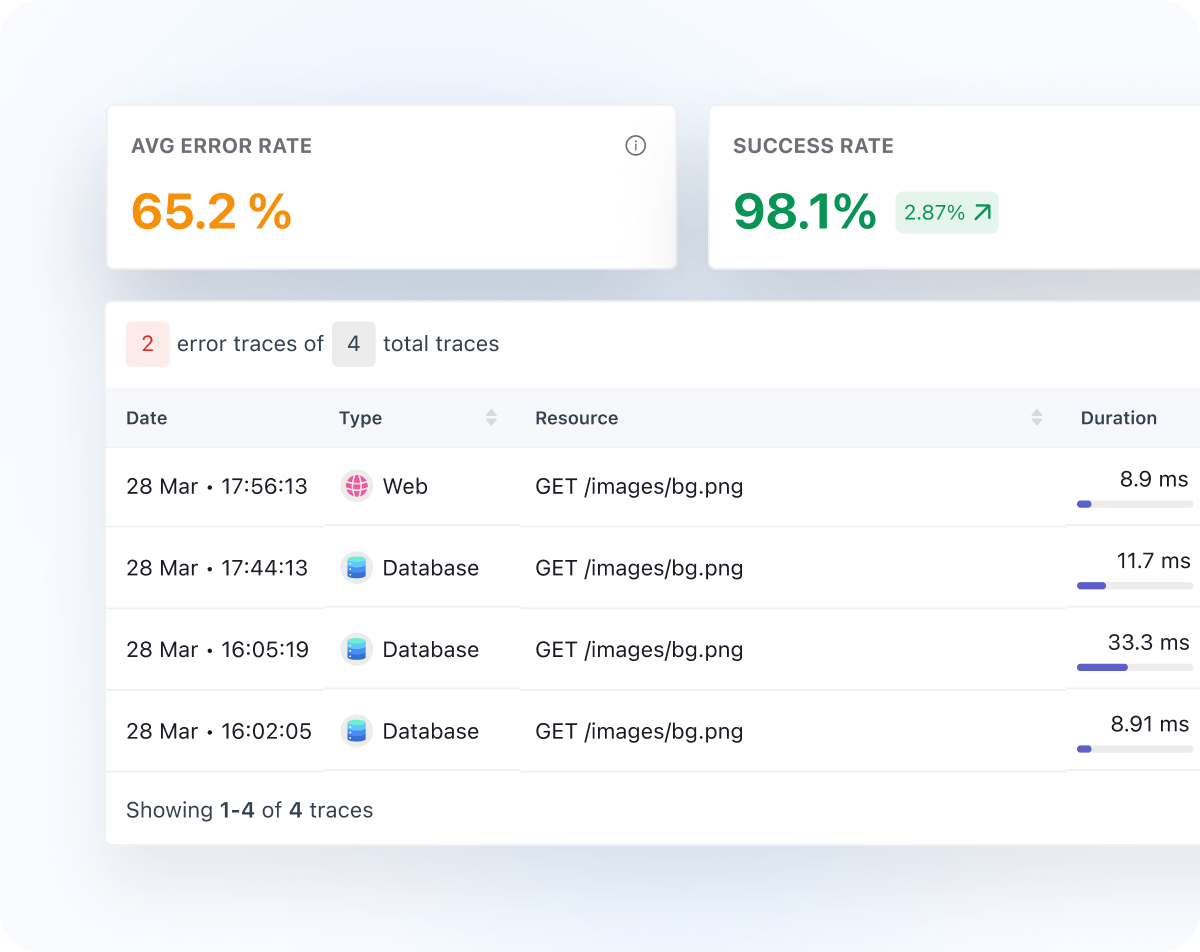
- View important service performance metrics, such as request rate, error rate, and latency
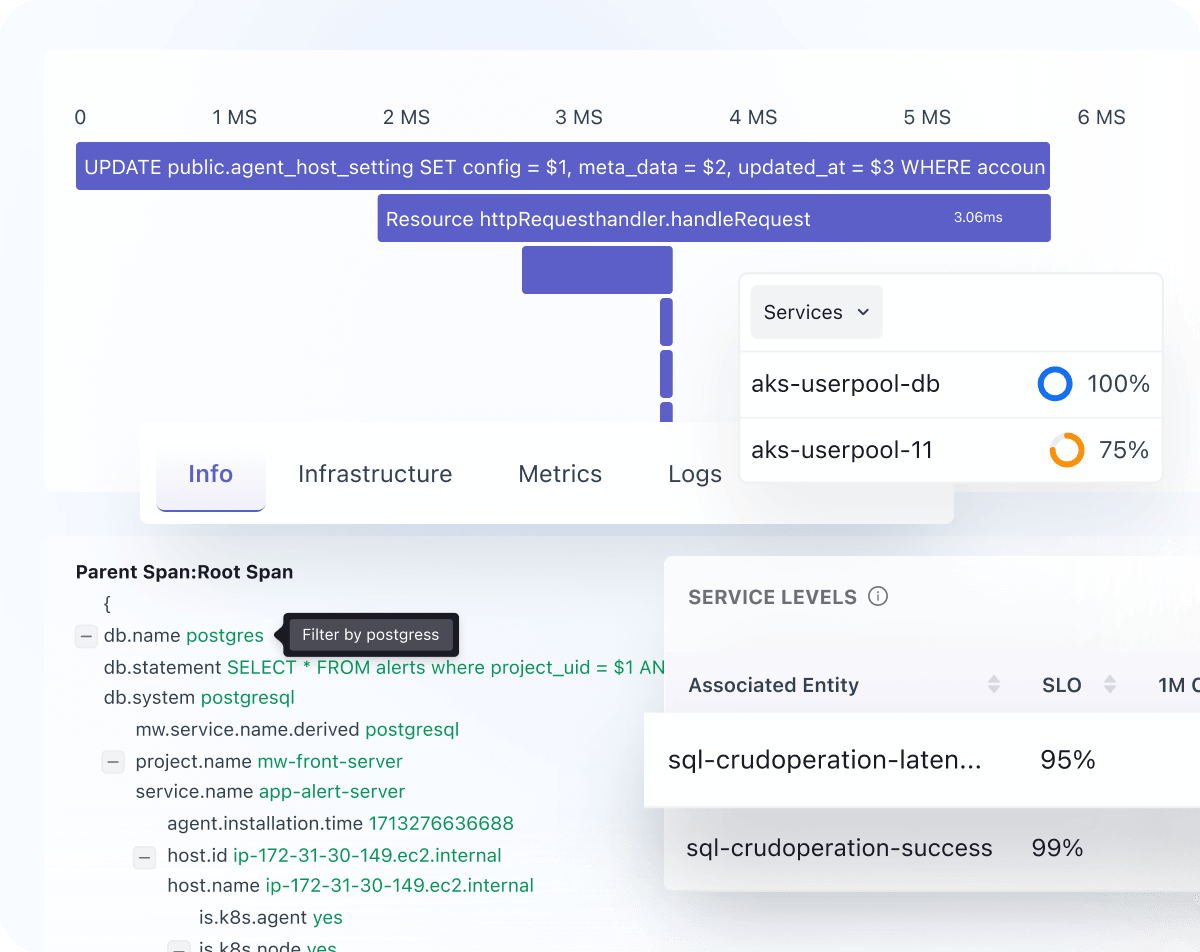
- End-to-End Tracing to collect and correlate distributed traces with logs, infrastructure metrics, database queries, and front-end user sessions
Performance Optimization
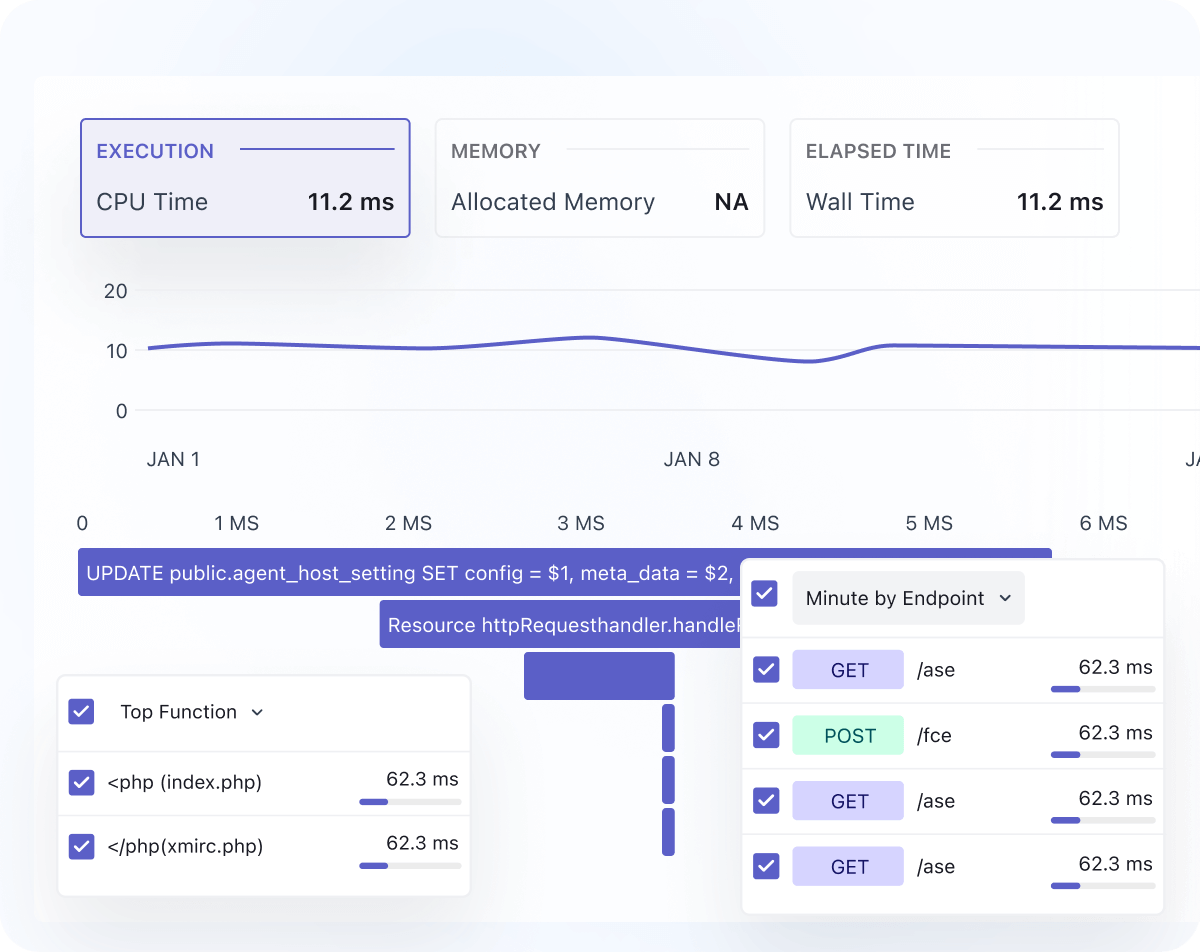
- Continuous profiling to view the performance of each resource inside your application in live action
- Identify code bottlenecks and analyze database queries to optimize performance
- Distributed tracing to identify which service is causing slowdowns quickly
Error Detection
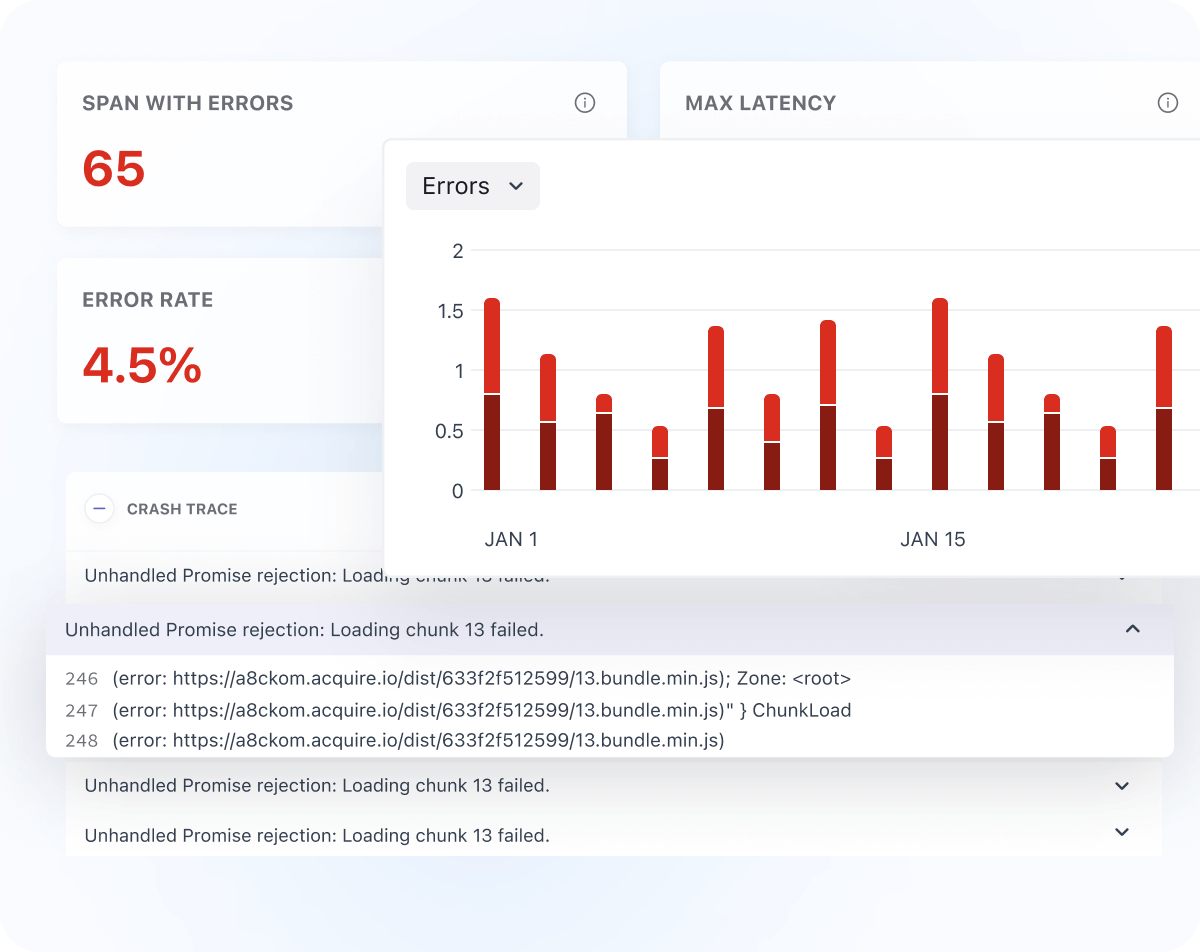
- Auto detects all the errors across your application with an error stack trace
- Improve MTTR by implementing faster root cause analysis and accurate error detection, which are surfaced at query time
- Reduce MTTD with pre-built, automated, and customizable alerts
Data Ingestion Control
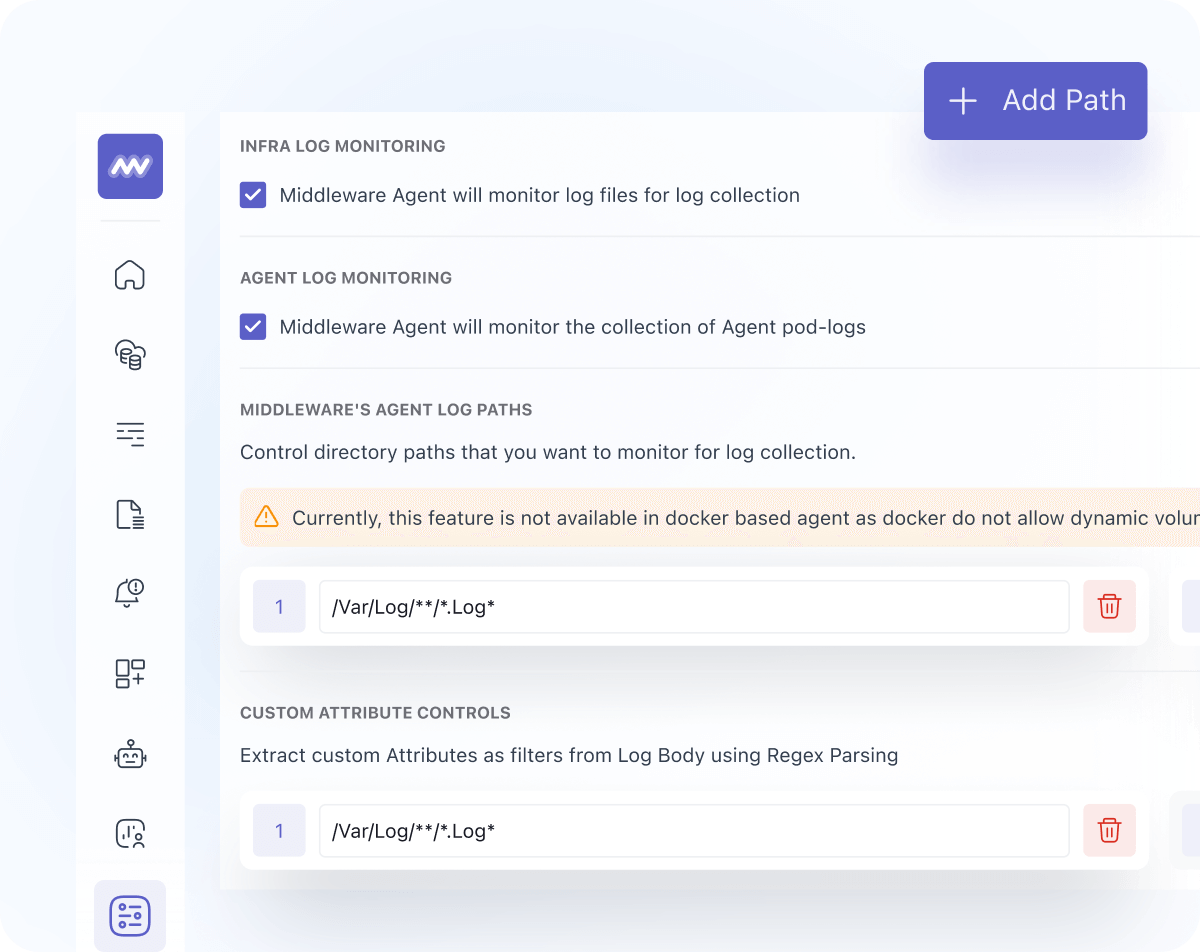
- Control data ingestion size by setting up a sampling rate for services
- Option to customize data ingestion by dropping data by service or any other service attributes
- Control the cost by controlling the data ingestion size for traces
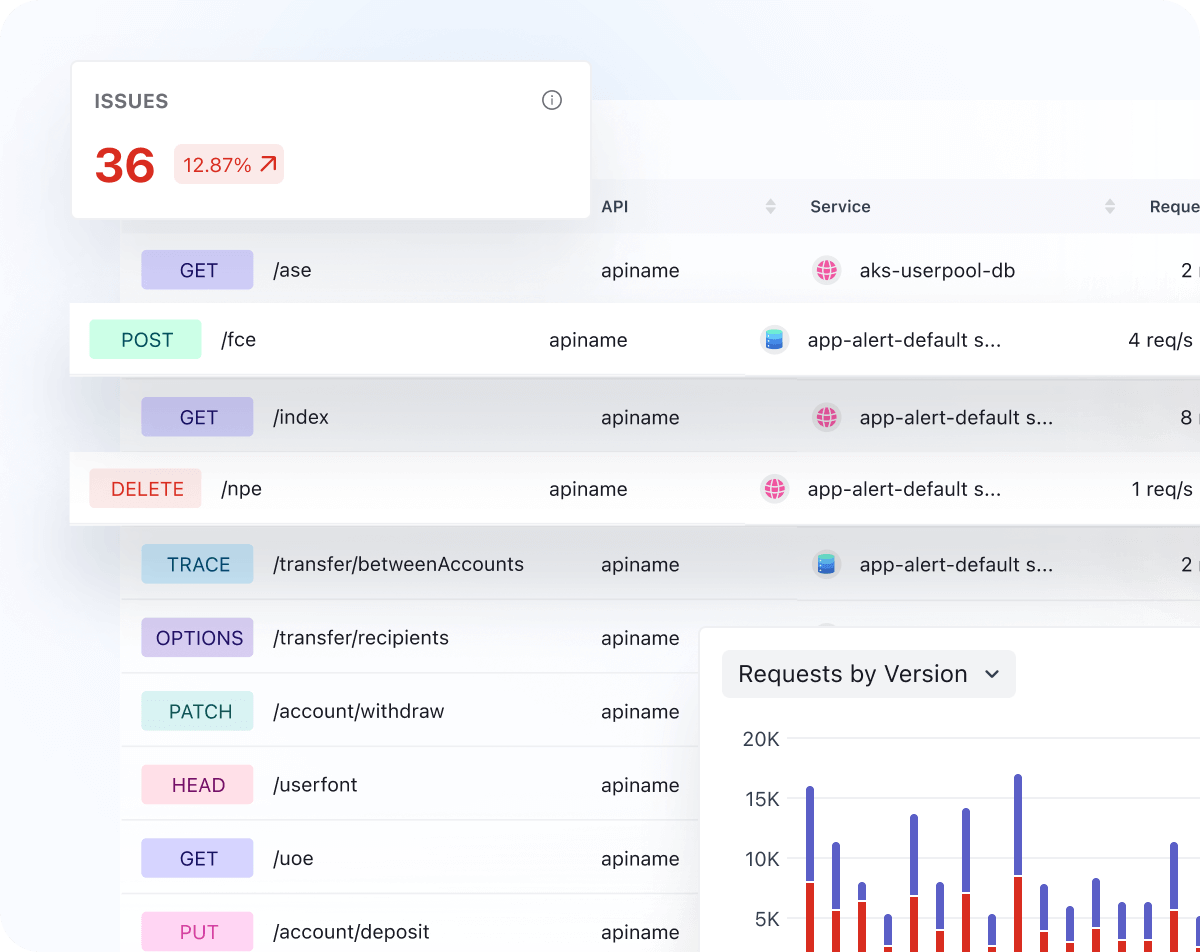
API & Database Management
- View a list of all your application's APIs with performance metrics, such as request rate, error rate, and latency
- Monitor database performance by examining the performance of each query within your database
- Dependency Visualization & Profiling to quickly identify the most time-consuming parts of your code
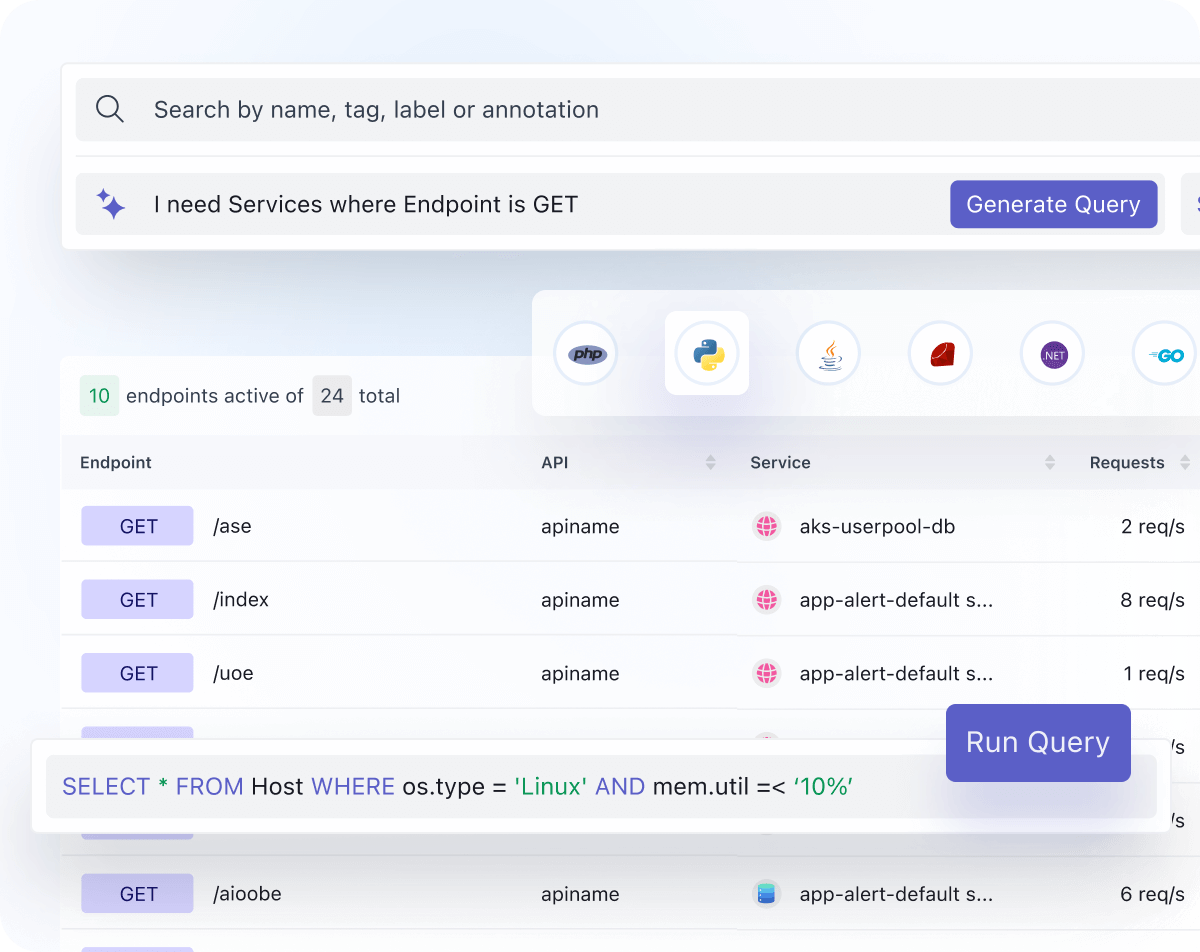
Ease of Use & Integration
- Easy search where the user can search by regex and apply arithmetic operators
- Predefined integrations with leading tech stacks (Java, Go, Python, Node, Cloudflare Worker)
- Easy deployment on hosts and containers in seconds
Service Monitoring
- Real-time metrics and correlated telemetry for instant visibility into the health of every service and deployment
- Monitor the downstream service's performance with metrics such as latency, request rate, error rate, etc
- View the end service map graph to remediate issues efficiently with quick access to all performance metrics at each stage
