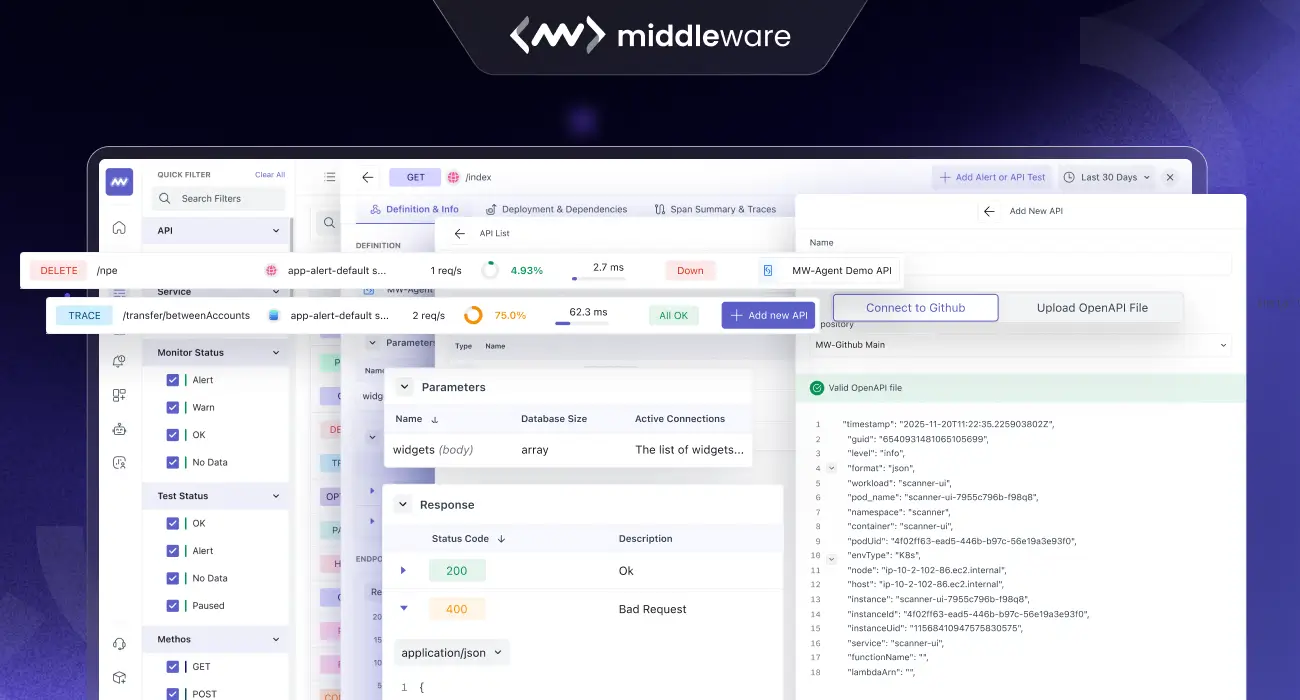
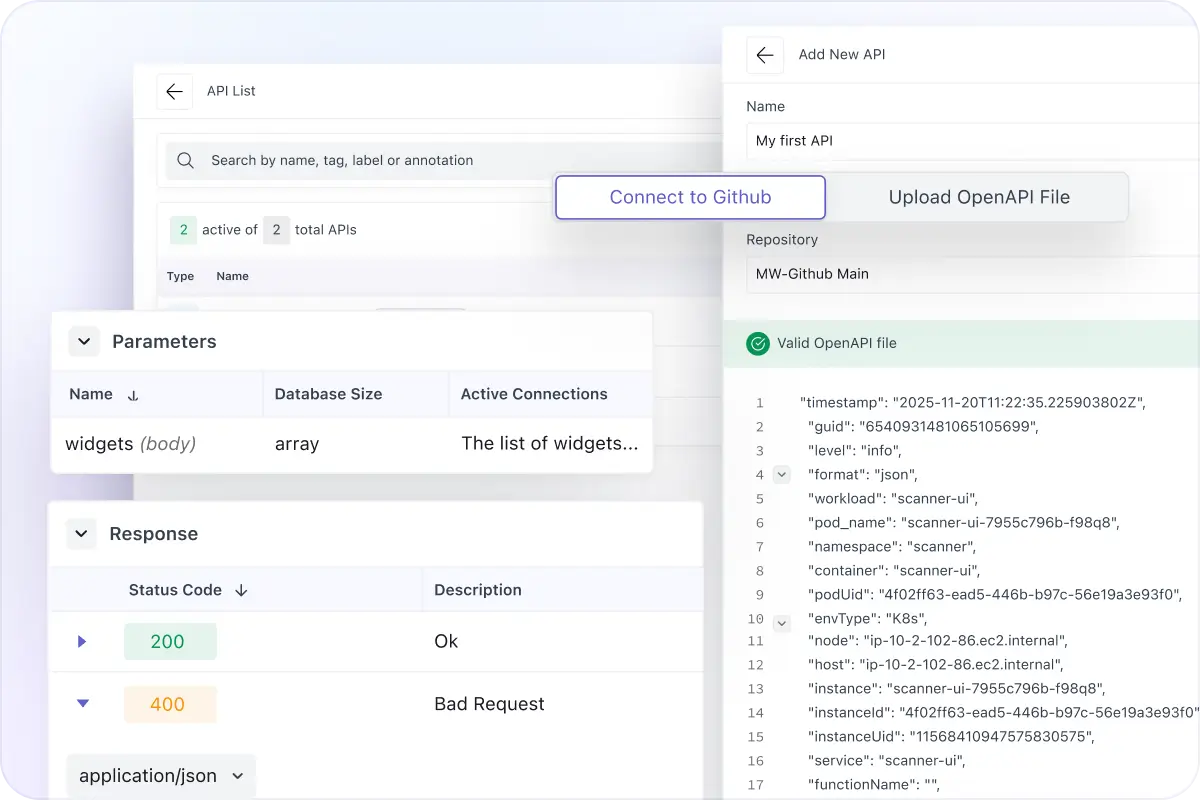
OpenAPI, Linked to Real Traffic
- Correlate your OpenAPI spec with discovered endpoints so each route shows contract + runtime context.
- Attach specs via GitHub or upload JSON/YAML, then match routes to documented operations automatically.
- View definitions, parameters, and response details next to latency, errors, and trace volume.
Filter Endpoints By Runtime Parameters
- Filter the endpoints list using parameters extracted from telemetry as params.tokens.
- We scrape parameters from real traffic and surface them as filters, not manual tags or guesses.
- Isolate specific request patterns fast (customer IDs, flags, query keys, token types).
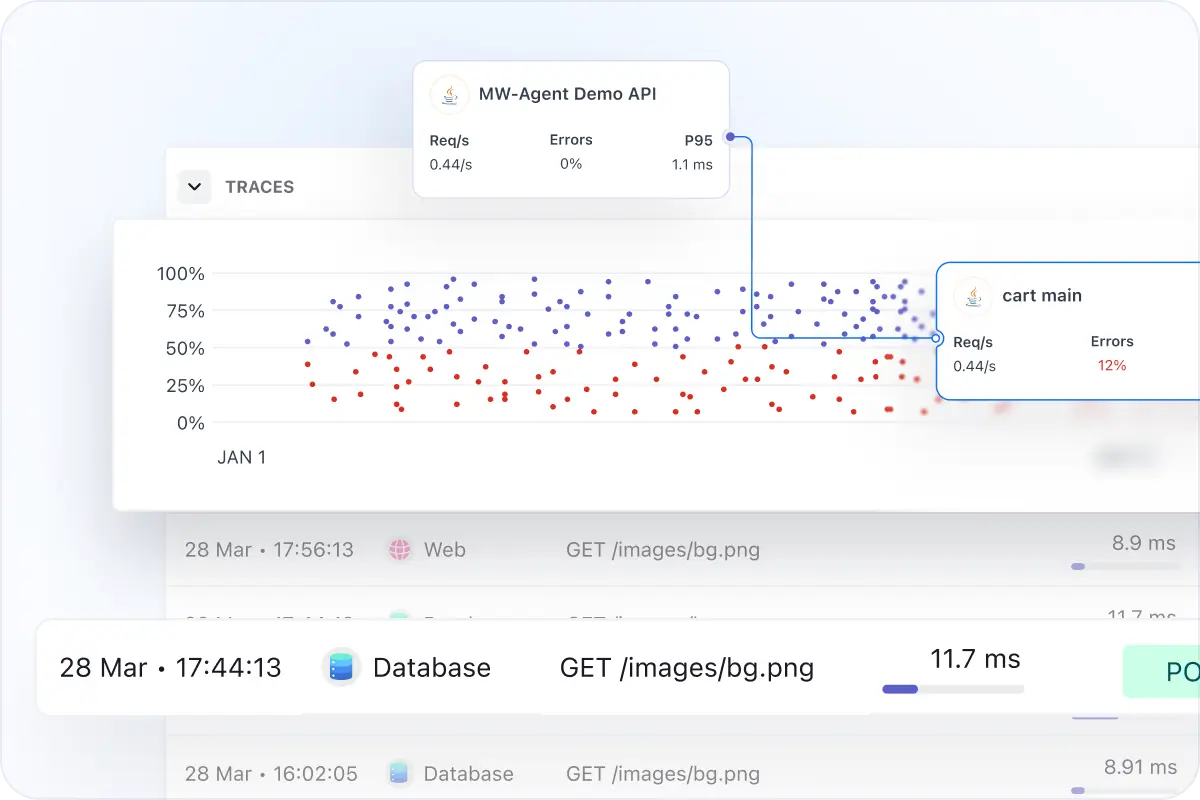
Drill Into Traces and Endpoints
- Open any endpoint to see a span breakdown grouped by type (HTTP, PostgreSQL, Internal, Function, Job, and more).
- Review service, span name, average duration, and error rate to spot where time is spent.
- Jump into traces with a volume graph and trace list (timestamp, duration, method, status code, span kind).
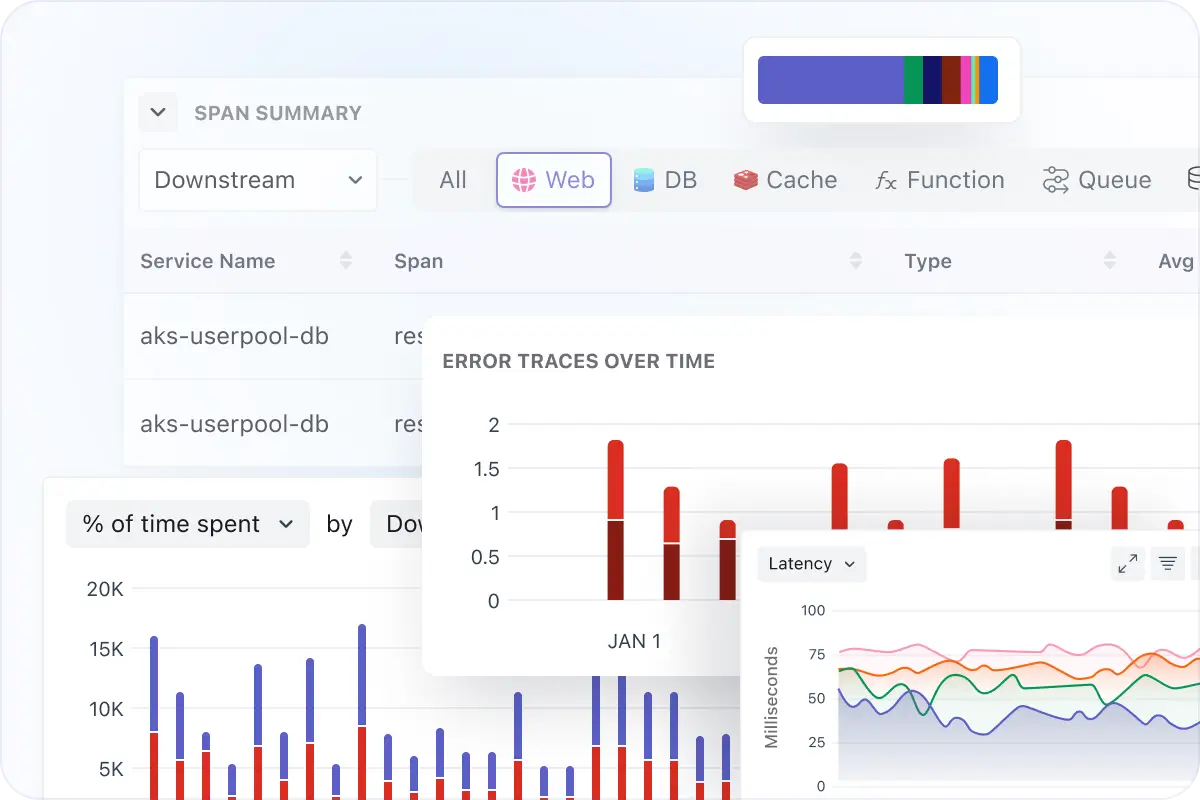
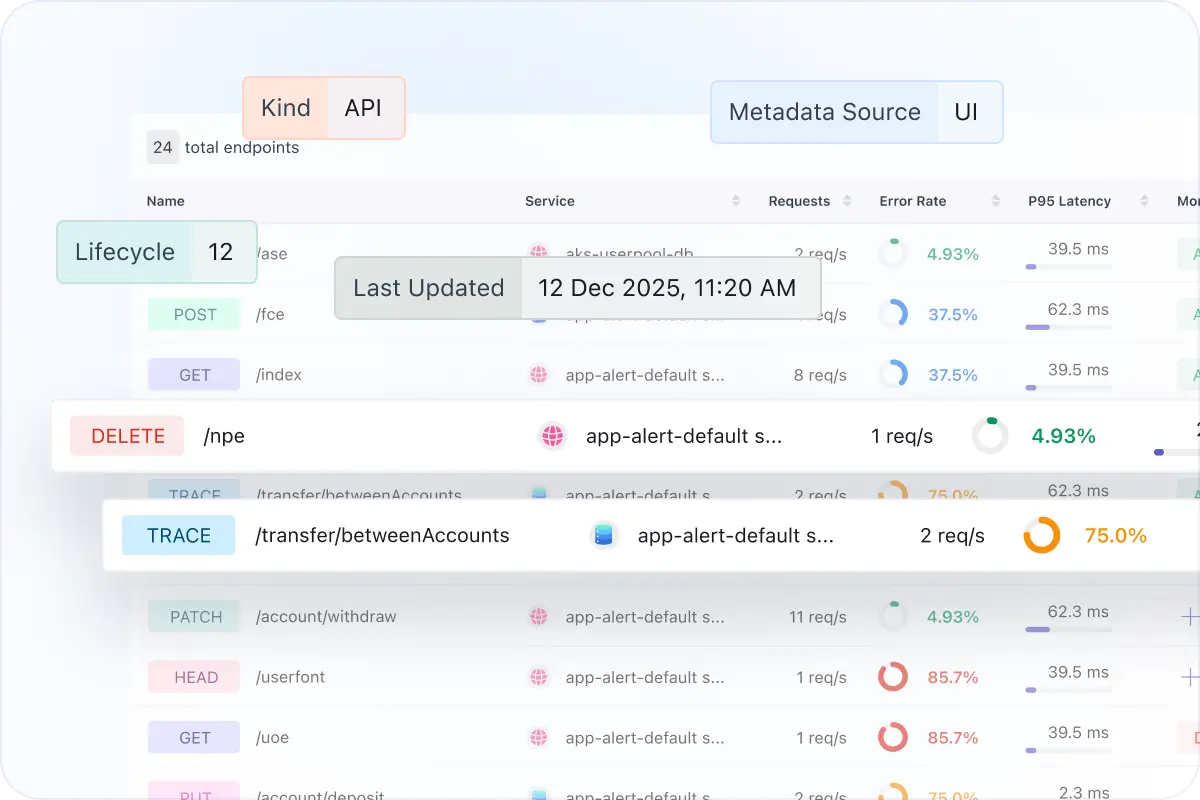
Compare Endpoint Performance Across Services
- Track tail latency directly on the endpoints table with P95/P99 and error rate per route.
- Compare releases by version with RPS, P50/P90/P99 latency, error rate, and Apdex.
- Use the dependencies map (when available) to understand upstream/downstream impact.