
Logs are everywhere; every click, each request, all the small things your app or website ever does leaves a trace. And when something’s broken? Sorting through page after page of raw data trying to identify what’s normal (and what’s not) is like searching for a needle in a haystack. That’s where log pattern detection helps. By grouping similar logs together, it becomes easier to spot unusual activity or unexpected changes.
With Middleware, you don’t have to do any of this ad hoc work, the system will automatically detect patterns in your logs to help you determine what to pay attention to, which makes monitoring, debugging, and taking action much easier. Let’s look at how to analyze log anomalies and how log patterns can help.
What Are Log Patterns?
Whenever applications are running, they generate logs which are messages about what is occurring at every step of the way. A log entry can contain different types of information (e.g. timestamps, request IDs, user inputs), but many logs have the same layout or format. These functions with repeated instances of similar data are considered log patterns.
A log pattern is essentially a template that represents a group of similar log lines.
For example:
- Failed Authentication Attempt
[ERROR] Failed login attempt for user 'maria.k' from IP 172.16.5.9 – Incorrect password.- Database Timeout
[WARN] Database timeout – Query to 'orders' table exceeded 5000ms. Host: db-prod-01Both log line follow the same pattern or syntax:[<LEVEL>] <Event description> – <Variable details>
Identifying these patterns helps reduce the noise in raw logs and gives you a higher-level view of what’s happening in your system.
To learn how proper formatting can enhance log pattern detection, read our guide on What is Structured Logging?
Why Log Patterns Matter
Let’s have a quick look at why log pattern matters:
- Noise Reduction: Instead of combing through thousands of very similar log entries, you can focus on only a few patterns.
- Anomaly Detection: When you discover a new or unusual pattern, it may indicate unexpected behavior, an error, or a problem or threat.
- Debugging: Log Patterns help to identify and group issues (especially in distributed systems).
- Resource Efficiency: Storing and querying patterns is typically cheaper and faster than accessing raw logs.
Learn more about identifying critical issues early in our detailed article on Anomaly Detection?
Types of Log Patterns
While there’s no formal classification, in practice, you’ll often encounter:
- Static Patterns: Logs that follow a predictable structure and rarely change. Example: startup logs or configuration messages.
- Dynamic Patterns: Logs that have a common structure but include changing values (like IDs, timestamps, etc.).
- Error Patterns: Logs generated during exceptions or failures. Often less frequent but more important.
- Rare/Unknown Patterns: Unusual logs that don’t match known formats, these are often the most critical to investigate.
Optimizing Log Views for Better Insights
When you are faced with thousands or even millions of log lines, raw logs can become unmanageable very quickly. Without good structure, it’s nearly impossible to identify what’s important. Using the log views optimally together with slicing, filtering, and grouping, you can eliminate the chaos of the raw logs and speed up troubleshooting.
Lets see some practical ways to filter and split the logs:
Practical Ways to Filter and Split Logs
Here are some reliable methods engineers use to make logs easier to work with:
- Split by Source: Take logs and partition them by source whether it’s your app, a backend service, or your database. This allows you to focus on just the components you’re interested in, without clutter from random logs.
- Filter by Environment: Whether you’re debugging a staging issue or watching production in real time, environment-based filters help you zero in. You can isolate logs from just
“prod”or“dev”and cut through the noise fast. - Prioritize by Severity: Focus on what’s urgent first. Filter by
ERROR,WARNING, orCRITICALlevels to surface issues that need immediate attention, and leave INFO logs for later when you’re digging deeper. - Group by Common Patterns: Middleware automatically detects repeating log patterns, like the same error message appearing across services. Grouping these together saves time and helps you tackle common issues in one go.
Want to sharpen your log filtering skills? Read How to Search Logs Effectively With Log Management.
Use Trend and Attribute Views to Dig Deeper
- Spot Trends Visually: Use Middleware’s trend charts to track how often specific logs or patterns occur. Spikes in activity often point to breaking changes, traffic surges, or something silently failing in the background.
- Group by Attributes: Attribute bars let you organize logs by tags like service, region,
status_code, orlog_level. Want to know if errors are only happening in us-west-1? Use the region attribute to filter fast and get clarity.
Analyzing Log Patterns & Dashboards in Middleware
In Middleware, log analysis isn’t just about viewing raw entries, it’s about extracting high-value insights using powerful features like pattern grouping, contextual traces, and smart alerting.
In this section, we’ll explore practical methods for using log patterns effectively, from debugging real-time issues to monitoring long-term trends.
See the Big Picture with Cluster View
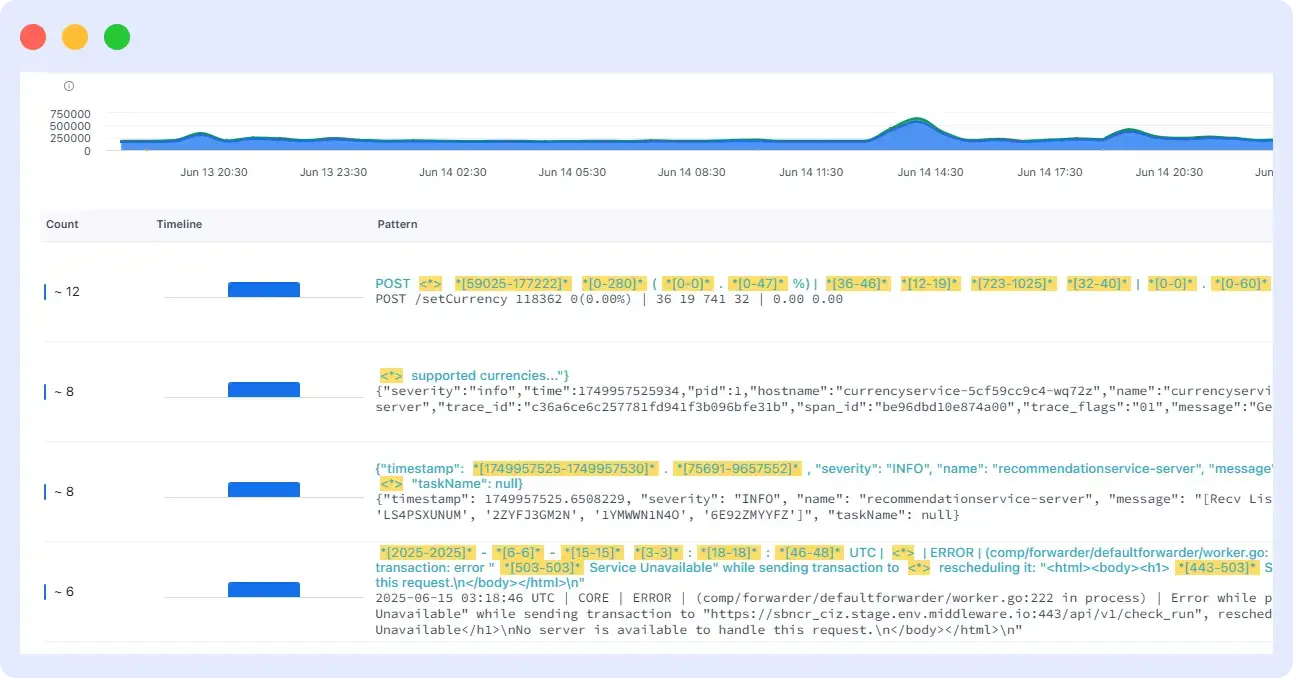
The Cluster View in Middleware provides a higher level of summary of your logs which groups-related messages into recognizable patterns. This is useful by providing visible trends, repetitive patterns, or spikes in some part of your infrastructure rather than you exporting each log line of text. It’s powerful to be able to see how your system operates at a higher level and is especially important when deploying, performing incident analysis, or debugging.
Each pattern is summarized with key attributes like frequency, severity, and example log lines. This helps engineering and DevOps teams prioritize which patterns to investigate further and which are part of normal operations.
For more on how to cluster and analyze patterns at scale, read our in-depth article Log Aggregation.
You can:
- View grouped patterns based on message similarity
- Identify trends using pattern-level charts
- Quickly filter by environment, log level, service, or region
- Detect newly appearing or unsaved patterns
- Drill down into detailed logs, metadata, and trace IDs
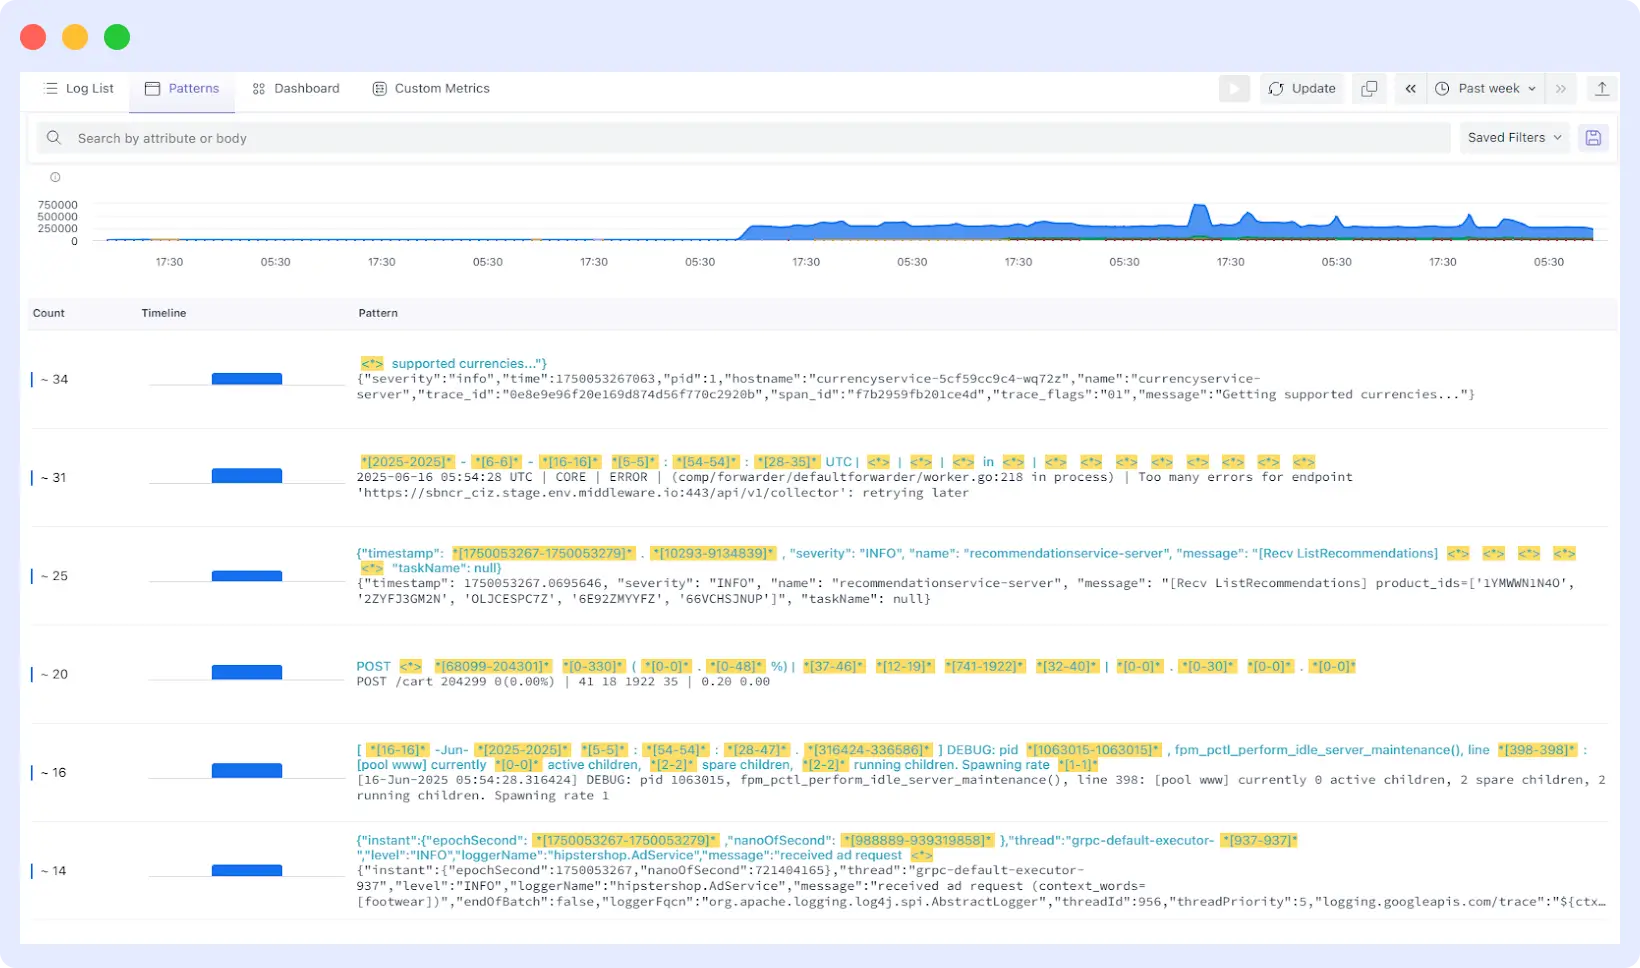
In the Middleware UI:
- The left pane shows a ranked list of patterns
- The top section displays filters and a time range selector
- The right panel offers previews and metadata for the selected pattern
- A toggle lets you isolate new or unsaved patterns to focus on anomalies
See Application Logs 101: Essential Knowledge for Developers.
Spot Normal vs Abnormal Patterns
Distinguishing between normal and abnormal log patterns is critical to proactive issue detection. Middleware makes this process seamless by automatically grouping similar logs and highlighting unusual behavior based on frequency changes, new appearances, or absence of expected patterns.
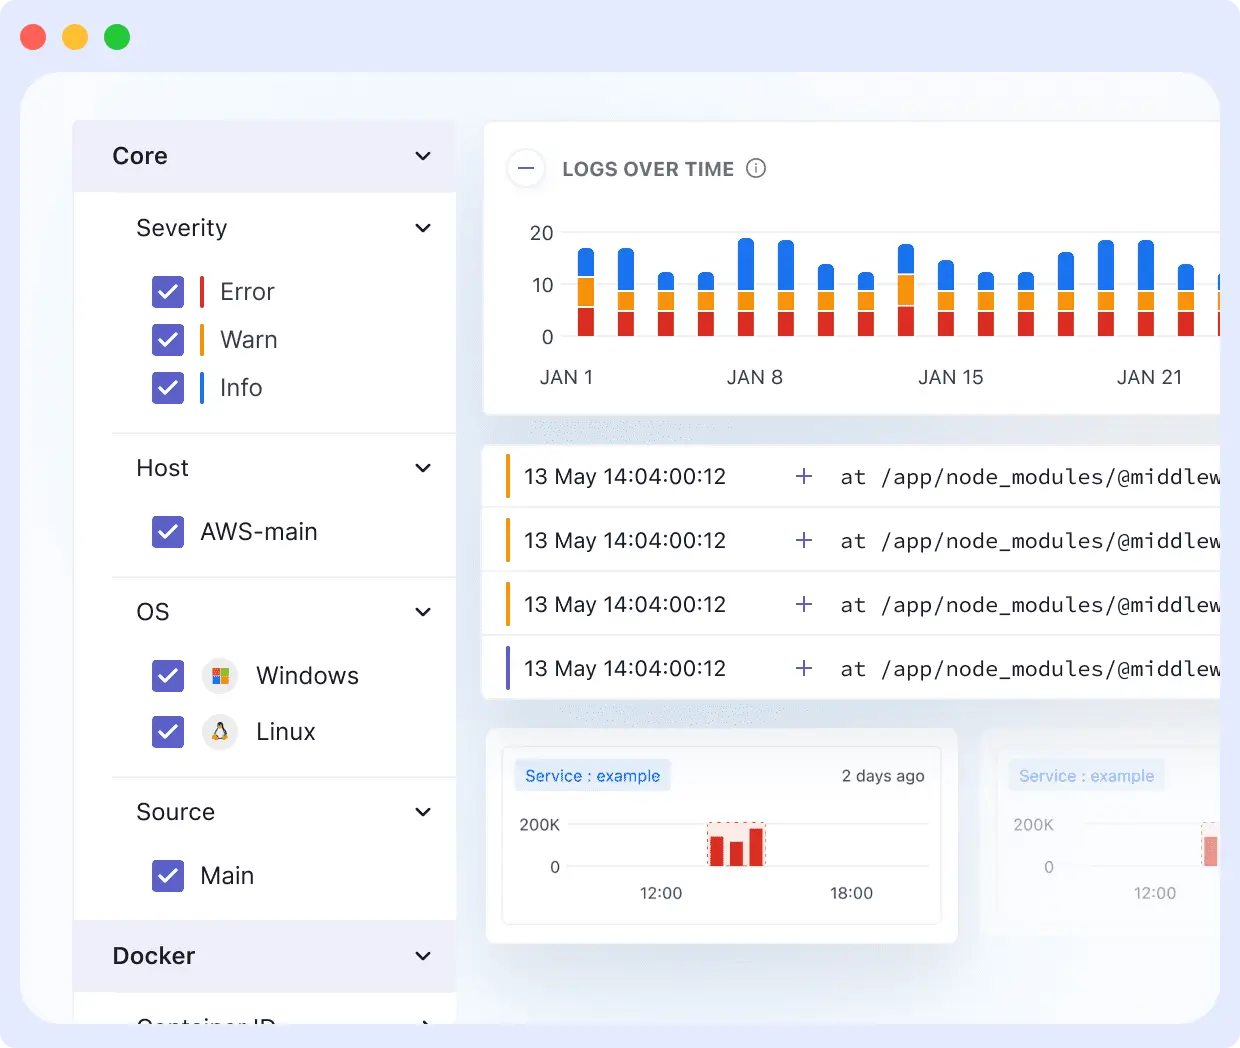
🟢 Normal patterns:
- Recurring system logs (e.g., successful API calls, completed jobs, startup messages)
Normal patterns are recurring log messages that represent expected system behavior — like successful API responses, routine job completions, or startup logs.
🔴 Abnormal patterns:
- Sudden spikes
- Unfamiliar structures
- Unexpected errors
Abnormal patterns typically show up when there’s a sudden spike in log volume, an unfamiliar log structure, or unexpected error messages. Middleware’s built-in pattern clustering groups similar logs together, making it easier to compare new vs. known behaviors at scale.
In Middleware, here’s how you can identify these easily:
- New Patterns Filter: View log patterns that haven’t been saved or seen before. This helps detect newly introduced errors or unexpected logs after a code push. See Creating Log Filters.
- Unusual Volume Indicator: Look for spikes or dips in log count. Middleware highlights these anomalies directly in the log pattern dashboard.
- Severity Level Filters: Narrow down logs by level: Error, Warning, Info. Focus on patterns that carry higher severity.
- Comparison by Time Range: Use the time filter to isolate patterns during specific events (e.g., a release window). Compare current logs with previous periods to catch regressions.
- Search by Field or Message: Use keyword or regex-based search to drill down into known abnormal keywords, exception types, or status codes.
- Sort by Count or Recency: Prioritize your view by logs that are newly created or rapidly increasing in volume.
Drill into Problematic Log Patterns
Once you’ve spotted an unusual or newly generated pattern, the next step is to investigate it in depth. Middleware’s log monitoring lets you move from pattern to context — uncovering when, where, and why an issue occurred.
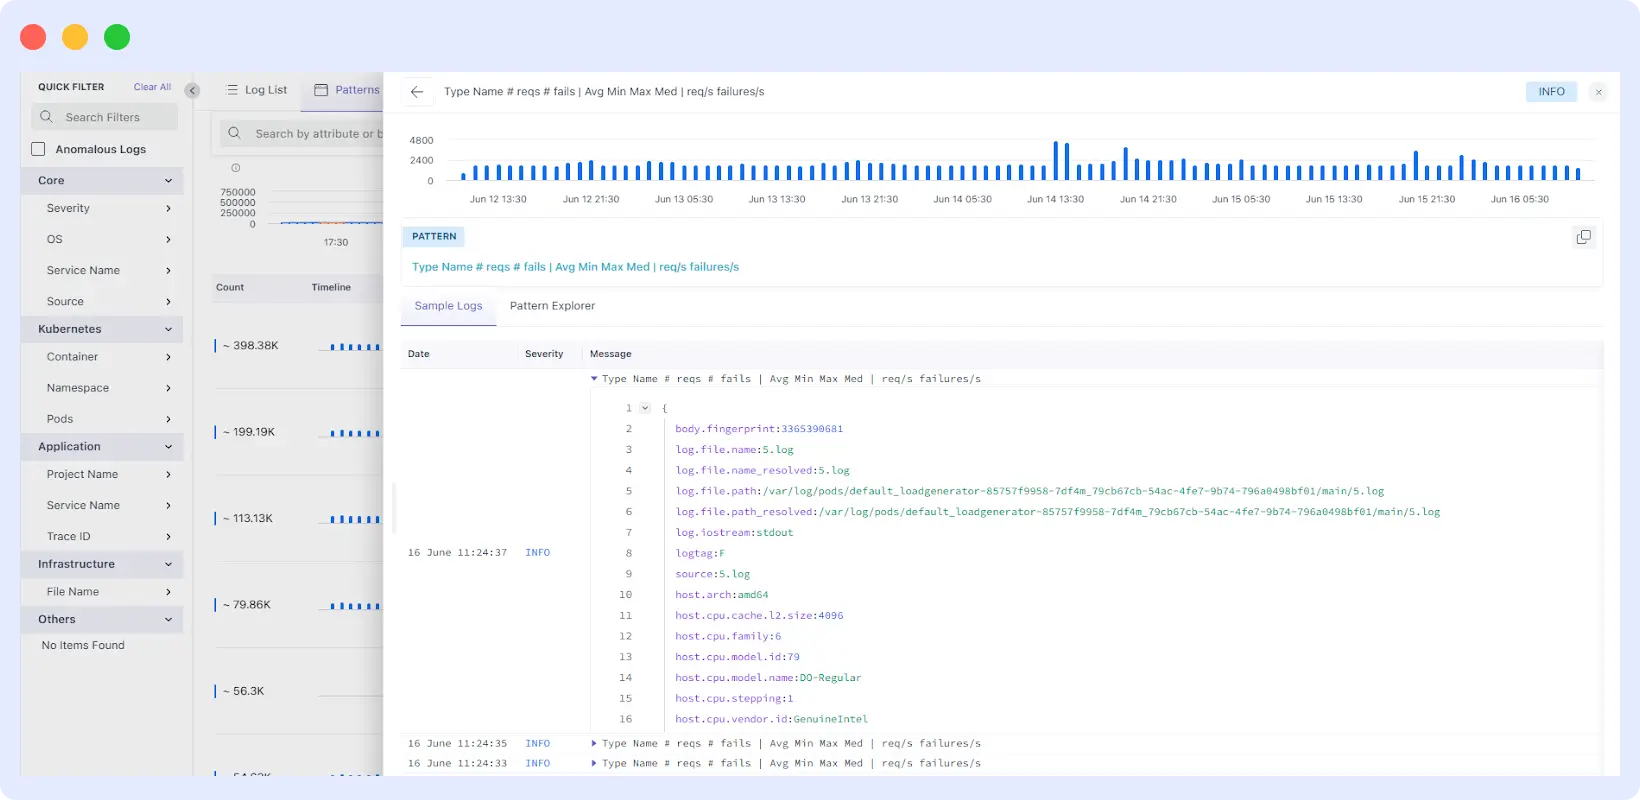
Each pattern card in Middleware opens into a detailed view showing all the log lines grouped under that structure. From there, you can:
Expand the Pattern
View raw logs, timestamps, and the source service or container. This lets you skip repetitive entries and focus on meaningful changes.
Example:
Failed login for user *appearing frequently may signal a brute-force attempt or a misconfigured client.
Use Attribute Filters
Narrow logs by specific fields like host, service, region, or log_level to zero in on root causes faster.
Example:
Filter:
log_level=ERRORandservice=auth-service
Insight: Spike in failed login attempts after a deployment.
Trace Log Sources
Pinpoint the deployment, environment, or Kubernetes pod responsible for the logs.
Example:
All errors linked to a staging pod confirm the issue is not impacting production.
Correlate with Metrics or Traces
Connect log patterns with related performance data for deeper context.
Example:
Timeout logs from the DB coincide with high memory usage and slow trace spans.
Save or Share Views
Store filtered log views for future reference or collaborate by sharing them with your team.
Example:
Save and share the
auth-serviceerror pattern with the backend team for review.
Use Log Pattern Frequency to Spot Trends
Seeing how often a log pattern recurs over time can show you small problems before they become big problems. Middleware keeps track of how frequently each log pattern occurs, enabling you to notice patterns of recurring issues, sudden spikes, or silent failures.

You can:
Track Spikes or Drops
See when a pattern suddenly appears more (or less) than usual.
Example:
A sharp increase in Failed API request with status 500 might signal a backend outage or overload.
Compare Frequency Across Time Ranges
Quickly compare today’s log pattern count with yesterday’s or the past week.
Example:
If error logs for a specific service have doubled since the last deployment, that’s a strong signal something’s broken.
Use Frequency Charts
Visual graphs highlight patterns that deviate from their normal volume.
Example:
A pattern that used to show up once an hour is now flooding logs every minute — a clear sign of abnormal behavior.
Combine with Filters
Focus on frequency for a specific service, environment, or error type.
Example:
Check if auth-service errors only spike in the production environment, not staging.
Manage and Reuse Log Patterns Effectively
Once you’ve identified a valuable log pattern whether it indicates a recurring bug or a performance anomaly it shouldn’t stay hidden in a one-time investigation. Middleware gives you tools to turn patterns into reusable insights across teams.
Persist Key Patterns
Convert any discovered pattern into a saved object. This allows you to revisit, monitor, or compare it over time.
Example:
Save a pattern for “User session expired” spikes that often correlate with cache issues.
Tag and Group Patterns
Add tags to categorize patterns by issue type (e.g., auth errors, DB failures) or priority.
Example:
Tag multiple patterns related to Kubernetes pod crashes under “deployment issues.”
Share Contextual Patterns Across Teams
Share patterns with pre-applied filters, timestamps, and metadata — so others jump in with full context.
Example:
A backend dev instantly sees a pattern from a recent release showing increased “NullPointerException” logs.
Monitor Pattern Trends
Track how often a pattern appears over time to identify regressions or improvements.
Example:
A “Payment API timeout” pattern that dropped after a rollout confirms the fix worked.
Search by Attribute or Message Body
Go beyond keyword search — Middleware supports attribute-based filtering (e.g., log_level, region, host) as well as body text.
Example:
Filter:
log_level=ERROR AND service=payment-service
Body contains:"transaction declined"
This combination helps pinpoint specific failures while avoiding noise.
For more comprehensive information on log monitoring best practices, check out our detailed guide on What Is Log Monitoring.
Conclusion
Log pattern understanding and management are vital to maximize system performance, spot problems rapidly, and maintain seamless operations. Log analysis in an intelligent manner can help teams identify problems faster, monitor ahead of time, and enhance overall reliability.
When companies approach log pattern analysis as a fundamental aspect of their monitoring plan, they can more effectively remain one step ahead of issues as opposed to responding to them after the fact.
As systems grow more complex, the next step is adopting AI-driven log analytics for real-time log anomaly detection and predictive monitoring. Explore how Middleware simplifies log analysis: Start Monitoring Logs for Free