
The Markets and Markets report suggests that the global log management market is expected to grow from $2.3 billion in 2021 to $4.1 billion by 2026. This is due to rapid digital transformation and the hyperflexibility of the cloud environment, which is dominated by Amazon Web Services, Microsoft Azure, and Google Cloud Platform.

Searching log files can be a tedious task, as they are often large and unwieldy. Log files provides insights into when and where issues occur. Therefore, it is an important skill to be able to search log files to solve critical problems quickly.
How to Search logs effectively?
Various teams use log events to investigate bugs in code, search for the root cause of outages, and so on. Therefore, searching logs is an important process. There are different ways to search logs effectively. One is to use the bash command, and the other is to use a log monitoring tool.
Let’s discuss both ways one by one.
Using Bash Command
If you are a Windows user, install Linux on Windows with WSL. After installation, open the Bash shell and change the directory where the log file is present. Now, you are all set to perform log searching using bash commands.
Bash commands are instructions that allow you to interact with the shell. They are very useful for performing a wide variety of tasks. The Bash Unix Shell provides various commands that can be used to filter and search data.
Using bash commands, you can search logs effectively. For example, you can search for all the logs with errors or warnings. You can also search logs by timestamps, or you can search for logs between two timestamps.
Now, let’s explore the Grep bash command to search logs effectively.
According to the Linux manual, grep searches for patterns in each file. Patterns can be one or more patterns separated by newline characters, and grep prints each line that matches a pattern.
The pattern should be quoted when used in a shell.
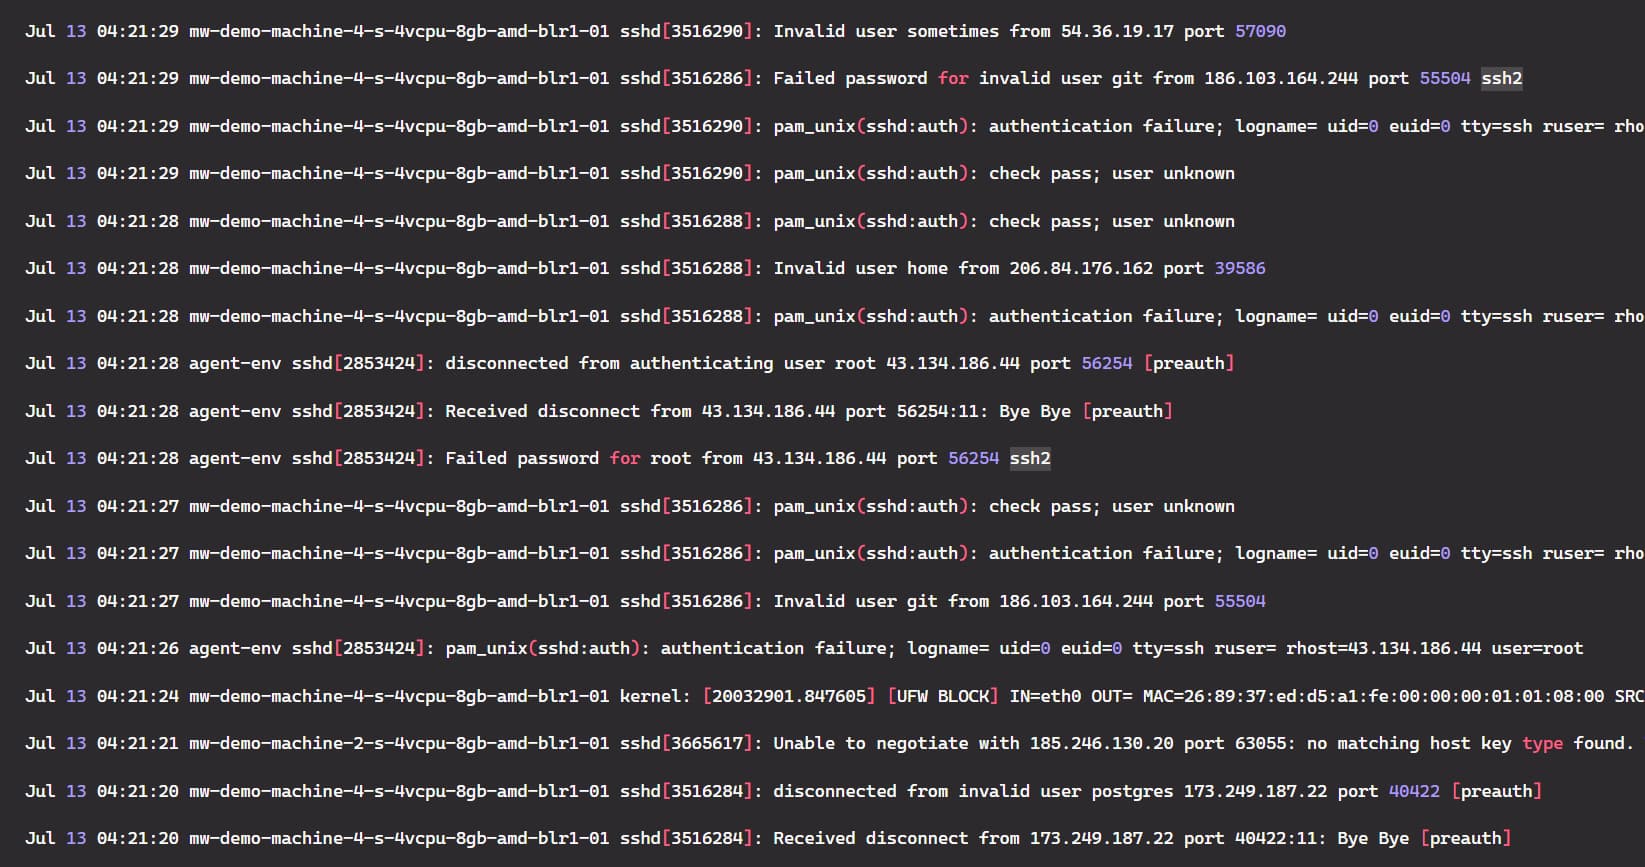
Suppose we have the following dataset in a log file. Now, we are going to use the grep command on the dataset.
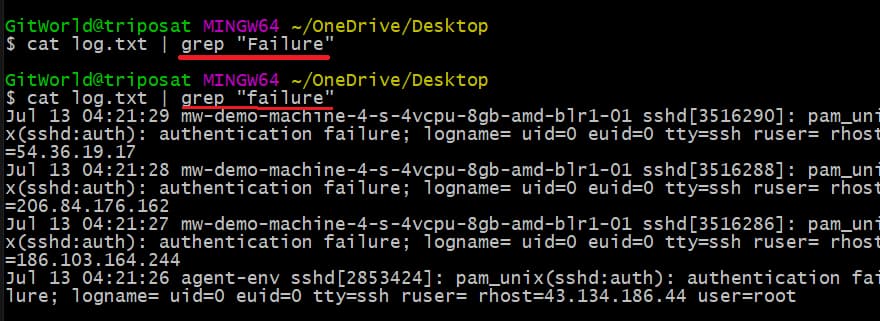
Let’s start by searching for the errors in the log file. There are various errors in the log file, but we will search for the word “failure” in the log file. We need to pass the word “failure” with the grep command and remember that the grep command is case-sensitive, so take care of that.
To do this, first, we need to read the log file using the cat command and then use the grep command with the pipe symbol (|).
Command:
cat log.txt | grep “failure”
See the image below. When we enter the word “Failure”, no results appear. However, when using the word “failure”, all the logs having failure have been displayed in the console.
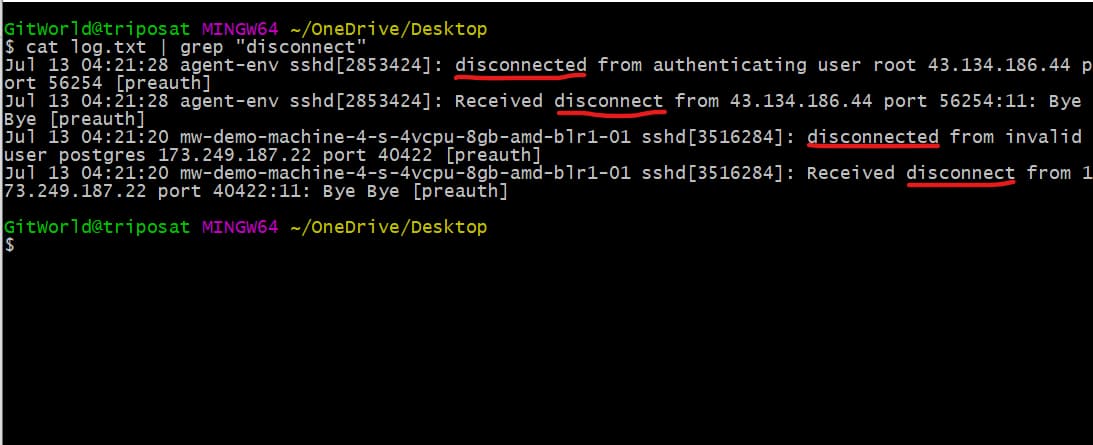
Next, suppose we have two types of errors in the log file. The first has the word “disconnect,” and the other has the word “disconnected”.
Now, if we use the grep command to search for the word “disconnect”, the error with the word “disconnected” will also appear in the console, as you can see below.
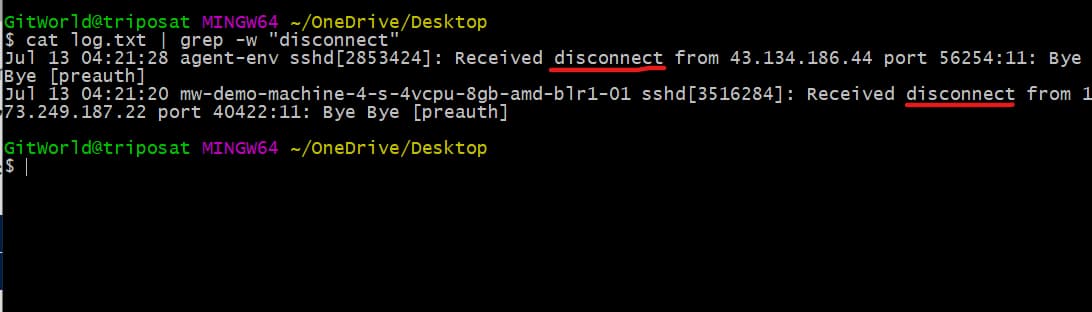
Now, what if we want the result for the exact word only? To do this, we can use the -w option to tell the grep command to match the exact word.
Command:
cat log.txt | grep -w “disconnect”
You can see below that we only have logs matching the exact word.
What if we filter all the logs with all kinds of errors, like “failure”, “disconnected”, etc.? To do this, we have to use the -E option with the grep command.
Command:
cat log.txt | grep -E “disconnect|Fail”
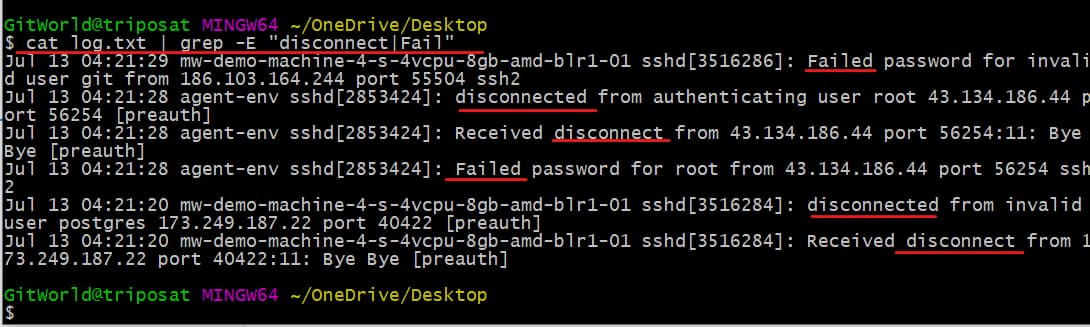
See above; all the logs that have the words “Fail” or “disconnect” have been displayed.
Now, for larger log files that have millions of data, the number of returned results can have thousands of matches. What if we want to know the count of all the matches? For this, we can use the -wc command along with -l.
Command:
cat log.txt | grep -E “disconnect|Fail” | wc -l
As you can see below, we have 6 results for the above words.

Cool! Now that we have explored the grep command, we can see how useful it is for searching logs effectively.
Recent hires in an organization may struggle to build log queries for quick searches. It is time-consuming, so organizations should prioritize log management tools to reduce manual efforts.
This is where log monitoring tools like middleware come into the picture, as they provide a seamless log search experience.
Using Middleware
Middleware provides a seamless, point-and-click log search experience that makes it easy to conduct efficient log investigations. It includes:
- Use the search option and advanced filters to easily analyze logs and find patterns.
- Search for error messages, warning messages, or other types of log entries.
- Save and reuse the search query for faster troubleshooting.
- View historical log data with the time travel feature.
…and a lot more.
Now, create a middleware account, go to your middleware dashboard, and click on the installation button just above the setting at the bottom left. You will see all three agents (Kubernetes, Linux, and Docker); click on any, and copy the full command.
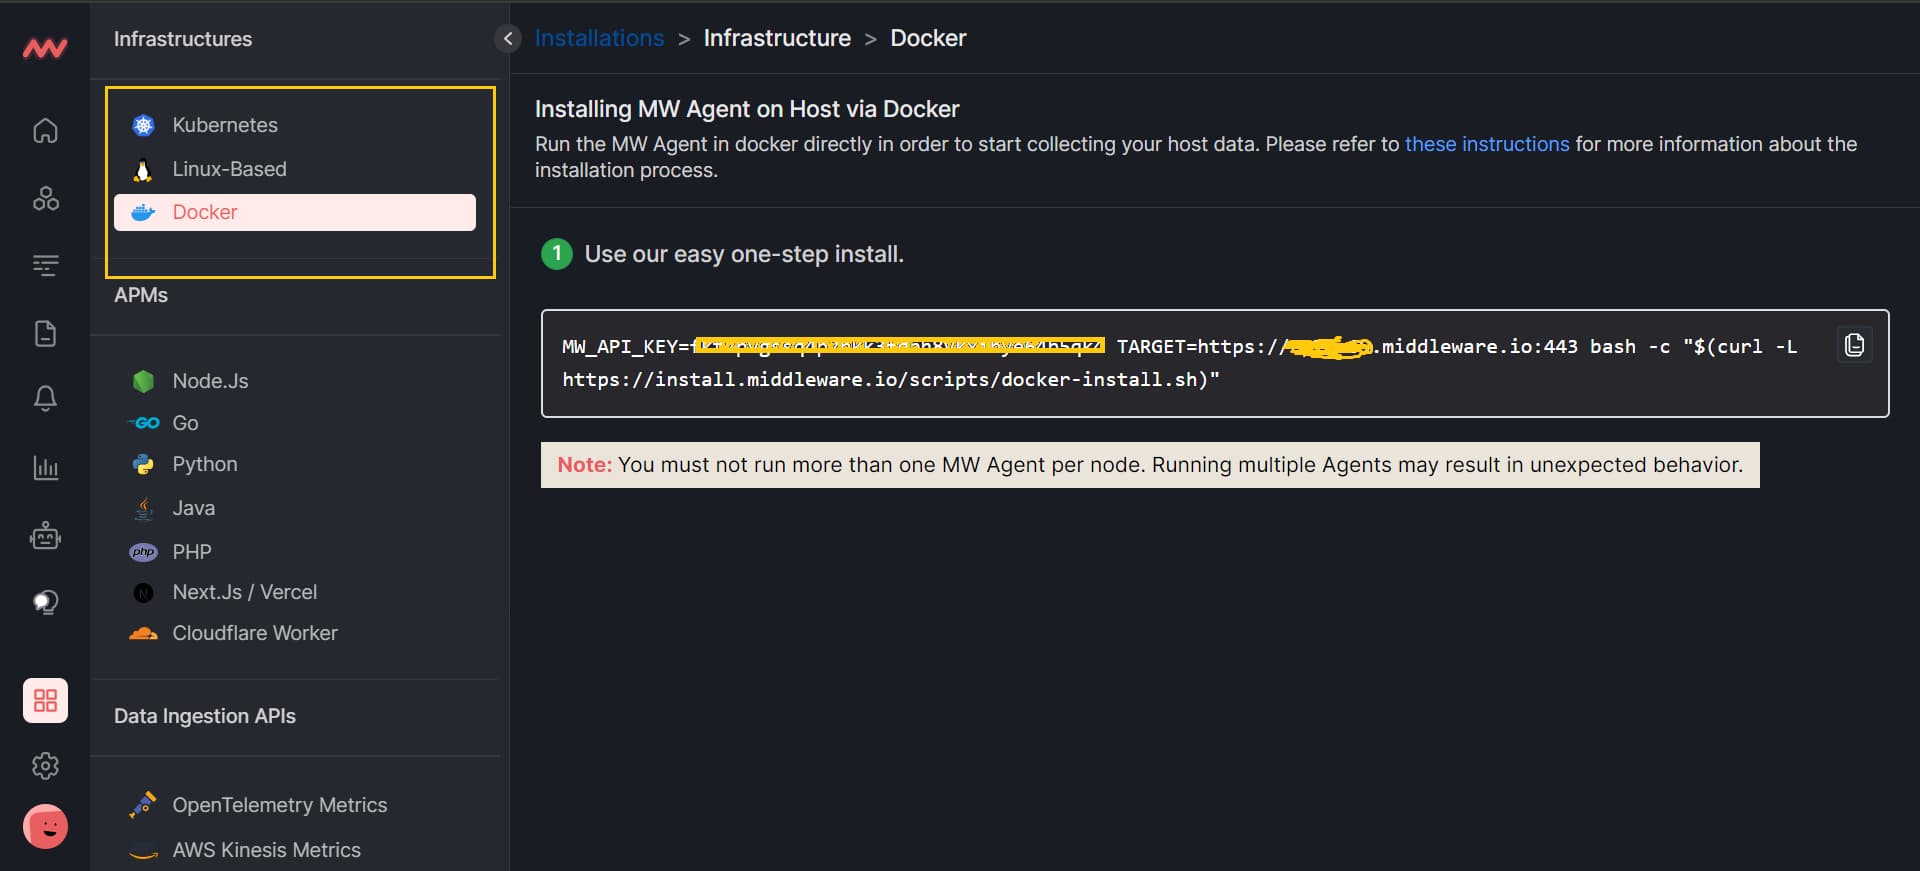
Note that first, you need to install the agent in your system. You can either install Kubernetes, Linux, or Docker-based agents. After the agent installation is completed and make sure it is running, paste the command (that you copied from your middleware dashboard) into the bash shell.
After all the installations, make sure to verify the status of the agent.
Now, let’s look at how middleware can help to investigate logs more quickly, especially during time-critical scenarios such as service outages, security breaches, etc.
Reduced MTTR with autocomplete queries:
Autocomplete queries can help reduce mean time to recovery (MTTR). It makes it easy to find the information needed to troubleshoot problems. It helps you find the right log file by suggesting possible matches for your provided keyword.
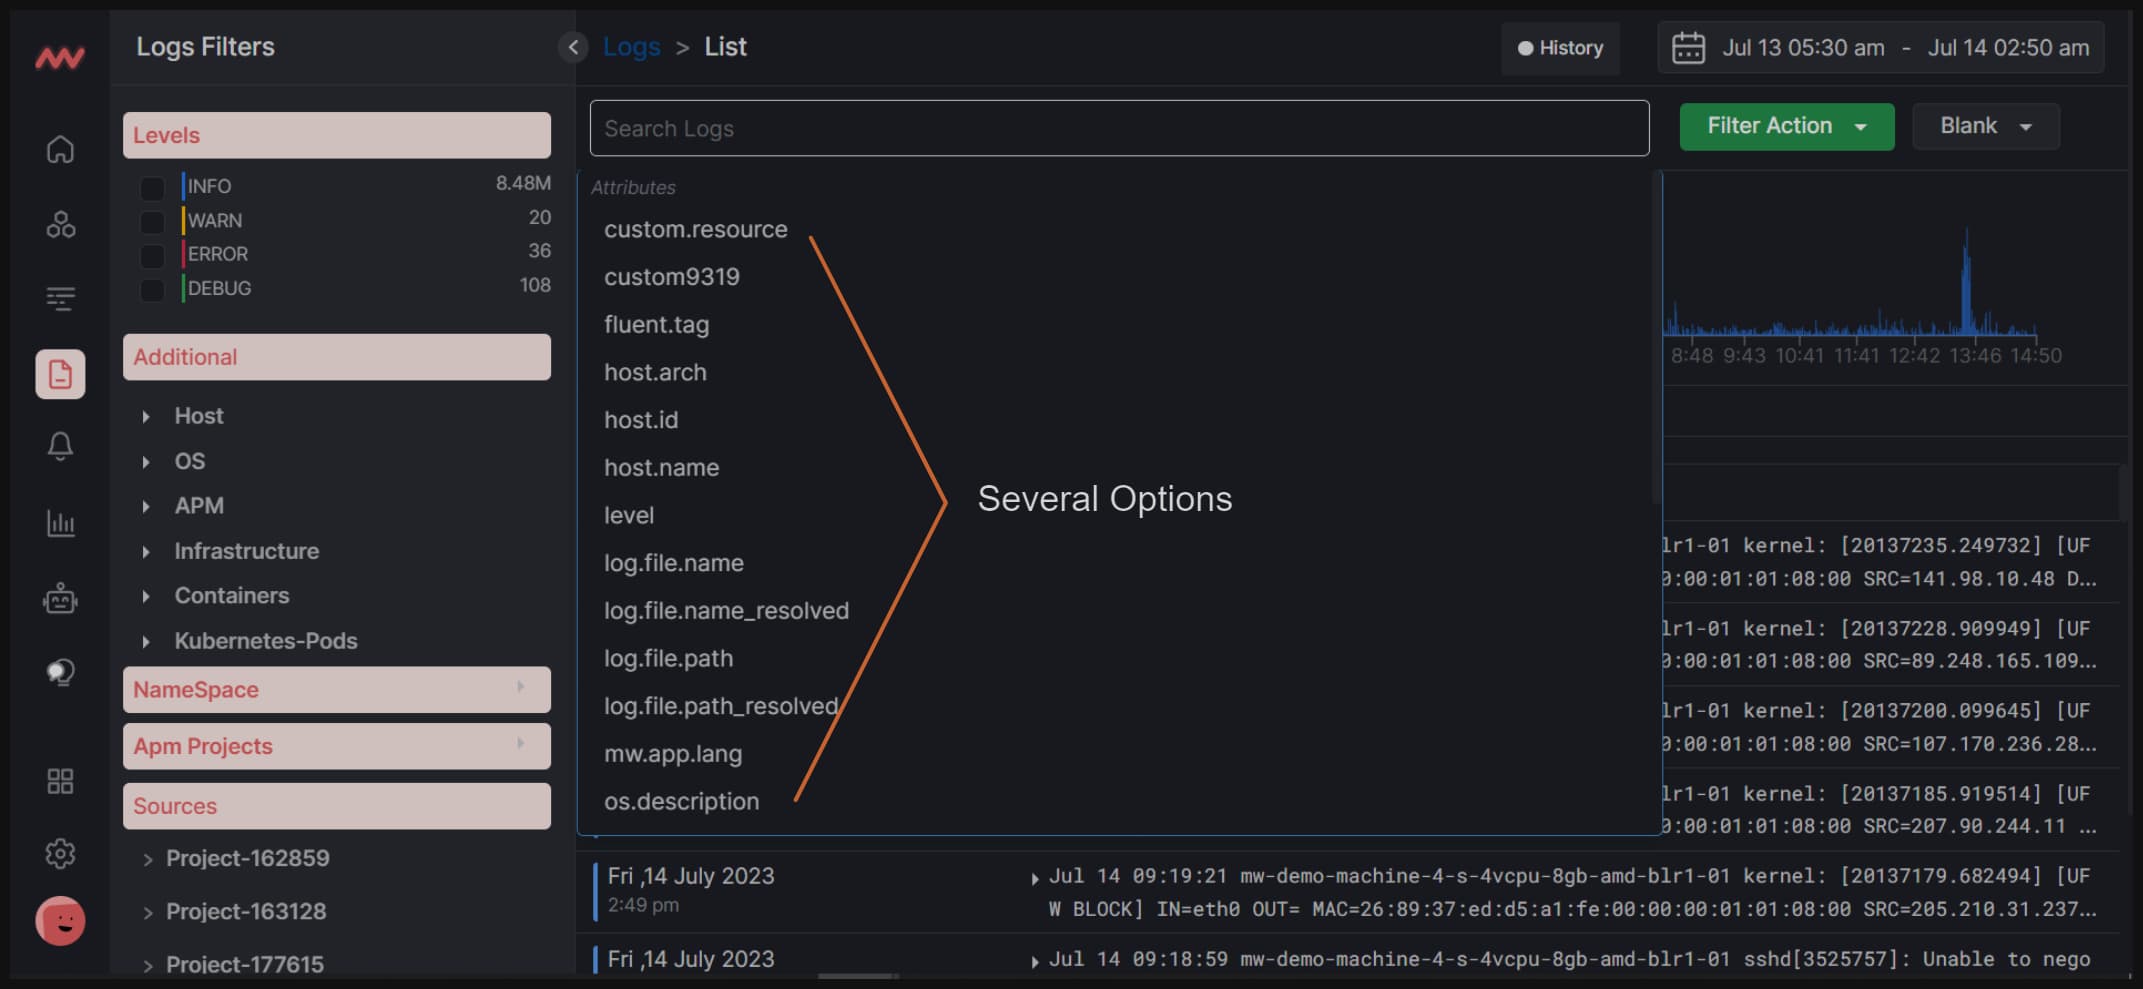
The middleware autocomplete search bar helps you write complex log queries by providing suggestions of possible matching keywords.
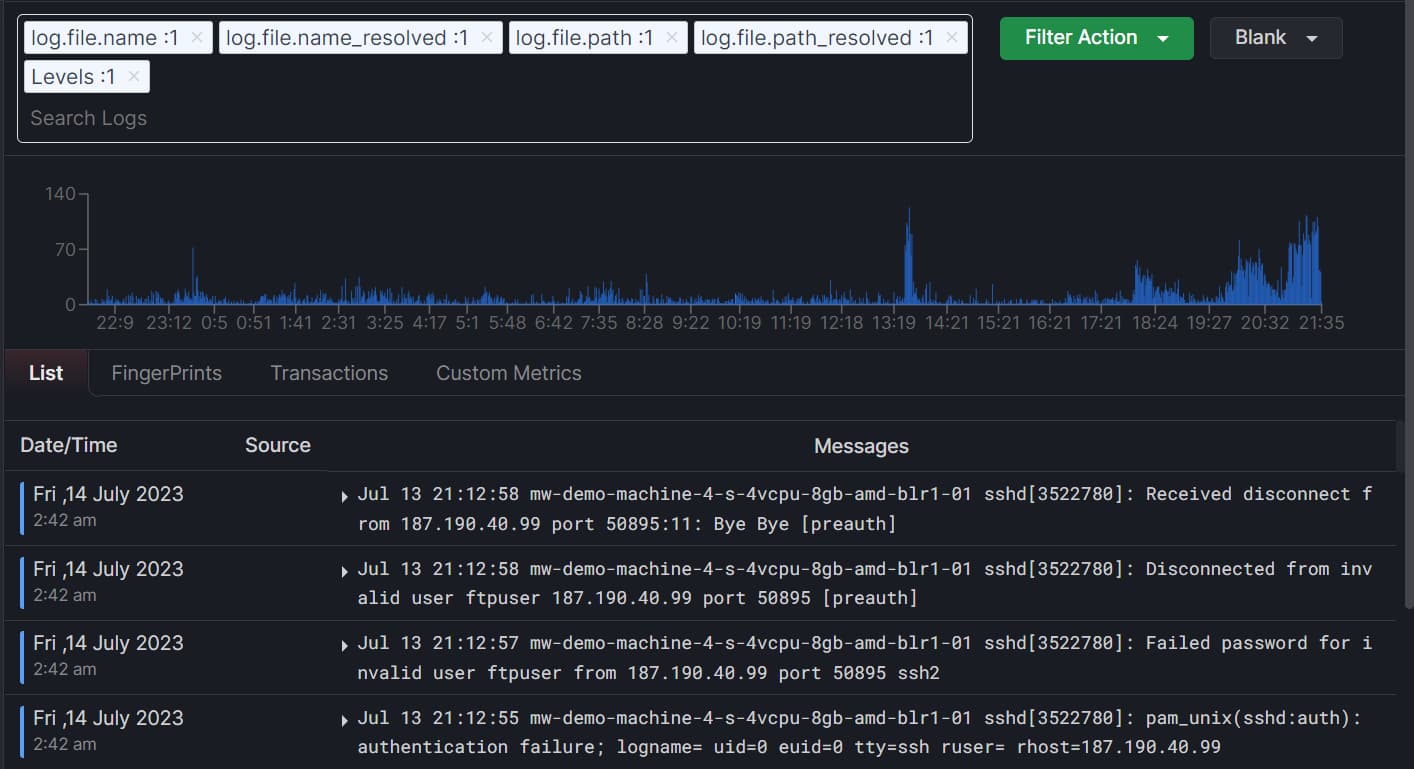
In the middleware dashboard, when you click on the search bar, you can see a list of options that you can use to search your log queries.
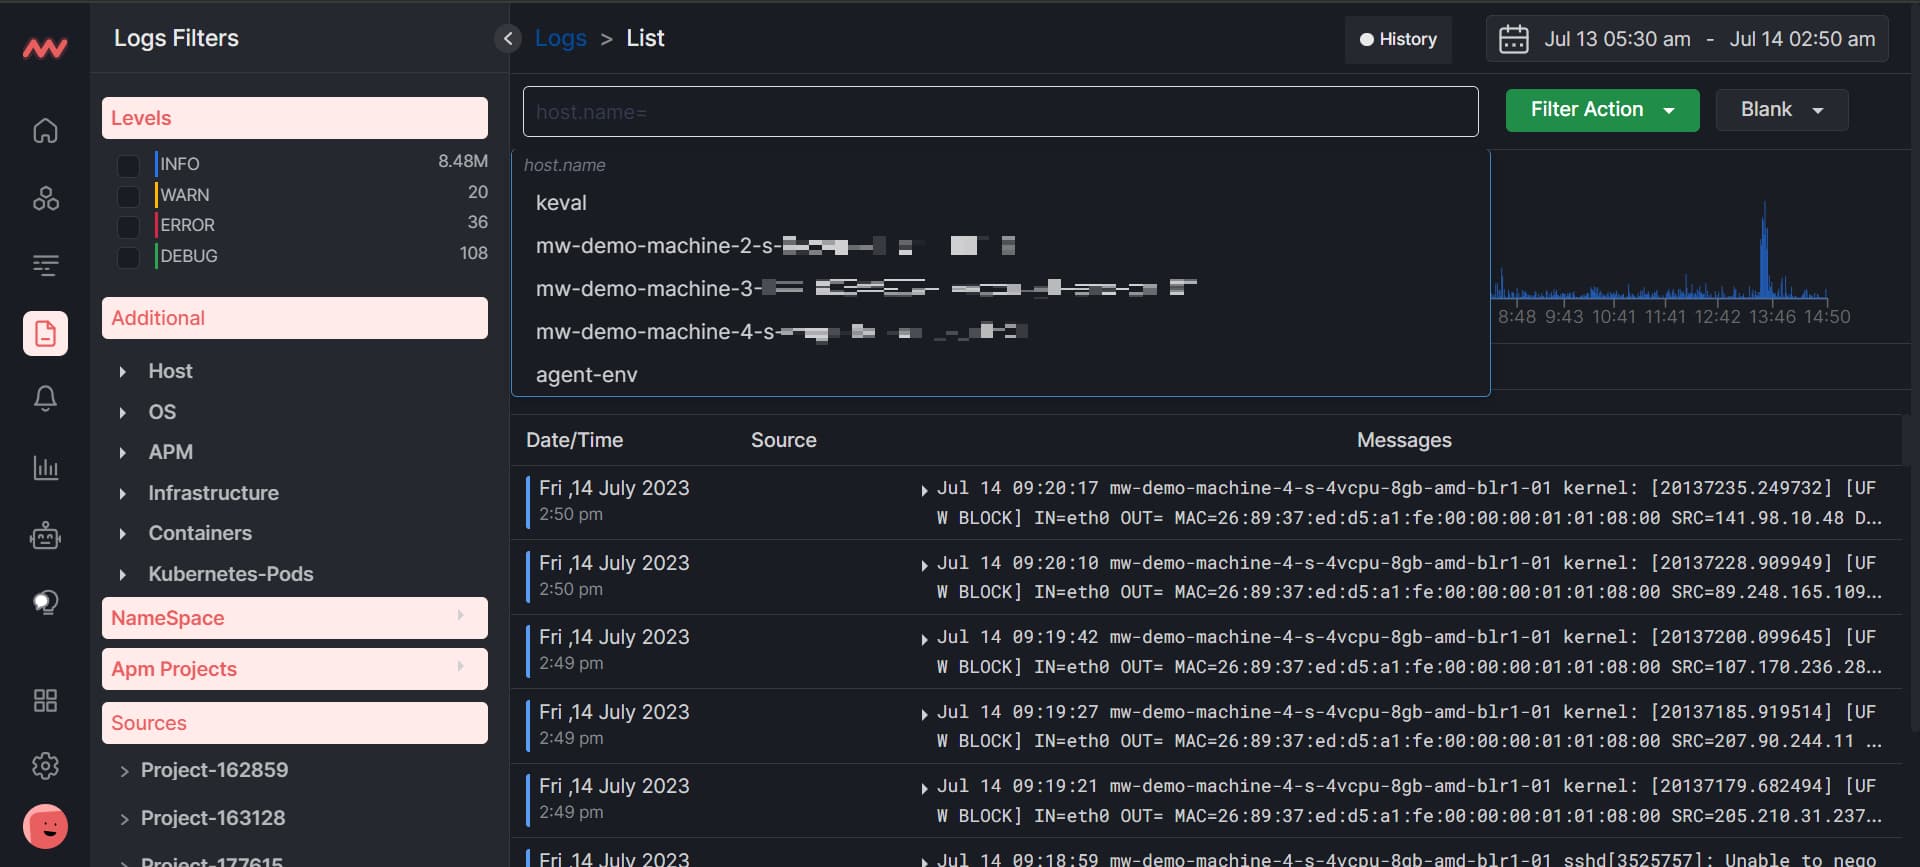
Suppose you select a hostname from the above options. Then, you will be presented with a list of hostnames to select. You can click on any hostname according to your requirement, and all the logs will be arranged according to the selected hostname.
You can also search for the next queries along with other search queries. For example, we searched for the log file name and chose auth.log as a log file name. Similarly, you can search for other log queries and quickly see the results.
Another thing that you can do is that, if you want to search for the error level live, first select the error level by using the search bar and then click on the live. So all the logs that have some errors will appear live.
Save filters for frequent use cases
The save filter option is amazing for frequent use cases. Keeping track of different queries and repeatedly re-entering them can be time-consuming and error-prone.
Middleware has a great feature for saving queries with a name to reduce MTTR and the number of users recalling and re-entering queries manually. You can use this feature each time you search for the same query.
As you can see in the above image, we first need to search for particular logs. Then, click the Filter Action button and Save to a New Filter. You will be asked to give a name and save it.
To use the query again, click on the Blank button to see the list of your saved queries. You can access it with just one click. This is how save filters are useful, as they save a lot of time from rewriting the query.
Easy Interpretation and Troubleshooting
Many errors can occur, such as failed passwords, disconnected from users, and authentication failures. Log monitoring tools like middleware can help you identify and interpret all of these issues.
Suppose you are searching for an error and want to know how many logs contain the same error. To do this, simply select the text, and two circular buttons will pop up, as you can see below.
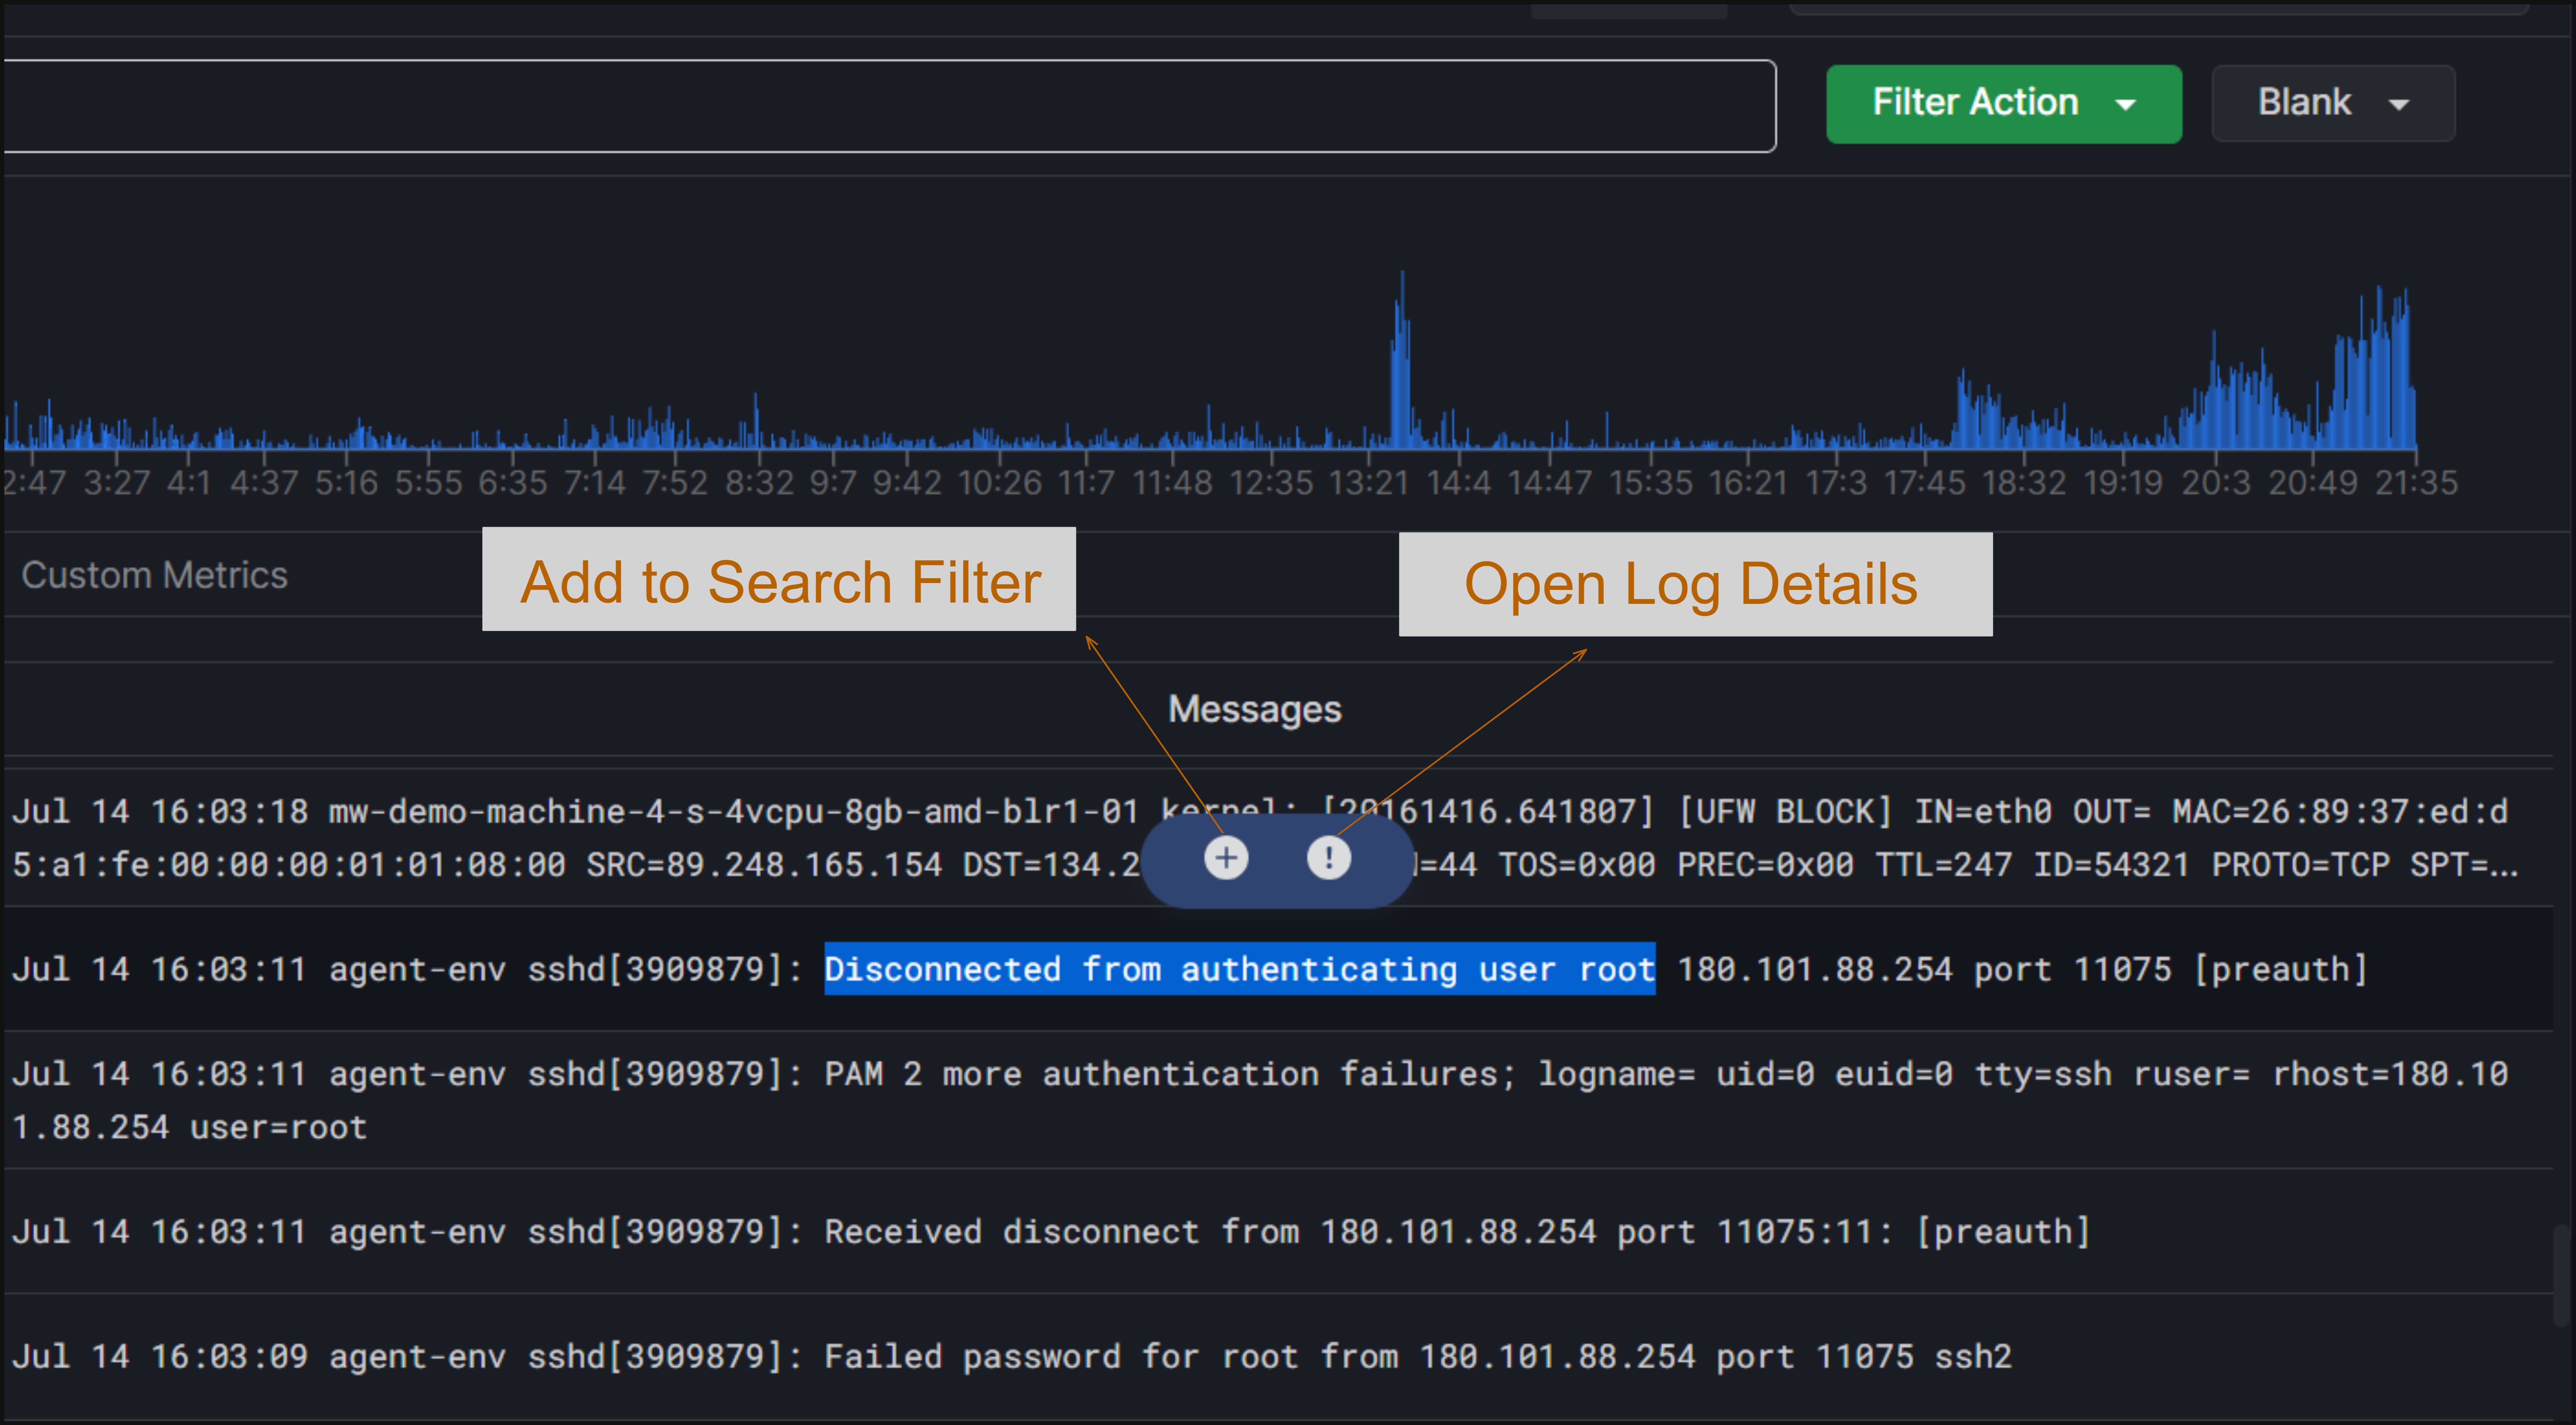
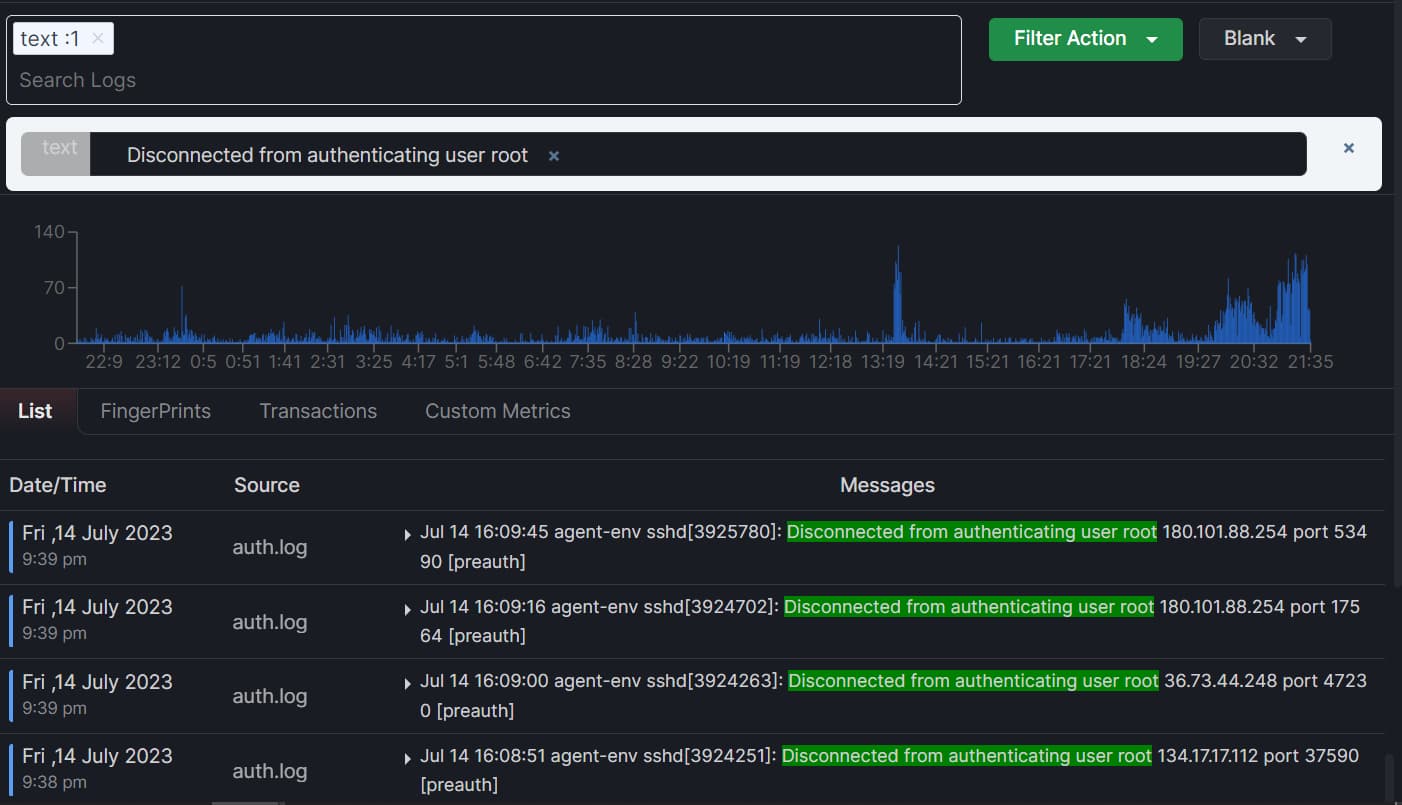
The (+) button is used to add a message to the search filter. For example, if you have selected the message “Disconnected from authenticating user root”, you can click the (+) button to search for all logs containing the same error.
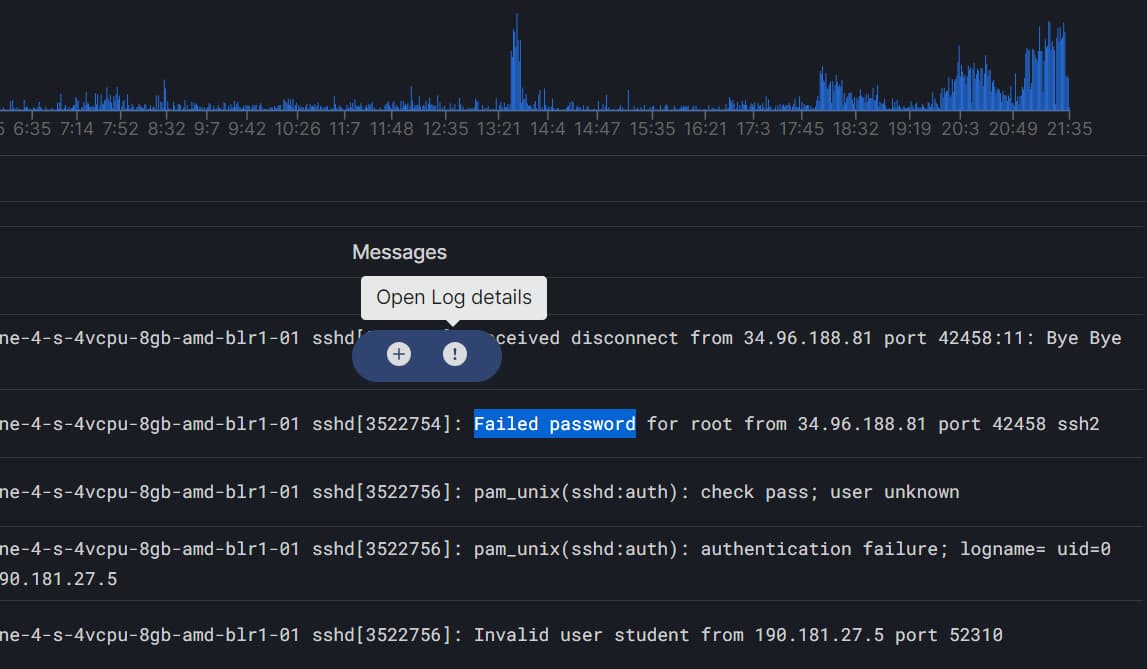
Now, to open the log details of any error message, simply select the message and click on the (!) button
After clicking on the (!) button, the details of the error message will appear. The tags will also appear. Click on the Show in content button to see all the messages with these tags.
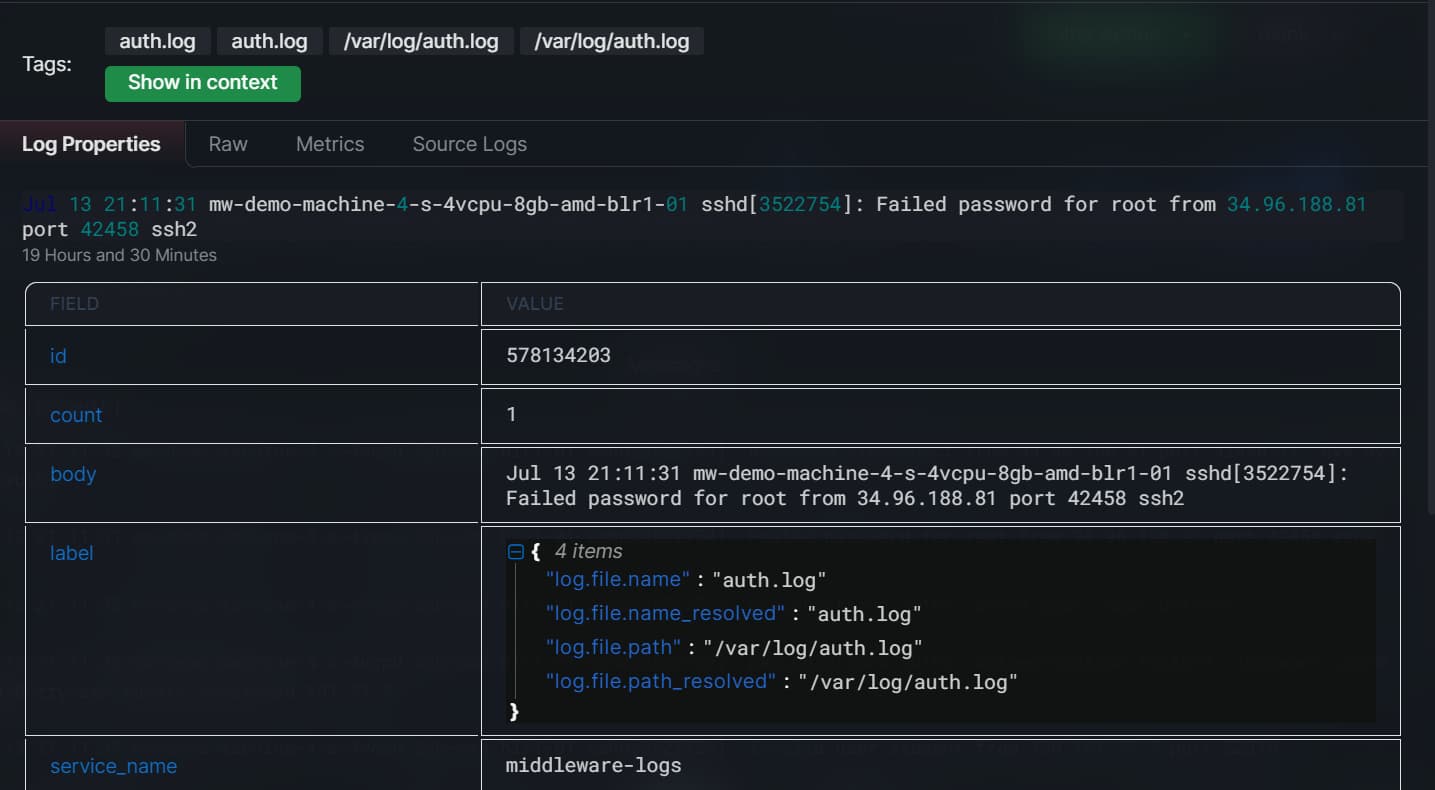
You can easily troubleshoot these error messages, as you will have all the details about the error, such as the log file name, the log file path, and so on.
Final thoughts on Log searching
Log searching can be easy if done right! You can perform many time-consuming tasks effectively and in minutes.
To this end, Middleware is a good choice for searching logs. It helps you save and reuse search queries for faster troubleshooting, view historical log data with the time travel feature, and improve troubleshooting and problem resolution by providing a comprehensive view of system and application behavior.
Middleware also allows you to set alert thresholds to ensure only relevant alerts are sent. With a single script installation, you can easily obtain your environment’s 100% logs and store them in your cloud to reduce costs by 10X.
Try middleware today! It’s free.
How do you search logs?
To search logs, use a command like grep followed by the search term and the log file path. To make things a lot easier, you can try observability platforms like Middleware.
How do you search large log files?
To search large log files efficiently, consider using tools like grep with the -i (case-insensitive) and -r (recursive) options. Additionally, tools like awk or sed can help extract specific information. If dealing with extremely large files, tools like logrotate or zgrep (for compressed logs) can be useful.
How to analyze logs?
To analyze logs, start by identifying relevant information using tools like grep, awk, or sed to filter and extract data. Utilize log analysis platforms such as ELK Stack (Elasticsearch, Logstash, Kibana) for more advanced analysis, visualization, and correlation. Monitoring tools like Middleware or Grafana can provide insights through dashboards, alerts, and statistical analysis of log data.
How can we check logs?
To check logs, use commands like cat, tail, or less to view log files directly. For specific searches, employ grep to find lines containing a particular keyword. Additionally, tools like journalctl for systemd logs on Linux or event viewer on Windows offer a structured view.