
When building software, developers usually write and run tests before merging code into the main branch to ensure logic is correct before deployment.
Yet, some issues, especially those caused by unpredictable user behavior, only appear after release. Live production debugging is the process of identifying, reproducing, and resolving issues while your application is running in production, without affecting end users. Observability tools, such as middleware, are invaluable in this workflow, as they provide real-time monitoring, error tracing, and contextual insights across your frontend and backend systems.
What Is Real User Monitoring (RUM)?” helps expand on RUM overview and its relevance alongside browser testing.
How Middleware Simplifies Your Debugging Workflow
Middleware is an all-in-one observability and debugging platform that unifies monitoring across cloud, backend, web, and mobile environments. It detects deployment issues before they affect users.
One of Middleware’s core strengths is context-aware debugging, which lets you observe your software in real-time before taking any corrective action. You can correlate logs, front-end events, and backend metrics from one unified dashboard.
Whether managing servers, APIs, or databases, Middleware centralizes everything. You can:
- Set custom alerts to automatically detect anomalies.
- Correlate traces, metrics, and logs to identify root causes.
- Resolve issues faster without switching tools or dashboards.
This unified visibility makes Middleware a natural fit for live debugging in production-grade environments.
Step-by-Step Guide: Debugging a Live Production Issue
In this live debugging walkthrough, we’ll use a ReactJS project as an example. Specifically, we’ll use Middleware’s Browser Real User Monitoring (RUM) API to track activity and resolve a bug in a Next.js application.
Step 1. Identify the Issue
Start by detecting anomalies in production. Middleware can help you capture:
- Frontend errors: JavaScript exceptions, failed API calls, or slow page loads.
- Backend errors: API failures, database errors, or microservice communication failures.
- User experience issues: Button clicks not registering, broken forms, or missing data.
How Digital Experience Monitoring Transforms User Journeys Across Web & Mobile, this ties directly to user journey monitoring and real-user insights.
Use Middleware alerts to flag unexpected events. For example:
- Unexpected API response times
- User-facing errors like form submission failures
- Third-party service failures
By setting up real-time alerts, you can immediately investigate issues before they escalate.
Step 2. Set up Middleware in Your Application
Start by creating an account on Middleware. Once you’re logged in, navigate to the Front-End Monitoring documentation and locate the Browser Real User Monitoring section. You’ll find a code snippet similar to this one:
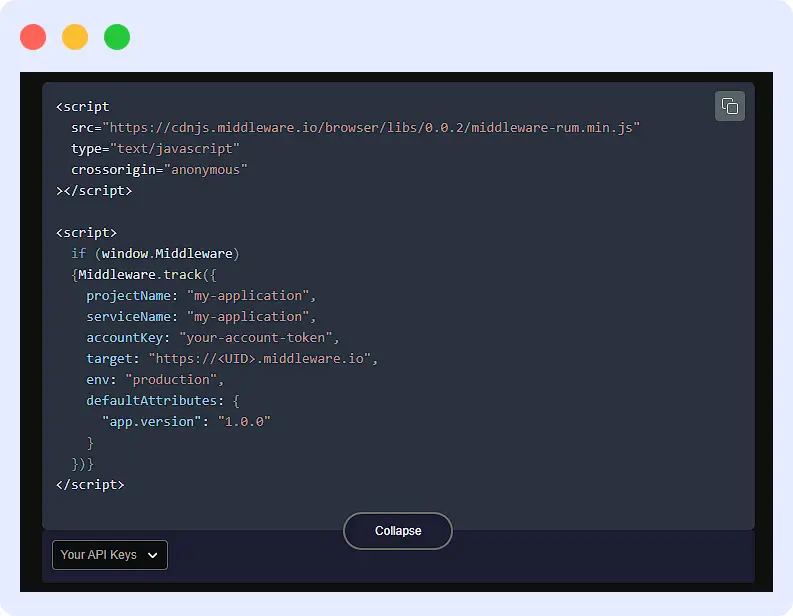
The above code works for any vanilla JavaScript or React application that includes an index.html file or template. However, in Next.js, a full-stack React framework, we’ll need to add this script manually.
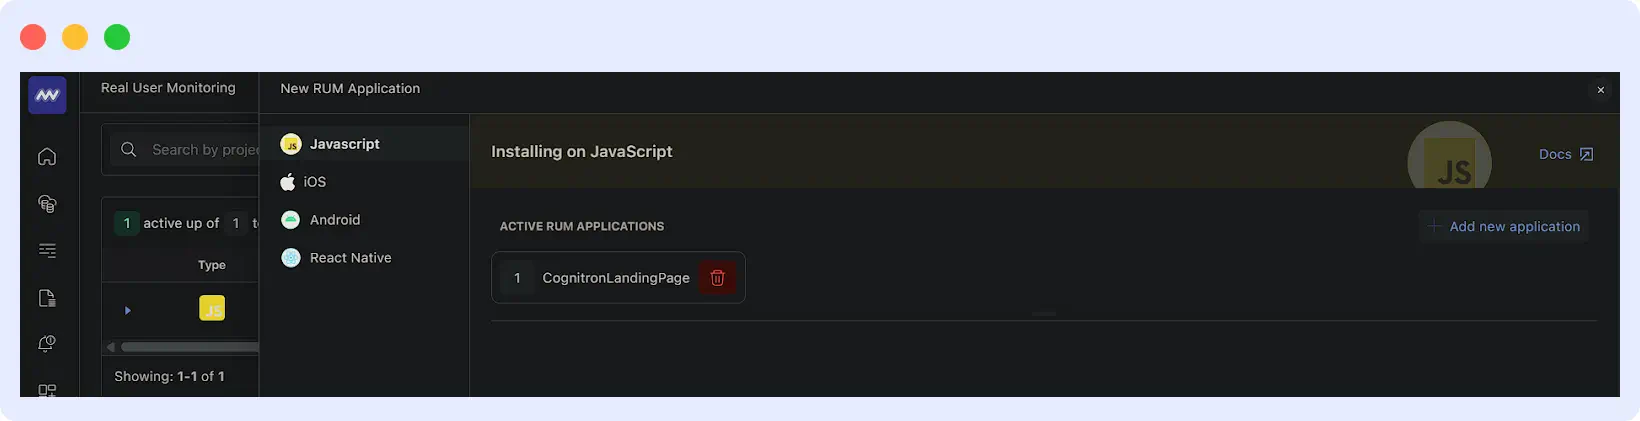
- After signing up with Middleware, navigate to the RUM (Real User Monitoring) panel to create and configure your application.
- Click the “Add New Application” button on the right side of the panel to create a new JavaScript application. This will open a setup window where you can specify your app details and configuration.
- The previous action opens a new window where you can select your application type: JavaScript (which includes React and NextJS apps), React Native, or Android.
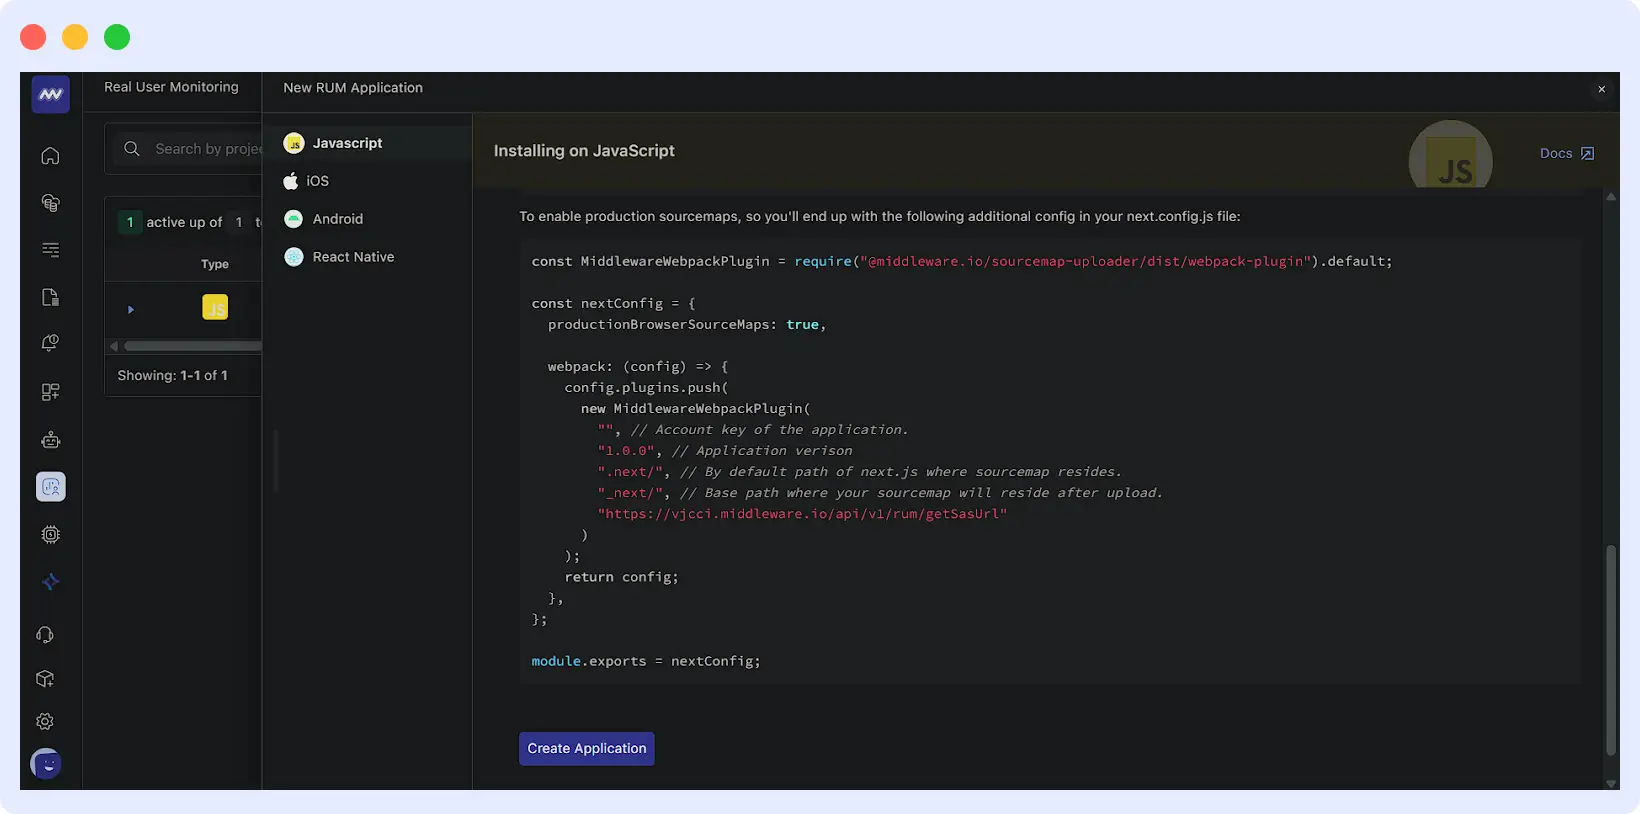
- Click the “Add New Application” button again on the right to start creating your RUM application in Middleware. A form will appear where you can enter the required details, such as the project name and website URL.
- Be sure to replace the placeholder values with your actual website URL and choose a project name that best represents your application. Once done, scroll down and click “Create Application.”
- Once you create your application, the script will automatically be populated with the correct data, including your API keys, project name, and target URL. This is the script you’ll integrate into your application to begin monitoring activity.
- Next, navigate to the RUM dashboard, where your newly created app will be listed. For this tutorial, we’re using an existing app that mirrors a real sample project on GitHub.
- Next, click on your application in this example, “CognitronLandingPage” to open its dedicated dashboard. If the application is newly created, the dashboard will initially appear empty until real-time data begins to flow in.
- Now that your application is set up, your API keys are ready to be integrated into your live project. To access them, click on the settings icon located at the top left, next to your application name, and scroll down to view your credentials.
Step 2. Reproduce the Issue Safely
Once an issue is detected:
- Use Middleware session replay to observe the user journey leading to the error. This provides the exact steps and context.
- If the issue occurs in a backend service, check trace data and logs to reproduce the scenario.
- Create a staging environment mirror with live-like traffic, if possible, to safely test fixes without affecting production users.
Tip: Always document the conditions under which the error occurs (browser, OS, network speed, API state).
To capture these details automatically and gain deeper insight into real user behavior, you can integrate Middleware RUM into your Next.js application.
Integrate Middleware RUM Script in NextJS
Since Next.js applications don’t include a standard HTML template, you’ll need to manually inject the Middleware RUM script. This step replicates the script integration process outlined in the RUM documentation.
- Create a new file named
_document.jsinside your project’spagesfolder, and add the following code:
// pages/_document.js
import { Html, Head, Main, NextScript } from 'next/document'


export default function Document() {
  return (
    <Html lang="en">
      <Head>
        {/* Middleware RUM script */}
        <script
          src="https://cdnjs.middleware.io/browser/libs/0.0.2/middleware-rum.min.js"
          type="text/javascript"
          crossOrigin="anonymous"
        ></script>
        <script
          dangerouslySetInnerHTML={{
            __html: `
              if (window.Middleware) {
                Middleware.track({
                  serviceName: "CognitronLandingPage",
                  projectName: "CognitronLandingPage",
                  accountKey: "tavdocxzjefqwscdeyhudubufnmrwofmgynf",
                  target: "https://vjcci.middleware.io",
                  tracePropagationTargets: [""],
                  defaultAttributes: {
                    "app.version": "1.0.0"
                  }
                });


                // Delay test log until after Middleware initializes
                setTimeout(() => {
                  if (window.Middleware && typeof window.Middleware.info === "function") {
                    console.clear();
                    console.log("✅ Middleware RUM for CognitronLandingPage loaded!");
                  } else {
                    console.warn("⚠️ Middleware SDK not fully initialized yet.");
                  }
                }, 5000); // wait 5s before trying
              }
            `,
          }}
        />
      </Head>
      <body>
        <Main />
        <NextScript />
      </body>
    </Html>
  )
}- In the first section of the snippet, the Middleware application is initialized. The second section defines a log function that confirms Middleware was successfully installed. This function executes after five seconds, giving enough time for initialization, even on slower networks.
- The Middleware API is injected into your application via a custom script defined under the
dangerouslySetInnerHTMLattribute, enclosed in backticks. Middleware helper functions must be defined within these backticks; placing them outside will cause them to fail. - It’s recommended to avoid defining these functions globally to maintain a clean global scope.
- Run a local build and start your Next.js application with the following command:
npm run build && npm run start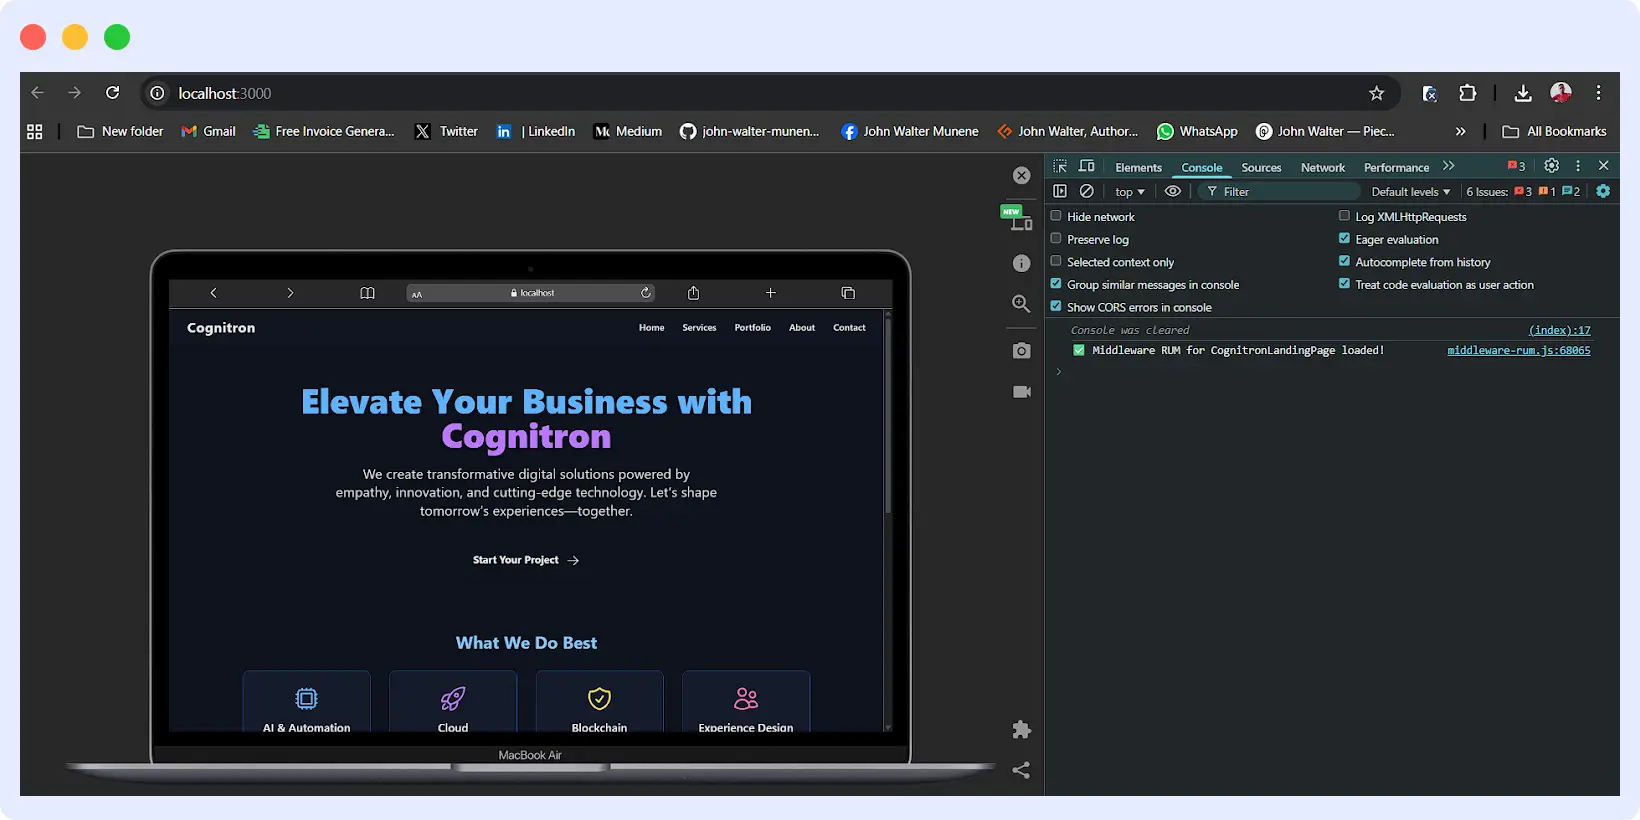
Open your web application and check the browser console. You should see a log confirming that the Middleware API is active and running correctly.
👀Want to see user interactions in action? Explore how Middleware can monitor user journeys with browser tests →
For production, these changes would be applied via a pull request (PR). For demonstration purposes, running the app locally (localhost:3000) is sufficient to verify Middleware integration.
Step 3. Trace Root Cause
Identify where the error originates:
- Frontend debugging: Inspect client-side logs, failed API calls, and user interactions captured by Middleware.
- Backend debugging: Analyze trace spans, logs, and error messages to pinpoint service failures.
- Third-party services: Middleware can highlight which external API calls fail and why.
The key is correlating frontend, backend, and external data to locate the root cause efficiently.
With the application running smoothly, configure alerts and start tracking user sessions to capture performance metrics, detect anomalies, and identify real-time issues.
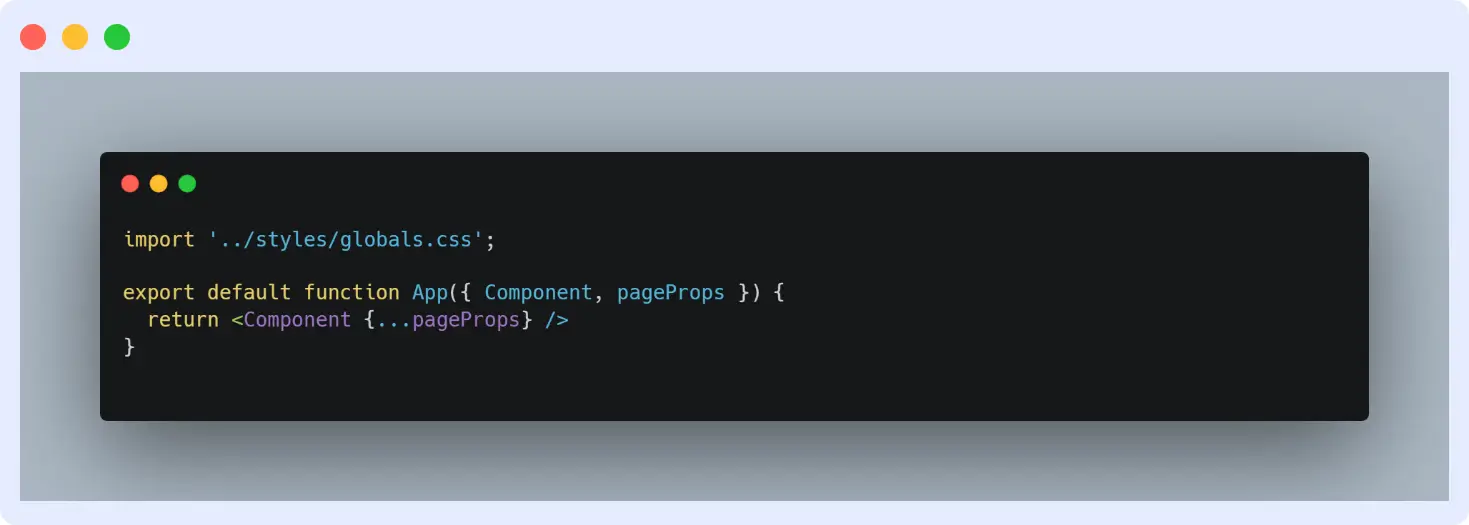
Update the application entry file to integrate Middleware tracking and alert functionality:
// pages/_app.js
import '../styles/globals.css'
import { useEffect } from 'react'


export default function App({ Component, pageProps }) {
  useEffect(() => {
    if (typeof window === "undefined") return


    const mw = window.Middleware
    if (mw && typeof mw.track === "function") {
      try {
        mw.track({
          projectName: "my-application",
          event: "PageLoad",
          attributes: {
            path: window.location.pathname,
            timestamp: new Date().toISOString(),
          },
        })
        console.log("📡 Middleware.track PageLoad")
      } catch (err) {
        console.warn("⚠️ Middleware.track PageLoad failed", err)
      }
    }
  }, [])


  return <Component {...pageProps} />
}
This React hook ensures the Middleware API runs only on the client side, triggering every time a user opens a page.
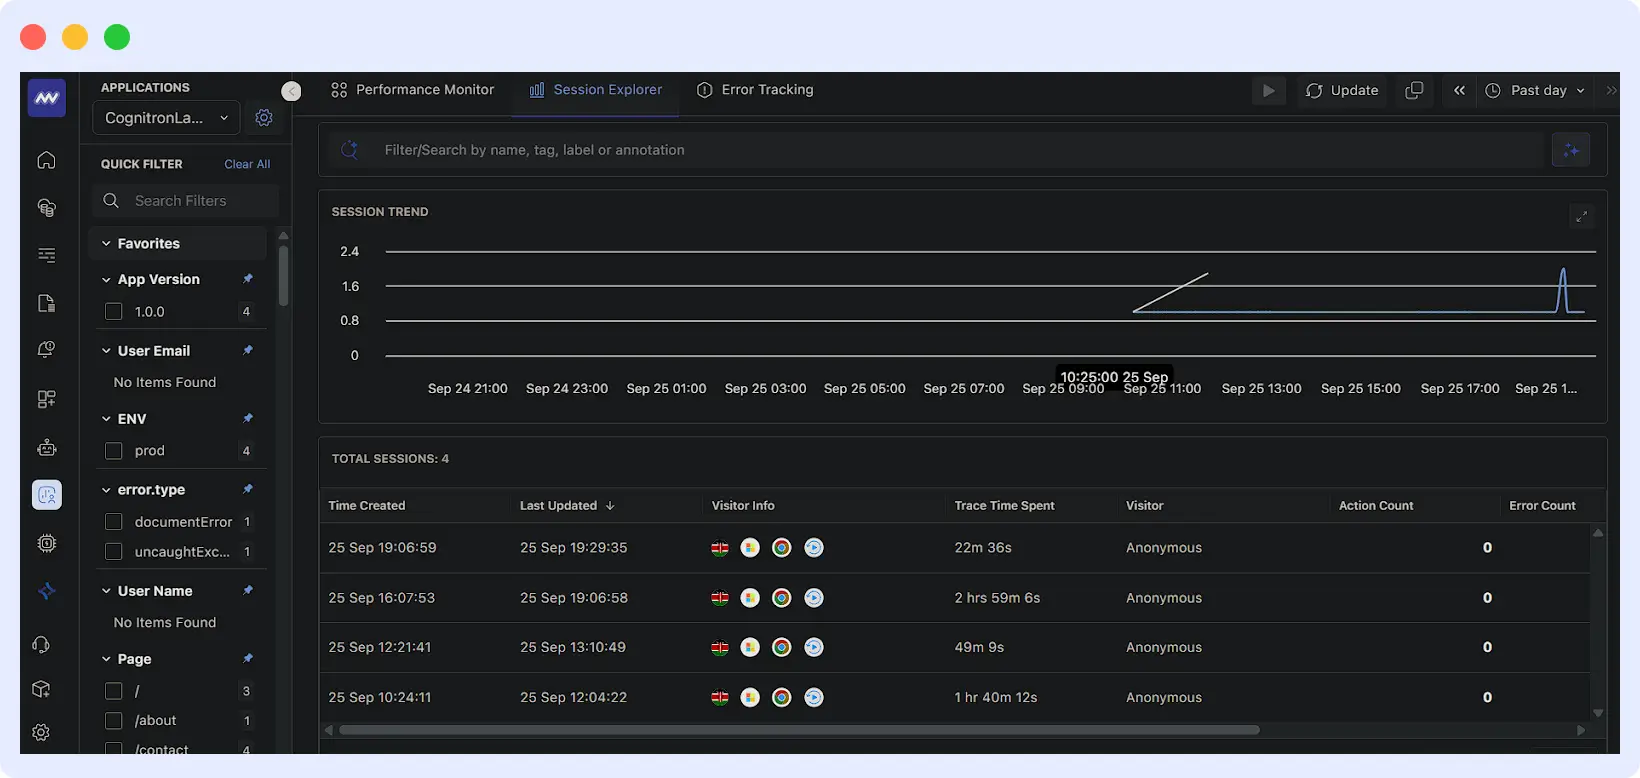
Next, return to the Middleware dashboard and open your application (e.g., Cognitron). You’ll see a list of user sessions recorded on your website. Active sessions confirm that integration was successful.
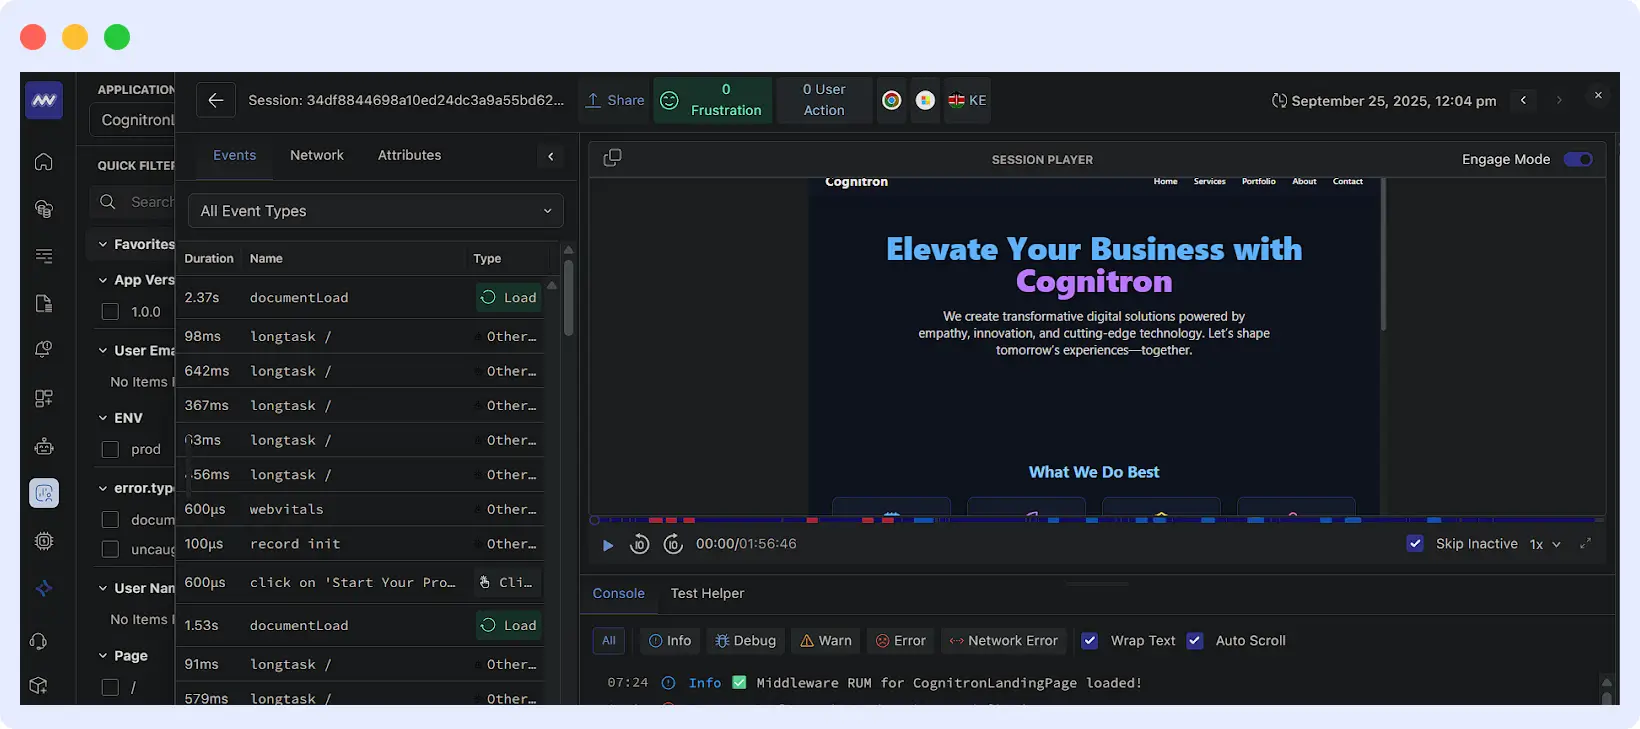
Click any session to view detailed insights. Session replays let you observe user journeys and investigate specific actions or events in detail.
Step 4. Fix the Issue
After identifying the root cause:
- Apply a fix in the codebase. For example:
- Correct input validation issues in forms
- Handle API errors gracefully
- Optimize backend query performance
- Test the fix in a controlled environment, preferably staging with simulated traffic.
- Once verified, create a pull request and merge into the production branch. Middleware can help verify that the fix resolves the issue by tracking subsequent sessions.
Using Ops AI for Debugging and Optimization
Ops AI can significantly enhance your production debugging workflow by providing:
- Intelligent error detection: Automatically detect anomalies in user interactions, API responses, and performance metrics.
- Root cause analysis: Suggest potential causes of issues by correlating frontend, backend, and database logs.
- Automated optimization recommendations: Advise on code improvements, performance enhancements, and query optimizations.
- Proactive monitoring: Predict potential issues before they impact users and suggest preventive fixes.
👉 Learn more about OpsAI by Middleware, the AI-driven engine that detects and correlates system-wide issues automatically.
For example, Ops AI can analyze navigation behavior in your Cognitron landing page and highlight which buttons or flows are underperforming. This helps prioritize fixes and optimize user experience more efficiently.
Tracking Navigation Interactions
To track navigation clicks in each user session using Middleware and Ops AI:
⚡ Want to see how OpsAI detects root causes in your environment? Request a Demo
// --- Middleware Event Tracker placed after state definition ---
  const trackNavClick = (label, path) => {
    if (typeof window === "undefined") return;


    const mw = window.Middleware;
    const payload = { label, path };


    if (mw && typeof mw.track === "function") {
      try {
        mw.track({
          projectName: "my-application",
          event: "NavbarClick",
          attributes: payload,
        });
        console.log("📡 Middleware.track succeeded", payload);
      } catch (err) {
        console.warn("⚠️ Middleware.track failed", err);
        console.log("📡 Fallback console log", payload);
      }
    } else {
      console.log("📡 Middleware not ready — click:", payload);
    }
};- Add this tracker to your navigation component:
return (
    <nav>
      <div>Cognitron</div>


      {/* Desktop Nav */}
      <div>
        <Link href="/" onClick={() => trackNavClick("Home", "/")} >Home</Link>
        <Link href="/services" onClick={() => trackNavClick("Services", "/services")} >Services</Link>
        <Link href="/portfolio" onClick={() => trackNavClick("Portfolio", "/portfolio")} >Portfolio</Link>
        <Link href="/about" onClick={() => trackNavClick("About", "/about")} >About</Link>
        <Link href="/contact" onClick={() => trackNavClick("Contact", "/contact")} >Contact</Link>
      </div>

      {/* Do the same for mobile and tablet views */}
    </nav>
);- Let’s set up our first alerts. In this section, we’ll simulate a demo error to see how Middleware captures and displays it in real time.
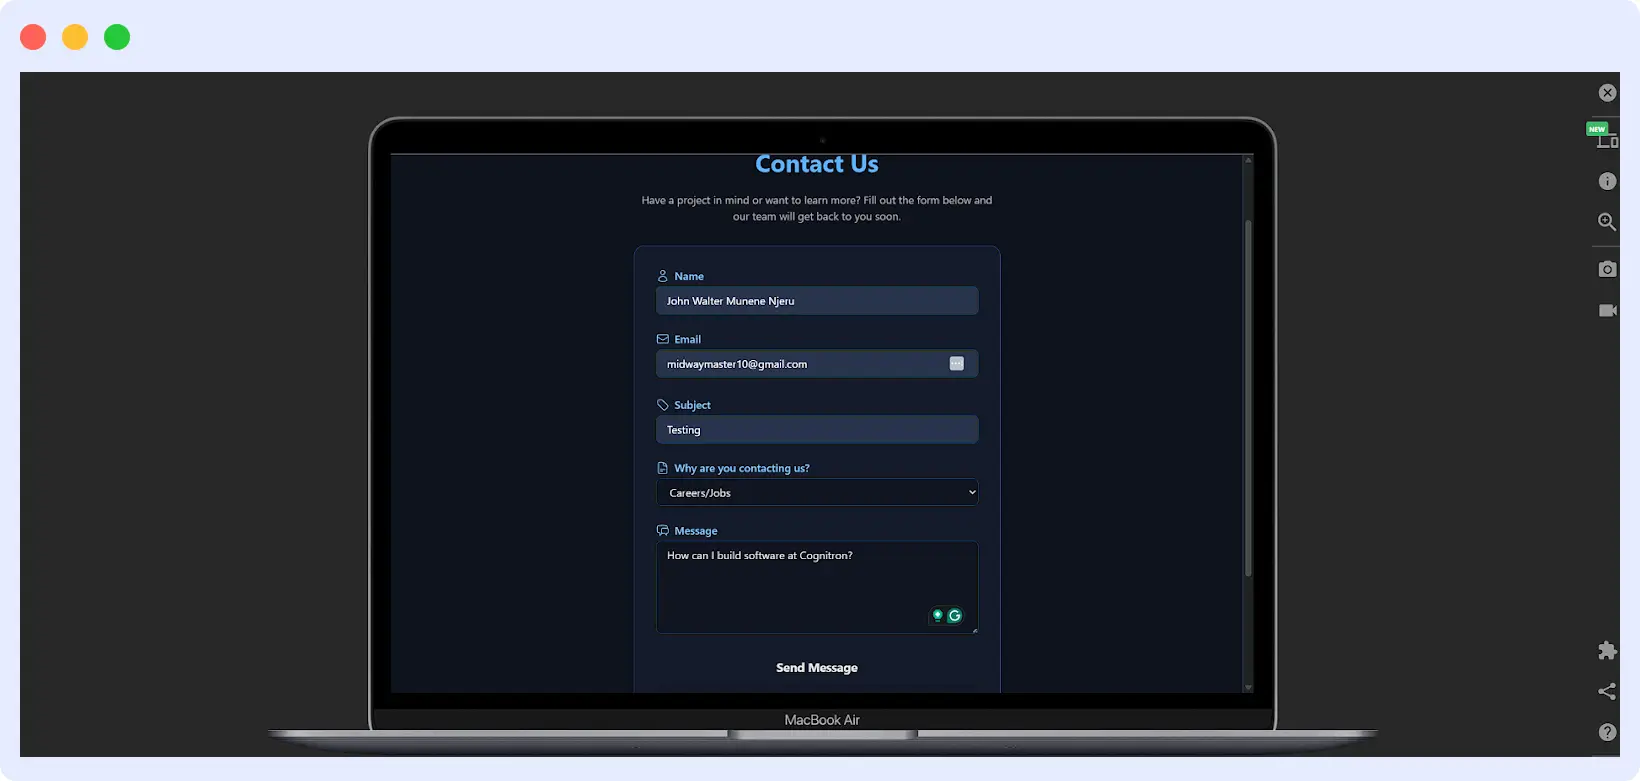
- Imagine the Cognitron application handling form submissions where users input data that’s processed and sent to the backend. The app validates inputs, detects errors, and provides real-time feedback to users.
- This setup ensures that every form submission is accurately tracked, allowing Middleware to monitor and log any performance issues or delays that may occur during the process.
- In a typical workflow, when a third-party API is involved, it can be challenging to verify whether the submission was actually successful. The user interface may display a success message even if the backend API call fails silently.
- From the user’s perspective, the form appears to have been successfully submitted, but an error may occur behind the scenes. Middleware automatically captures these client-side errors, providing developers with the necessary logs to review and resolve issues.
- The next step is to update the form component with tracking logic so that Middleware can capture these events in real-time.
const handleSubmit = (e) => {
  e.preventDefault(); // Stop the form from actually submitting
  setSubmitted(true);


  const mw = window.Middleware;
  const payload = { reason, page: "Contact" };


  if (mw && typeof mw.track === "function") {
    try {
      mw.track({
        projectName: "my-application",
        event: "ContactFormError", // Event to simulate an error for demo
        attributes: payload,
      });
      console.log("📡 Middleware.track sent", payload);


      // Optional: throw an error to demo session replay/error tracking
      throw new Error("Intentional Contact Form error for demo");
    } catch (err) {
      console.warn("⚠️ Middleware.track or demo error caught:", err);
    }
  } else {
    console.log("📡 Middleware not ready — fallback log", payload);
  }
};- Now, head back to the Session Explorer in your Middleware dashboard and open the most recent session where the form submission with an error occurred.
- You’ll notice detailed logs displayed on your dashboard, capturing the exact moment the issue took place, including the error message, affected component, and timestamp. This helps you trace and understand what went wrong during the submission process.
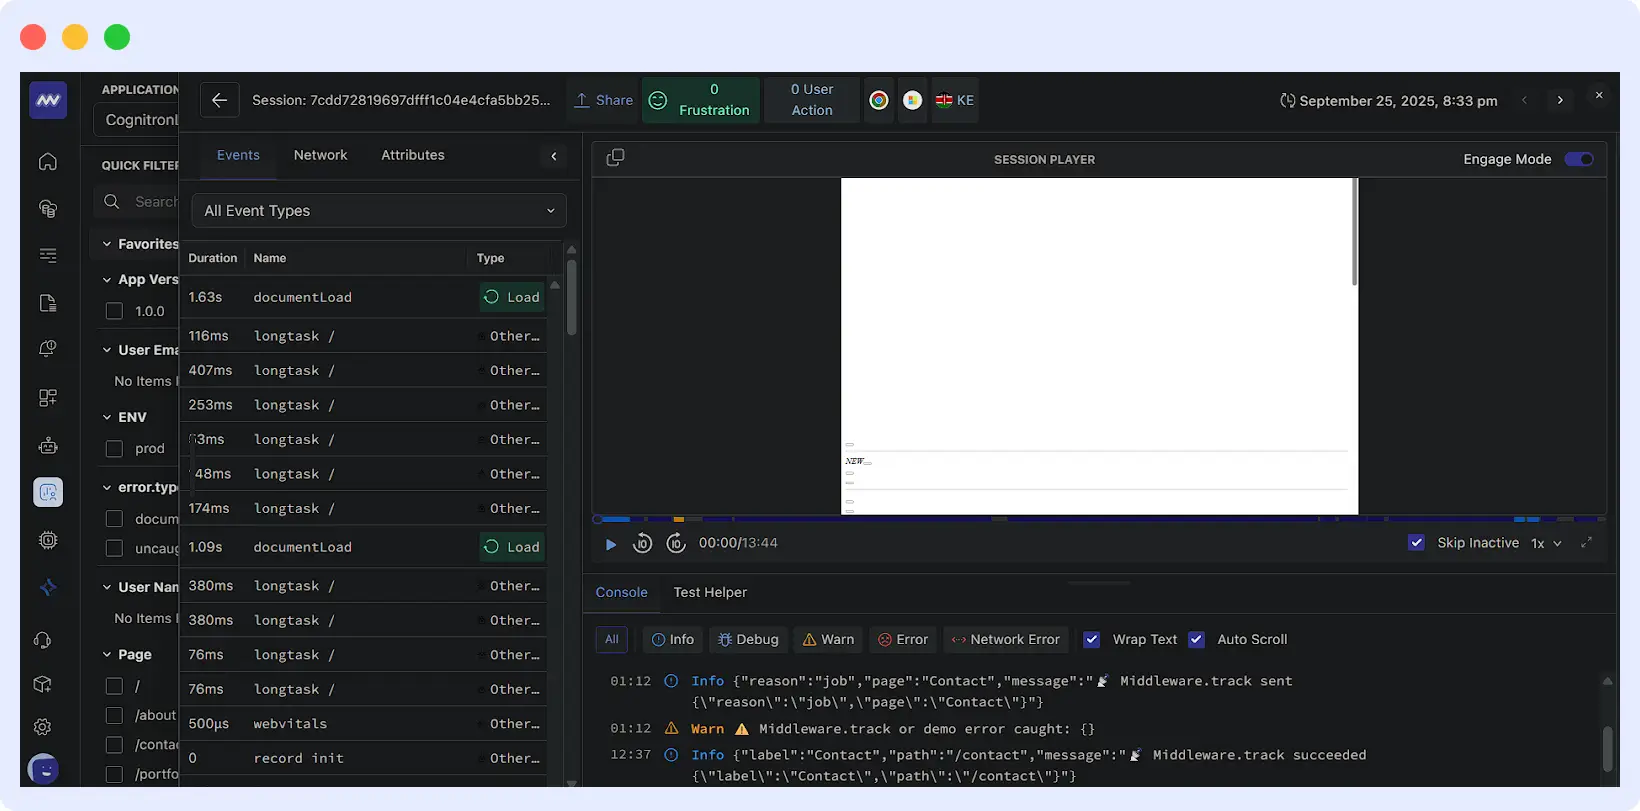
- Middleware automatically captured the error, and detailed information can be found below the session replay. If this issue had originated from a third-party API, Middleware would have identified and reported which external service failed during the request.
- The demo error provides enough information to trace the issue back to the source code. By correcting the intentional error, the problem is resolved, ensuring the application functions as expected. The Middleware dashboard also offers a comprehensive interface to explore device-specific attributes and other contextual data for each error.
- Replicate the error using the session replay as a reference. Once the application behaves as expected, your code changes are safe to merge into the main branch. After fixing the issue, thoroughly test the application and redeploy the updates. Finally, create a pull request in your version control system to merge the resolved code into production.
At this point, you can use OpsAI Copilot to apply the correct fix to a live production issue and generate a pull request ready for redeployment.
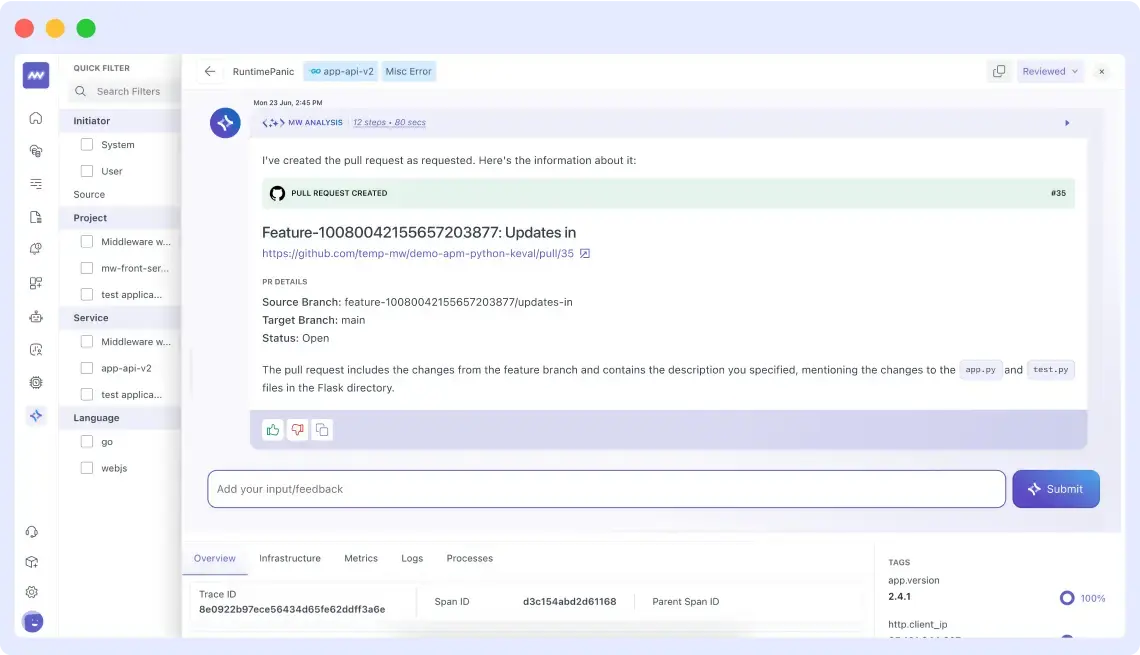
👉 Want to try it yourself? See how to set up GitHub Integrations and connect Middleware Ops AI with your repo in minutes.
Step5. Verify With Live Monitoring
After deployment:
- Monitor the affected flows using Middleware dashboards.
- Ensure no new errors appear in the sessions previously affected.
- Check that metrics like response times, API success rates, and error logs return to normal levels.
Middleware allows you to validate fixes in real time and catch regressions immediately.
Step 6. Retrieve Additional Data if Needed
For issues that involve user-generated data, Middleware can track payloads for debugging:
- Capture form input, session context, and device information.
- Recover potentially lost data for failed submissions.
- Provide detailed insights to support debugging and reporting.
This ensures you don’t lose valuable information during production errors.
Middleware can also help track how microservices interact in production environments. If a failure occurs, you can retrieve submitted data, such as form inputs or API request payloads, by capturing them as attributes through the monitoring API. This ensures that no critical data is lost and provides developers with full context to resolve issues quickly.
try {
    // Attempt API call
    await fetch('api/contact', { method: 'POST', body: JSON.stringify(( name, email, message))});
} catch (err) {
    if (window.Middleware) {
        window.Middleware.track({
            projectName: 'my-application',
            event: 'ContactFormError',
            attributes: {
                name, email, message, errorMessage: err.message,
                timestamp: new Date().toISOString(),
            }
        });
    }
}
The submitted data, such as name, email, message, and other relevant fields, becomes part of the error logs and can be retrieved later for analysis. You can view these details directly in the Middleware dashboard’s error console.
Keep in mind that this retrieval works only if Middleware is already integrated into your application. By using Middleware as an observability tool, you can catch errors in production and recover potentially lost data, ensuring smooth software delivery and minimizing disruptions for users.


