
High API latency frustrates users and can drive them to competitors. Monitoring and reducing latency is essential for a smooth user experience and system reliability.
For this reason, user experience and system reliability depend on the latency. Most of the time, the problem originates from API latency, which poor backend code, slow databases, or slow networks can cause.
The good news is that with Middleware APM, you don’t have to guess where the problem is coming from. You can detect latency issues early, identify the root cause, and resolve them before they affect users. In this article, you’ll learn how to use Middleware APM to detect and reduce API latency.
What is API latency?
API latency refers to the time it takes for an API to receive a request, process it, and send a response back to the user. It displays the wait time for users accessing your API.
Many people often confuse latency and throughput, so let me explain the difference between them. You can determine your system’s capacity to handle calls by examining its throughput, which indicates the number of calls it can process per unit of time, and its latency, which measures the time it takes to process each call.
Some systems have both high throughput and high latency. This means that they can handle a large number of requests simultaneously, but each one takes a considerable amount of time.
Some of the causes of high API latency include:
- Network delays: Problems with routing, physical distance, and network congestion
- Third-party packages: Calls to external APIs and service integrations
- Backend processing issues: Insufficient server resources and scaling problems
- Infrastructure limitations: Insufficient server resources and scaling problems
When you understand the causes of latency, it’ll be easier for you to handle it effectively.
How to Use Middleware APM to Fix API Latency Problems
With the aid of middleware’s extensive monitoring features, you can see how well your API is performing in real-time and spot problems before they become serious.
In this section, we’ll go through the complete process of setting up Middleware APM for a Node.js application. You’ll learn how to install and configure the monitoring agent and utilize Middleware’s dashboard to identify and resolve performance issues to their root cause.
Note: This approach also works for other languages. The only difference is the installation and configuration. You can use the ideas from this guide to work with different languages.
Set Up a Simple Project
We need an application to work with before we can monitor API latency. A Node.js CRUD API that handles user data will be used for this demonstration.
We will later on include a couple of endpoints that simulate high and low latency scenarios. This will help us identify how different types of operations are displayed in the Middleware monitoring dashboard.
Here’s how to set up the project:
1. Install dependencies
You need to install Express.js, cors (if you’re using it with a frontend app), and Nodemon (to restart the server while you work on it) if you’re using Node.js.
2. Update package.json scripts
3. Create a server.js file and add the code
const express = require('express');
const cors = require('cors');

const app = express();
const PORT = 4000;

app.use(cors());
app.use(express.json());

let users = [];
let userID = 1;

app.post('/users', (req, res) => {
    const {name, email} = req.body;
    const newUser = {id: userID++, name, email}
    users.push(newUser);
    res.status(201).json(newUser);
});

app.get('/users', (req, res) => {
    res.json(users);
});

app.get('/users/:id', (req, res) => {
    const user = users.find(u => u.id === parseInt(req.params.id));
    if(!user) return res.status(404).json({message: 'User not found'});
    res.json(user);
});

app.put("/users/:id", (req, res) => {
  const user = users.find(u => u.id === parseInt(req.params.id));
  if (!user) return res.status(404).json({ message: "User not found" });

  const { name, email } = req.body;
  user.name = name || user.name;
  user.email = email || user.email;
  res.json(user);
});

app.delete("/users/:id", (req, res) => {
  users = users.filter(u => u.id !== parseInt(req.params.id));
  res.json({ message: "User deleted" });
});

app.listen(PORT, () => {
    console.log(`Server is running on http://localhost:${PORT}`);
});
This includes endpoints for adding, retrieving, updating, and deleting users.
4. Start the application
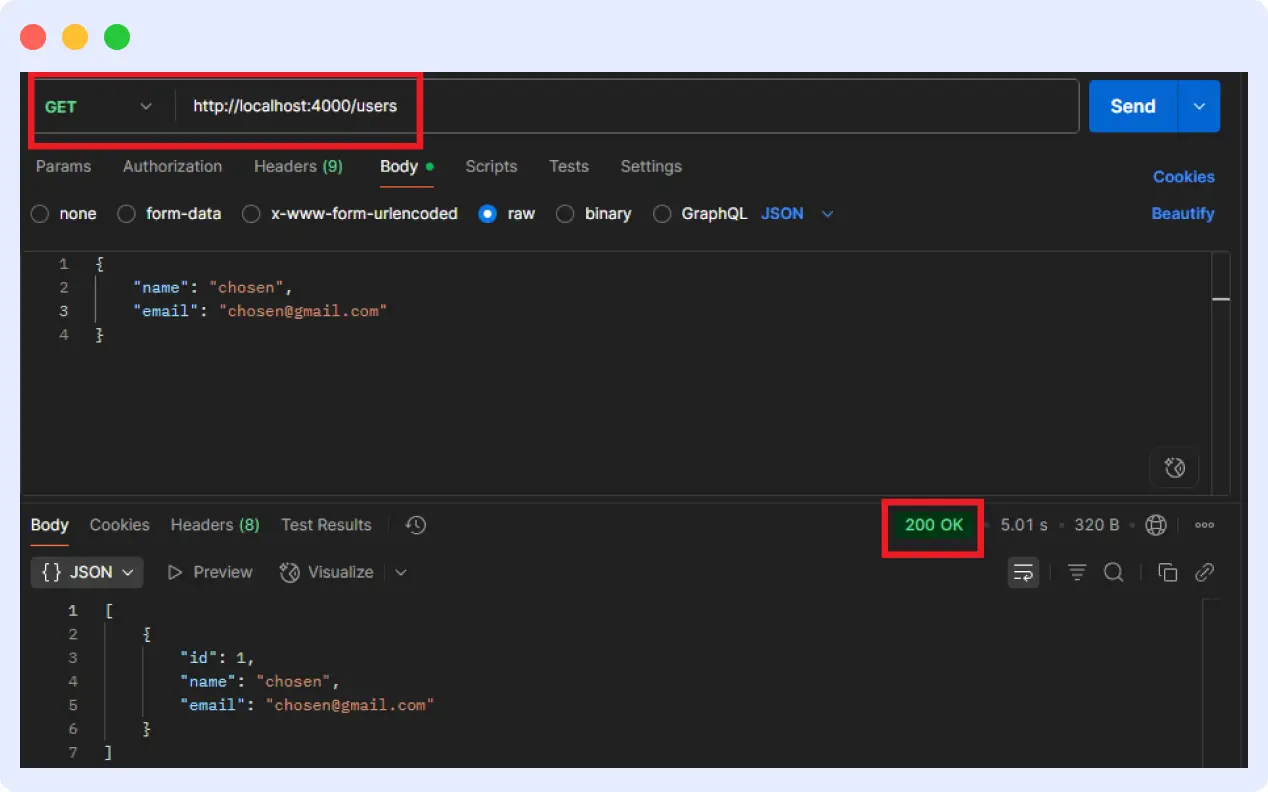
5. Test the endpoints
Use Postman or your preferred API client to verify that the routes are functioning correctly.
Now that the API is up and running, we can add Middleware APM and begin real-time tracking of latency.
Install and Configure Middleware Agent
Now that our API is up and running, we’ll add Middleware APM to monitor the app’s performance. The middleware agent will automatically collect metrics, traces, and performance data.
1. Create a Middleware account and get your API key
- Sign up at middleware.io
- Log in to your dashboard, navigate to your profile, then click “API Key” to get your API key
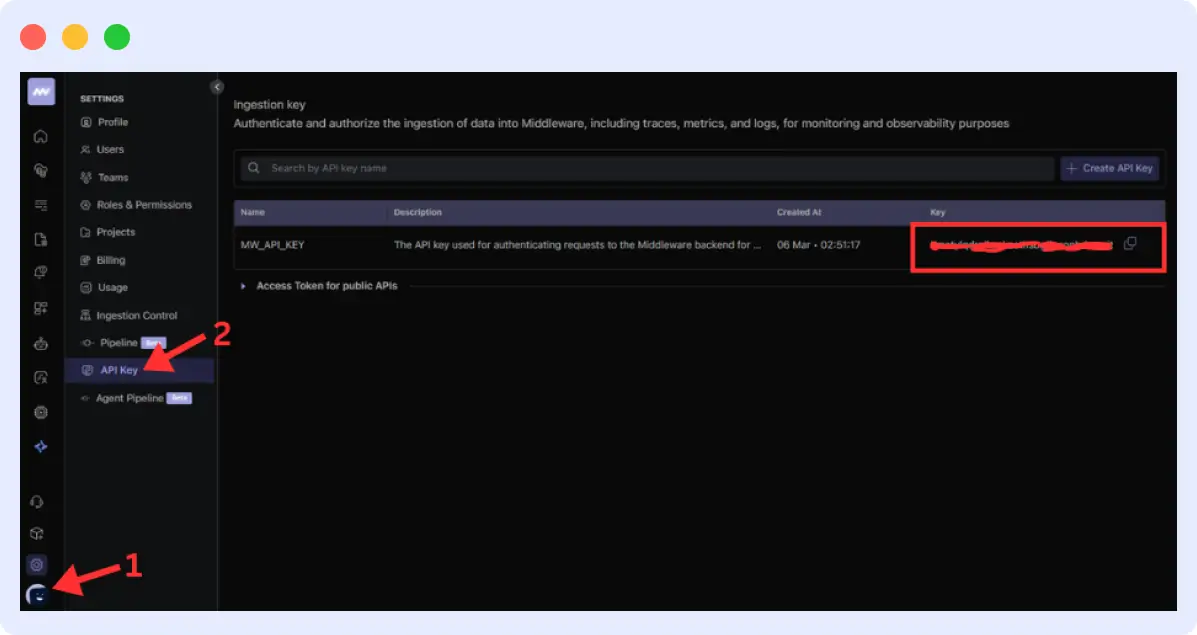
- You’ll need this key to authenticate your application with Middleware’s servers
2. Install the Middleware agent
In your project directory, run:
3. Initialize the agent
At the top of your project file (server.js), add:
const tracker = require('@middleware.io/node-apm');
tracker.track({
  serviceName: "Latency-With-APM",
  accessToken: "",
  target: "https://ccang.middleware.io",
});
<MW_API_KEY> is the API key from your dashboard. Replace it.
4. Restart your application and make a request.
Check Dashboard
After your application is up and running and linked to Middleware, you may examine the monitoring dashboard to identify any signs of latency problems.
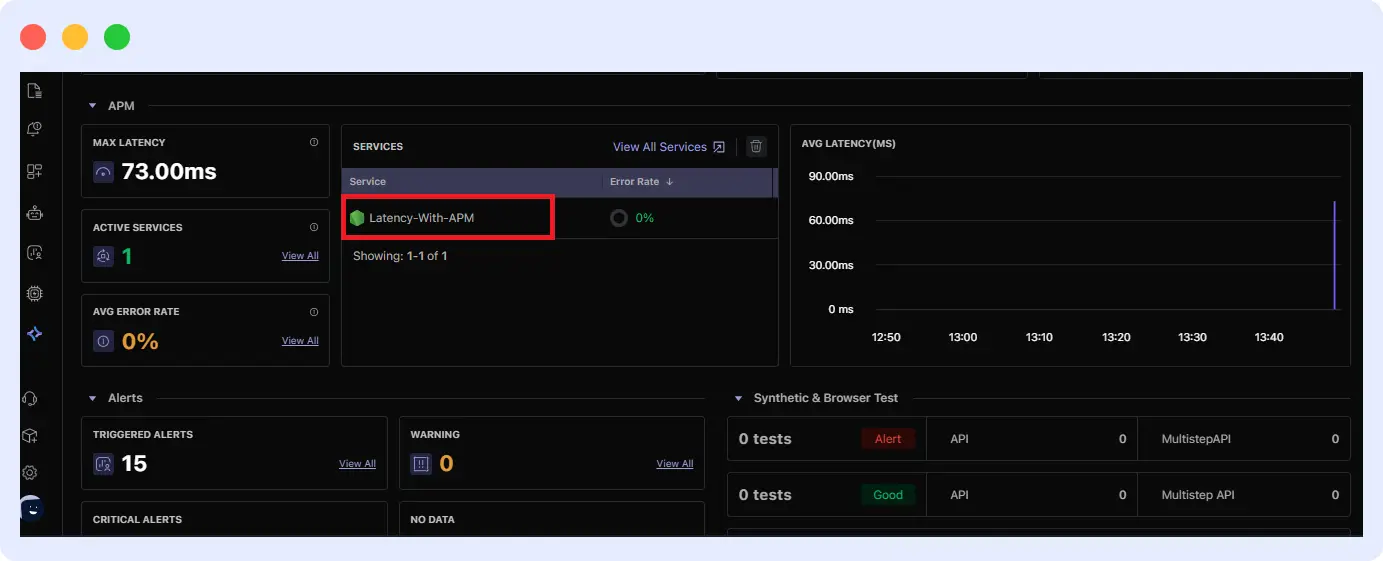
1. Confirm your service is connected
From your Middleware dashboard, scroll down to the section labeled “Services.” The name of the service you chose during setup should appear, such as Latency-With-APM, if it appears that your app is sending data correctly.
2. Simulate latency for testing
You can verify if the Middleware is catching delays by making your endpoints act like they are experiencing latency. For instance:
// 5-second delay on /users
app.get('/users', (req, res) => {
  setTimeout(() => {
    res.json(users);
  }, 5000); // 5000 ms = 5 seconds delay
});

// 4-second delay on /users/:id
app.get('/users/:id', (req, res) => {
  setTimeout(() => {
    const user = users.find(u => u.id === parseInt(req.params.id));
    if (!user) return res.status(404).json({ message: "User not found" });
    res.json(user);
  }, 4000); // simulate 4s latency
});
When you call these endpoints, go to your dashboard and navigate to the APM section. There, you’ll find metrics and information that you can use to analyze and resolve issues in your application.
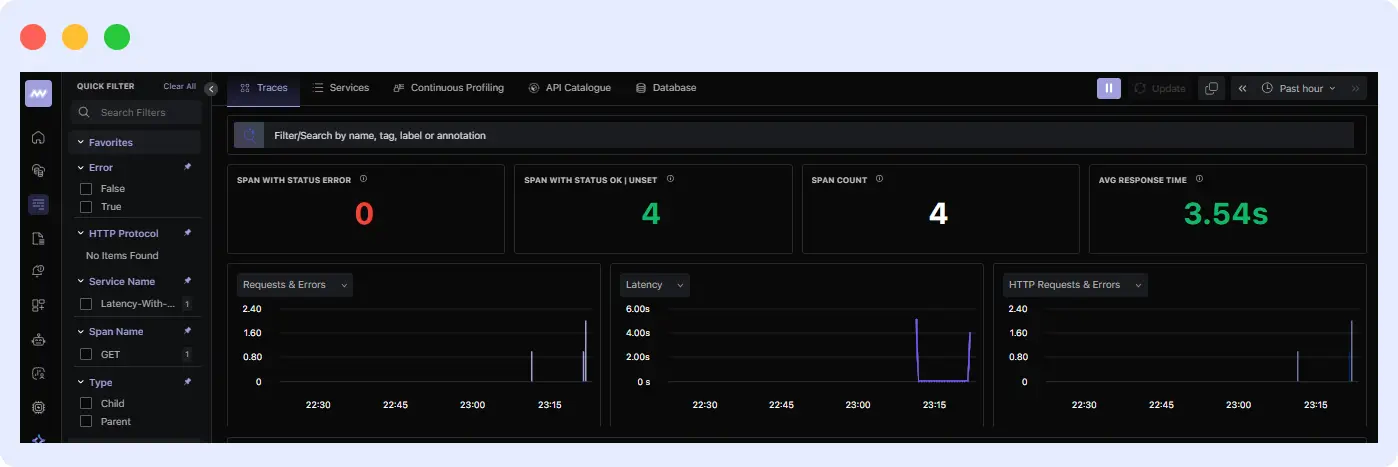
You’ll also see each request you made, along with the time it took to receive a response.
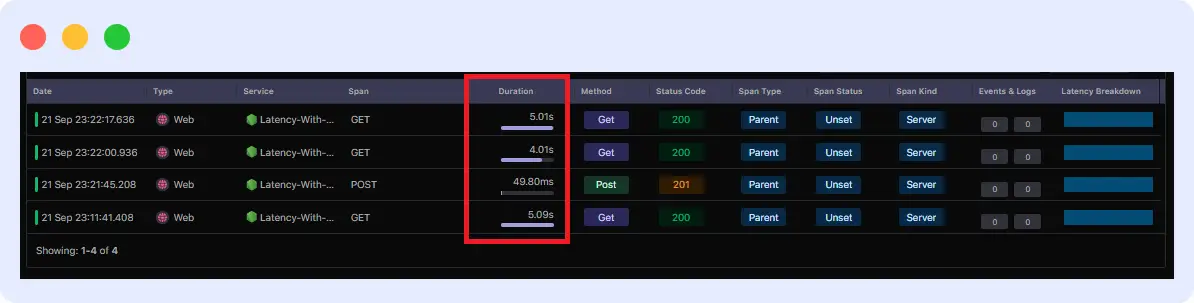
This information will help you identify the endpoint that is experiencing issues. When you click on each one, you’ll also discover further information that will help you figure out what went wrong.
3. Set up alerts
Go to the Alerts section and create a rule for response times. For example, set a threshold so you’re notified if an endpoint takes more than 2 seconds to respond.
Set up response time alerts in Middleware APM to get instant notifications when your endpoints slow down. 👉Configure Alerts Now
How Hotplat Reduced Latencies by 90% with Middleware
Hotplate, a fast-growing platform for pop-up chefs, struggled with performance issues during high-traffic events. Their team required a cost-effective solution to detect problems, reduce latency, and enhance the customer experience.
According to Rangaraj Tirumala, the founding engineer at Hotplate,
“We experienced frequent performance issues but lacked the tools to measure the extent of the degradation accurately.”
Rangaraj Tirumala, the founding engineer at Hotplate
By adopting Middleware APM and Real-User Monitoring (RUM), Hotplate achieved:
- 90% reduction in latency across millions of monthly events
- 75% faster root cause analysis using detailed traces and session replays
- 10x reduction in observability costs compared to other tools
Middleware APM’s combination of detailed tracing, real-user monitoring, and cost-effective pricing enabled Hotplate to transform its API performance while scaling efficiently. With Middleware, Hotplate not only optimized system performance but also enhanced customer interactions by diagnosing issues from the user’s perspective.
Managing API latency is necessary for building responsive applications. With Middleware APM, you don’t just detect latency issues; you can trace them to the root cause and resolve them before they affect users.
Get started with Middleware APM to reduce API latency.
FAQs
What is a good latency threshold for APIs?
It depends on the use case. However, generally, APIs should respond within 100-500 ms for a smooth user experience. Anything over 1 second usually feels slow.
How quickly can Middleware detect latency anomalies?
Middleware detects issues in real time. It flags unusual spikes in latency as soon as they occur.
Can Middleware monitor APIs across multiple regions?
Yes. Middleware can track API performance across different regions and environments, helping you spot region-specific issues.
What languages and frameworks can Middleware APM work with?
Middleware APM can be integrated with various popular programming languages and tools, including Node.js, Python, Java, .NET, Ruby, PHP, and others. This makes it simple to integrate with most tech stacks.


