Summary: Application Performance Monitoring (APM) is the practice of continuously measuring how software applications behave in production, from response times and error rates to database queries and end-user experience. When applications slow down or fail, the business impact is immediate: lost revenue, frustrated users, and damaged brand trust. APM gives engineering and operations teams the real-time visibility they need to catch problems early, resolve them faster, and keep applications performing at the level users expect.
TL;DR
- APM continuously tracks software performance metrics, such as response time, error rate, and resource usage, across the full application stack.
- A 1-second delay in page load can reduce conversions by 7%. APM prevents revenue loss by surfacing issues before users notice them.
- Core components: Real User Monitoring (RUM), distributed tracing, synthetic monitoring, infrastructure metrics, and alerting.
- Key metrics to watch: Response time, error rate, throughput (requests/sec), Apdex score, CPU/memory usage, and latency.
- APM vs. observability: APM is application-scoped and metric-focused; observability is broader, covering logs, metrics, and traces across the entire system.
- AI-powered APM tools now auto-detect anomalies, correlate root causes, and in some cases automatically resolve incidents without human intervention.
What is application performance monitoring?
Application Performance Monitoring (APM) is the process of tracking, measuring, and managing the performance of software applications in real time. It captures telemetry data across the application stack, including response times, error rates, transaction throughput, and infrastructure resource usage, so teams can understand exactly how an application is behaving at any given moment.
APM sits at the intersection of developer tooling and operational reliability. It is used by software engineers to profile slow code paths, by SRE teams to maintain uptime SLAs, and by product and business teams to connect technical performance to user outcomes.
At its core, APM answers three questions:
- Is the application healthy? (availability and error rate)
- Is it fast enough? (latency and response time)
- Why is it slow or failing? (distributed tracing and root cause analysis)
Why does APM matter for modern applications?
Modern applications are distributed, cloud-native, and constantly changing. A single user request might touch a frontend service, three microservices, a message queue, two databases, and a third-party API. When something goes wrong, pinpointing the source manually is nearly impossible without instrumentation.
The business case for APM is well established:
- A 100ms increase in response time can reduce sales by up to 1% (Amazon research).
- 53% of mobile users abandon a page that takes longer than 3 seconds to load (Google).
- Unplanned downtime costs enterprises an average of $5,600 per minute (Gartner).
APM directly addresses these risks by enabling teams to:
- Detect performance regressions immediately after deployment
- Identify slow database queries, N+1 problems, or memory leaks before they escalate
- Reduce Mean Time to Resolution (MTTR) from hours to minutes
- Set and enforce SLAs and SLOs with confidence
- Make data-driven capacity planning decisions
How does APM work?
APM tools collect performance data through instrumentation, either via a lightweight agent installed alongside the application or through auto-instrumentation using OpenTelemetry-compatible SDKs. Here is the typical data flow:
- Instrumentation: An APM agent or SDK is added to the application. It automatically captures spans, traces, metrics, and exceptions without requiring significant code changes.
- Data collection: The agent collects telemetry continuously, including HTTP request durations, database query times, external API call latencies, error stacks, and resource metrics (CPU, memory, disk I/O).
- Data transmission: Collected data is streamed to a centralized APM backend, either cloud-hosted or self-hosted, where it is indexed and stored.
- Analysis and correlation: The backend correlates traces across services, surfaces anomalies, and enriches data with deployment markers, infrastructure context, and user attributes.
- Visualization and alerting: Dashboards display real-time performance, while alert rules notify teams when thresholds are breached (e.g., p99 latency exceeds 2 seconds).
Modern APM tools support multiple instrumentation approaches:
| Approach | How it works | Best for |
|---|---|---|
| Language agent | SDK installed as a library dependency; auto-instruments common frameworks | Node.js, Python, Java, Go, PHP applications |
| OpenTelemetry | Vendor-neutral open standard; data sent to any compatible backend | Multi-cloud, multi-vendor environments |
| Agentless monitoring | Collects metrics via APIs or network-level inspection, no code changes needed | Infrastructure and third-party services |
| Browser agent (RUM) | JavaScript snippet captures real user interactions in the browser | Frontend performance, Core Web Vitals |
| Synthetic probes | Scripted tests run on a schedule to simulate user journeys | Proactive uptime and flow testing |
Core components of APM
A comprehensive APM solution is made up of several distinct capabilities that together give teams full-stack visibility. Here is what each component does and why it matters.
Distributed tracing
Distributed tracing follows a single request as it travels through multiple services, capturing the time spent at each hop. It is the most powerful tool for diagnosing latency in microservices architectures. A trace is made up of spans, where each span represents one unit of work (a database query, an API call, a function execution).
Real User Monitoring (RUM)
RUM captures performance data from real browsers and devices as actual users interact with the application. It measures metrics like First Contentful Paint (FCP), Largest Contentful Paint (LCP), Time to Interactive (TTI), and JavaScript errors. Unlike synthetic monitoring, RUM reflects what genuine users experience across different geographies, devices, and network conditions.
Synthetic monitoring
Synthetic monitoring runs scripted tests on a fixed schedule from multiple locations around the world. It simulates user journeys (login, checkout, form submission) to proactively detect availability issues and measure baseline performance, even when no real users are active.
Infrastructure and resource monitoring
APM integrates host-level metrics, including CPU utilization, memory usage, disk I/O, and network throughput, alongside application metrics. This correlation lets teams determine whether a slow API is caused by inefficient code or by an undersized host running at 95% CPU. See how infrastructure monitoring connects to application performance in practice.
Business transaction monitoring
Not all requests matter equally. Business transaction monitoring lets teams define critical user flows (checkout, authentication, search) and apply special tracking to them. This makes it possible to see whether a business-critical path is degrading even if overall error rates look normal.
Alerting and anomaly detection
Threshold-based alerts fire when a metric exceeds a set value (e.g., error rate above 2%). Anomaly detection, powered by statistical baselines or machine learning, fires when behavior deviates from the normal pattern even if it has not crossed a hard threshold. This reduces false negatives on novel failure modes.
Key APM metrics and what they measure
Tracking the right metrics is more important than tracking everything. These are the APM metrics that matter most:
| Metric | What it measures | Why it matters | Target benchmark |
|---|---|---|---|
| Response time (p95/p99) | Time from request to response for the slowest 5% or 1% of requests | Reflects the worst-case experience for real users | Depends on SLA; typically <500ms for APIs |
| Error rate | Percentage of requests that return errors (4xx/5xx) | Leading indicator of broken functionality | <1% for production services |
| Throughput (req/sec) | Volume of requests processed per second | Establishes baseline; sudden drops signal issues | Application-specific |
| Apdex score | Satisfaction ratio: satisfied / tolerating / frustrated users | Single number summarizing performance vs. user expectation | Above 0.85 is good; above 0.94 is excellent |
| CPU and memory utilization | Host-level resource consumption | Identifies infrastructure bottlenecks and over-provisioning | <70% sustained CPU; <80% memory |
| Database query time | Time spent waiting on database operations | Database is often the root cause of application slowdowns | No query above 100ms in steady state |
| Mean Time to Resolution (MTTR) | Average time from incident detection to resolution | Operational efficiency; lower is better | Best-in-class teams achieve <30 minutes |
APM vs. observability: what is the difference?
These terms are often used interchangeably, but they describe different scopes. Understanding the distinction helps teams choose the right tools and set appropriate expectations. For a deeper look, see our guide to observability and the shift from APM to full-stack observability.
| Dimension | APM | Observability |
|---|---|---|
| Scope | Application performance and availability | Entire system: apps, infra, network, pipelines |
| Data types | Metrics, traces, errors | Metrics, logs, traces (the “three pillars”) |
| Primary question answered | “Is the app slow or broken, and why?” | “What is happening across the entire system?” |
| Users | App developers, SRE/on-call engineers | Engineering, platform, operations, security teams |
| Typical tooling | Middleware, Datadog APM, New Relic APM | Full observability platforms, OpenTelemetry pipelines |
| Relationship | APM is a subset of observability | Observability is the broader practice |
A practical way to think about it: APM tells you your checkout API is slow. Observability tells you why, whether it is the API code, a downstream payment service, a saturated database, or a Kubernetes pod getting evicted.
Which APM tool should you use?
Choosing the right APM tool depends on your stack, team size, cloud environment, and budget at scale. The market ranges from open-source options like SigNoz to full-stack platforms like Middleware, and enterprise tools like Datadog and New Relic.
We have covered all the leading options in detail, including key features, pros and cons, and pricing, in a dedicated guide: 10 best APM tools in 2026: detailed review and comparison.
APM best practices for 2026
Start with SLOs, not dashboards
Define Service Level Objectives (SLOs) before instrumenting anything. An SLO (e.g., “99.5% of checkout requests complete in under 500ms”) gives every metric a target and every alert a business context. Dashboards built without SLOs tend to show everything and communicate nothing.
Instrument at the right level of granularity
Over-instrumentation creates noise and increases costs. Under-instrumentation leaves blind spots. Focus on ingress and egress points, business-critical transactions, external dependencies (databases, third-party APIs), and error boundaries.
Correlate signals, not just metrics
The most powerful APM workflows connect traces to logs to infrastructure metrics in a single click. When an alert fires, engineers should be able to jump from the alert to the trace to the offending log line within seconds. Siloed tools that cannot correlate signals slow down every incident.
Use percentile metrics, not averages
Average response time masks outliers. If your p50 is 120ms but your p99 is 4 seconds, one in 100 users is having a terrible experience. Always monitor p95 and p99 latency for user-facing services. Read more on latency reduction strategies that go beyond APM configuration alone.
Adopt deployment markers
Send deployment events to your APM tool every time code ships. This overlays release events on performance graphs, making it immediately obvious when a deployment introduced a regression. Many post-incident reviews skip this step and spend hours finding what a single annotation would reveal instantly.
Build alerting hygiene from day one
Alert fatigue is one of the top reasons APM ROI is never realized. Every alert should map to an actionable runbook. Review and prune alerts quarterly. Use anomaly-based alerting for metrics where seasonal or traffic-driven variation makes static thresholds unreliable.
Test in production, safely
Staging environments rarely replicate production traffic patterns. Use synthetic monitoring, feature flags, and canary deployments to validate performance changes under real conditions. Pair this with error budgets to make informed release decisions.
How AI is changing APM
The 2024-2026 wave of AI investment has fundamentally shifted what APM tools can do. The shift is from reactive dashboards to proactive, autonomous incident management.
Three capabilities define AI-powered APM today:
Anomaly detection without manual thresholds
Traditional APM requires engineers to set static thresholds for every metric. AI-powered tools learn baseline behavior patterns automatically and alert when something deviates, even if it has not crossed a predefined ceiling. This catches novel failure modes that threshold-based alerting would miss entirely.
Automated root cause analysis
When an incident occurs, AI agents can correlate signals across traces, logs, and infrastructure metrics simultaneously to surface the most probable root cause. This compresses investigation time from 30-60 minutes down to seconds in many cases.
Autonomous remediation
The most advanced tools, like Middleware’s OpsAI, can take corrective action automatically: restarting a failed pod, scaling a service, rolling back a deployment, or suppressing a known flapping alert. Middleware’s OpsAI SRE agent achieves 50%+ auto-resolution of incidents internally and delivers 80%+ improvement in on-call productivity for teams in production.
This is not automation replacing engineers. It is automation handling the repetitive, well-understood incident types so engineers can focus on the complex, novel problems that require human judgment.
See Middleware APM in action
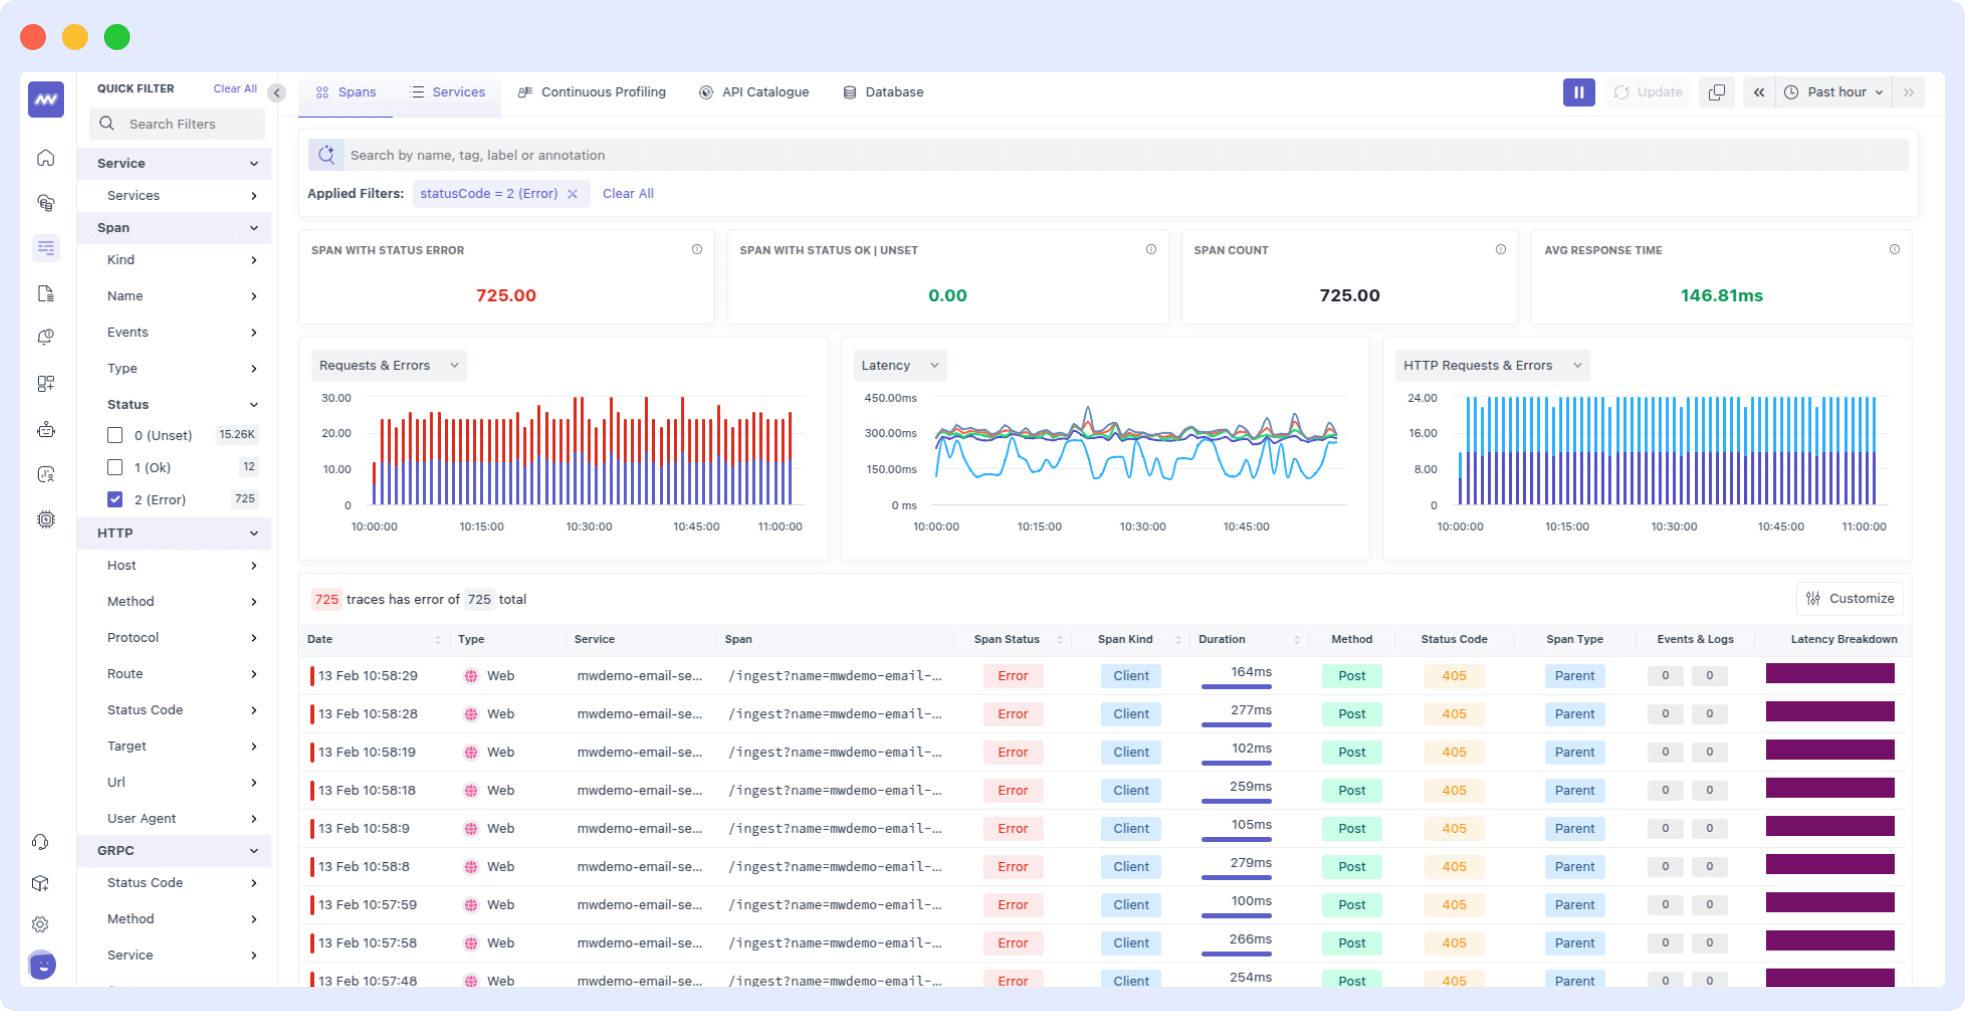
Middleware APM gives you real-time visibility into your application’s performance, from trace list and error graphs to response times and service maps, all in a single dashboard. Select any time window to analyze trends, compare performance before and after a deployment, or scope an investigation to a specific incident.
Getting started takes minutes. Install the language-specific agent for Node.js, Go, Python, Java, or PHP, and data starts flowing immediately. Full setup instructions are in the Middleware APM docs.
Key capabilities:
APM dashboard: Real-time view of usage patterns, response times, and error rates across your application.
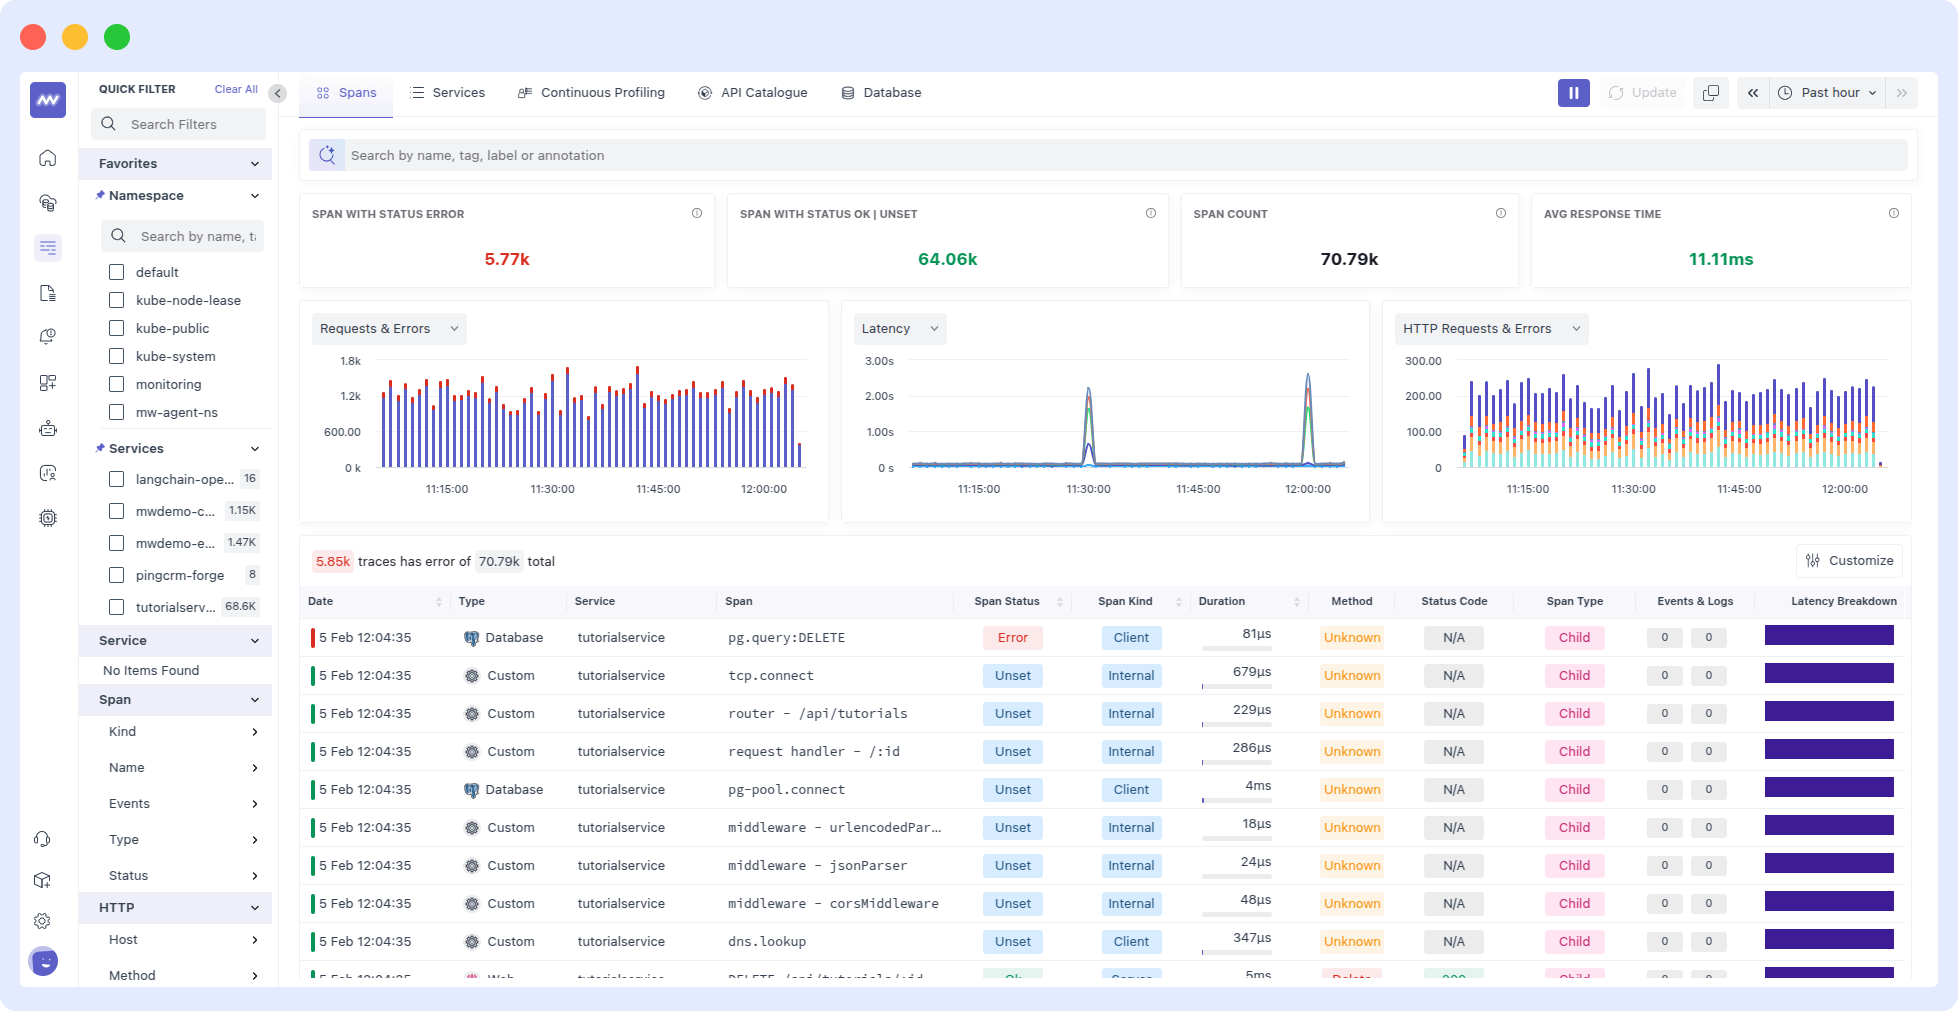
Trace list and error traces: Visualize request hits and failed transactions over any time range to spot issues and understand load patterns.
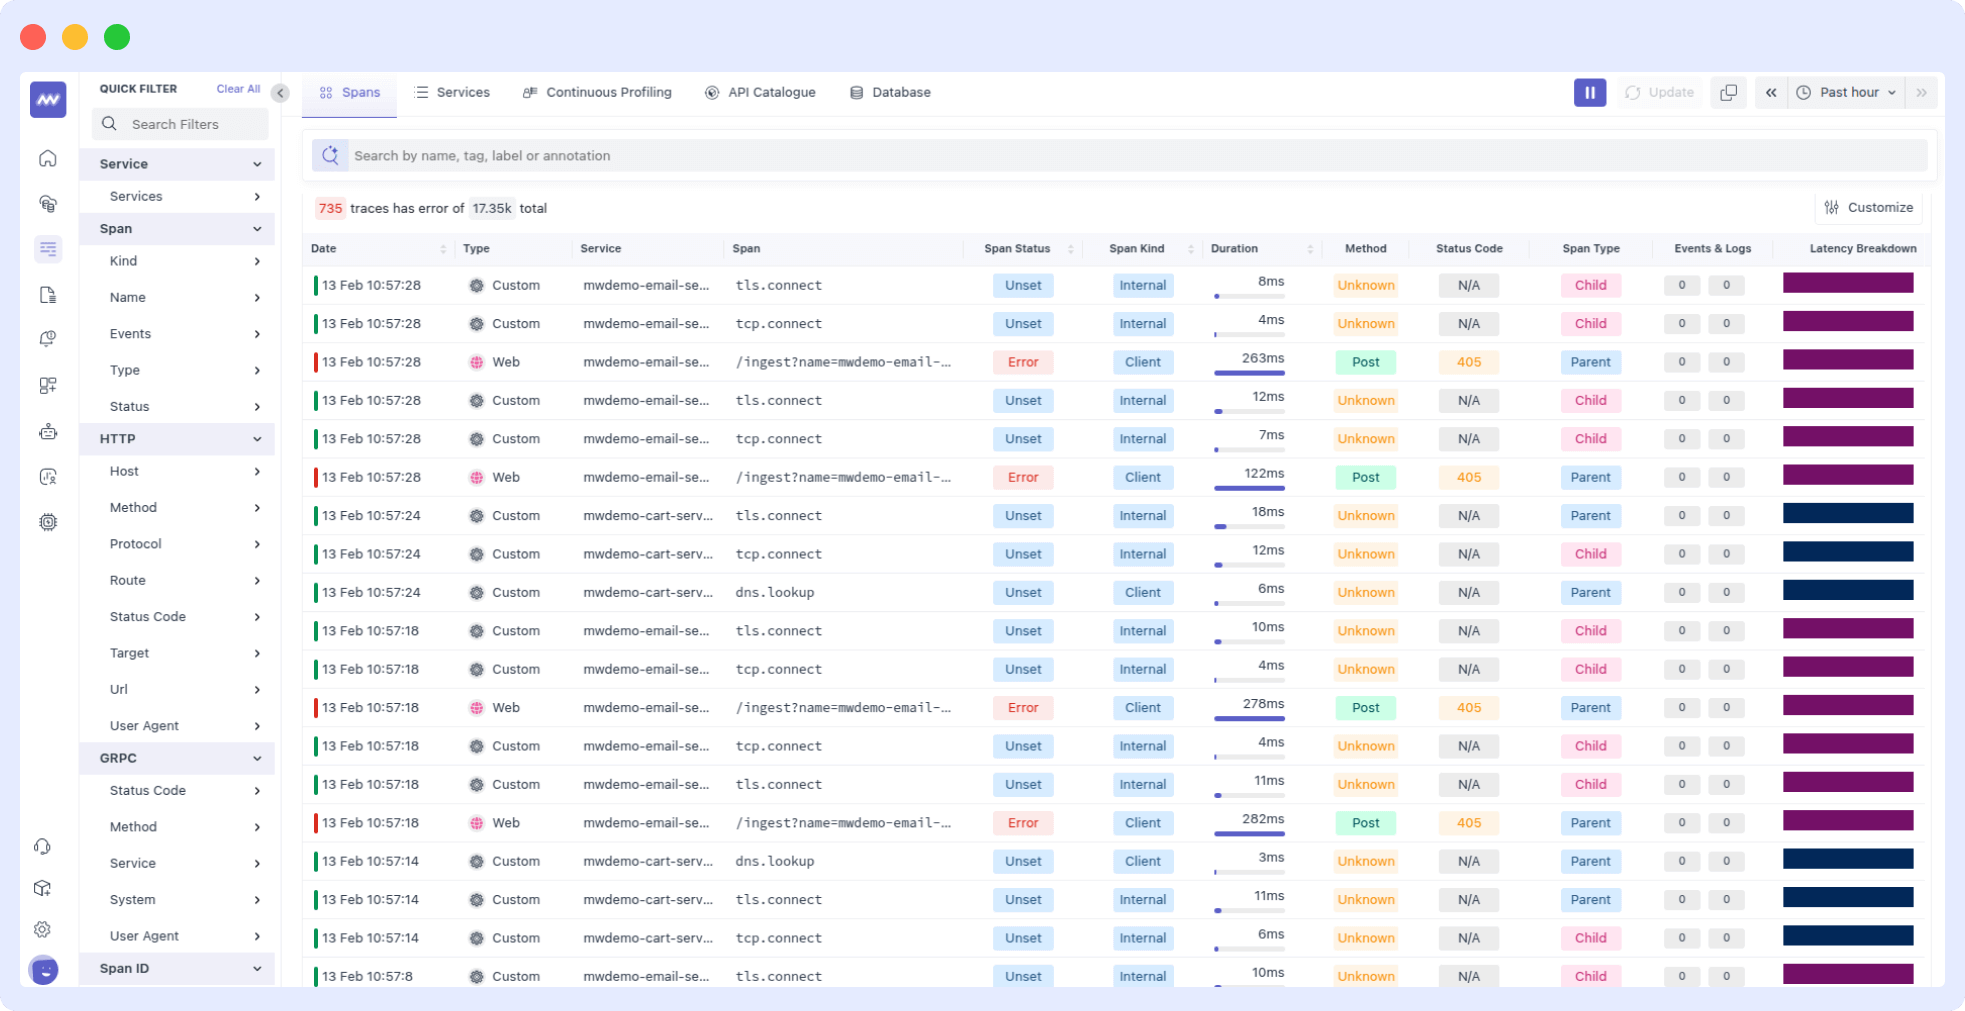
Real-time insights: Monitor throughput, identify bottlenecks, and analyze user behavior as it happens.
Alerting and notifications: Set custom thresholds on any metric and receive alerts via email, SMS, Slack, or PagerDuty. Customize rules by service, endpoint, or environment.
OpsAI: Middleware’s AI SRE agent goes beyond alerting. It correlates signals across traces, logs, and infrastructure metrics to find the root cause, then resolves the incident automatically: restarting a failed pod, scaling a service, rolling back a bad deployment, or suppressing a flapping alert. OpsAI auto-resolves 50%+ of incidents internally, 70%+ across beta customers, and delivers an 80%+ improvement in on-call productivity in production.
Try Middleware APM and get full-stack visibility in under 15 minutes.
FAQs
What is the difference between APM and monitoring?
Traditional monitoring tracks whether systems are up or down, typically using ping checks and threshold alerts. APM goes deeper: it instruments application code to capture transaction traces, error stacks, and performance metrics at the function and service level. Monitoring tells you something is broken; APM tells you what, where, and why.
What are the three pillars of observability and how do they relate to APM?
The three pillars are metrics, logs, and traces. APM primarily uses metrics (performance data) and traces (request flows), but modern APM platforms incorporate all three. Correlating traces to logs is especially powerful because a trace shows where the slowdown is, and the log shows the error message that explains it.
What is an Apdex score and what is a good score?
Apdex (Application Performance Index) measures user satisfaction by classifying requests as satisfied (faster than target), tolerating (up to 4x target), or frustrated (slower or errored). Scores range from 0 to 1. An Apdex above 0.85 is generally considered good; above 0.94 is excellent. Anything below 0.70 indicates serious performance issues affecting a significant portion of users.
How does APM work in microservices and Kubernetes environments?
In microservices, APM uses distributed tracing (typically via OpenTelemetry) to follow a request as it passes through multiple services, containers, and pods. Each service is instrumented to emit trace data with a shared trace ID, allowing the APM platform to reconstruct the full request path. In Kubernetes, APM tools also collect pod-level metrics, node resource usage, and deployment events for full context.