“Every minute spent chasing a bug in production is a minute not spent building features. The biggest slowdown? Figuring out who owns the failing code.”
Production errors are a headache for every engineering team. The issue isn’t just the bug itself, but the time it takes to trace where it came from, who wrote the code, and how it slipped through. Without the right error debugging tools, engineers often bounce between error logs, GitHub commit history, and Slack threads to figure out who should even look into the problem.
Middleware’s Ops AI changes that. Pulling in GitHub commit and ownership data directly into your error tracking with GitHub workflow shows you the root cause and the right owner in seconds. No more guesswork, no more wasting hours chasing leads that go nowhere.
In this blog, we’ll explore how Middleware’s integration with GitHub works, how it automatically maps errors to code changes and owners, and how this level of incident management automation helps teams resolve issues faster and reduce mean time to resolution (MTTR).
Looking to cut debugging time in half? See how Middleware helps engineering teams streamline error resolution.
What Is Middleware Ops AI?
To understand how GitHub data powers better error tracking, it’s important to understand what Middleware Ops AI actually is.
Middleware Ops AI is an AI-powered observability engine that monitors your application stack: APM, logs, metrics, frontend performance, and automatically correlates incidents with the underlying code and responsible teams. Unlike traditional error debugging tools, it doesn’t just tell you that something broke. It tells you why, where, and who can fix it.
Here’s what makes Ops AI unique:
- Detects anomalies across backend, frontend, and infrastructure automatically.
- Links each error to the exact code commit, file, and developer who last changed it with error tracking through GitHub commits.
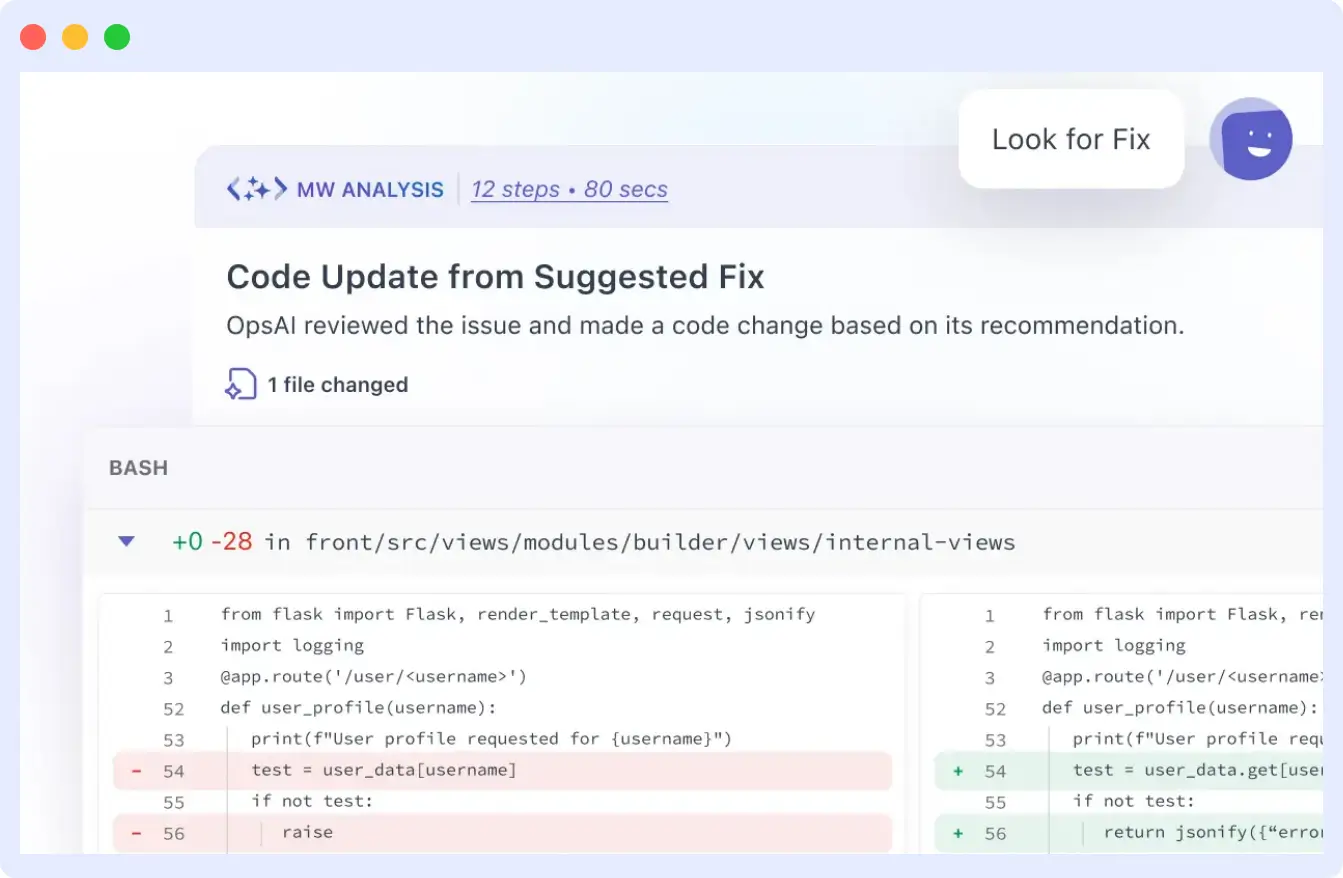
- In high-confidence scenarios, generate a pull request with a recommended fix.
- Assigns incidents based on real ownership, not guesswork or rotating on-call schedules.
- Only pulls metadata and specific lines of code necessary to diagnose the issue, not your entire repo.
👉 Want to try it yourself? See how to set up GitHub Integrations and connect Middleware Ops AI with your repo in minutes.
How GitHub Commit and Ownership Data Actually Helps You Fix Errors Faster
Let’s be honest, when an error shows up in production,
First question isn’t “what failed?” It’s “who last touched this code?”
And that’s where Middleware’s Ops AI makes a big difference. Instead of leaving you to jump between your error logs and GitHub manually, it connects the dots for you, showing which commit introduced the problem, who made the change, and how it’s connected to the current error.
Here’s how it works in real life:
Trace Errors to the Exact Commit
When an error hits production, most teams scramble to answer: what changed that triggered this?
With Middleware, you don’t have to dig through logs or GitHub history yourself. It uses error tracking with GitHub to match the error to the right commit automatically.
Here’s how it works:
- Matches the stack trace to the right commit: When something breaks, Middleware looks at the stack trace, pinpoints the exact file and line where it happened, and checks your Git history for commits that touched those areas, even across different branches.
- Finds the real cause, not just the last deploy: The most recent commit/deploy isn’t always the culprit. Middleware looks for the meaningful change that actually caused the issue, even if it happened hours or days earlier.
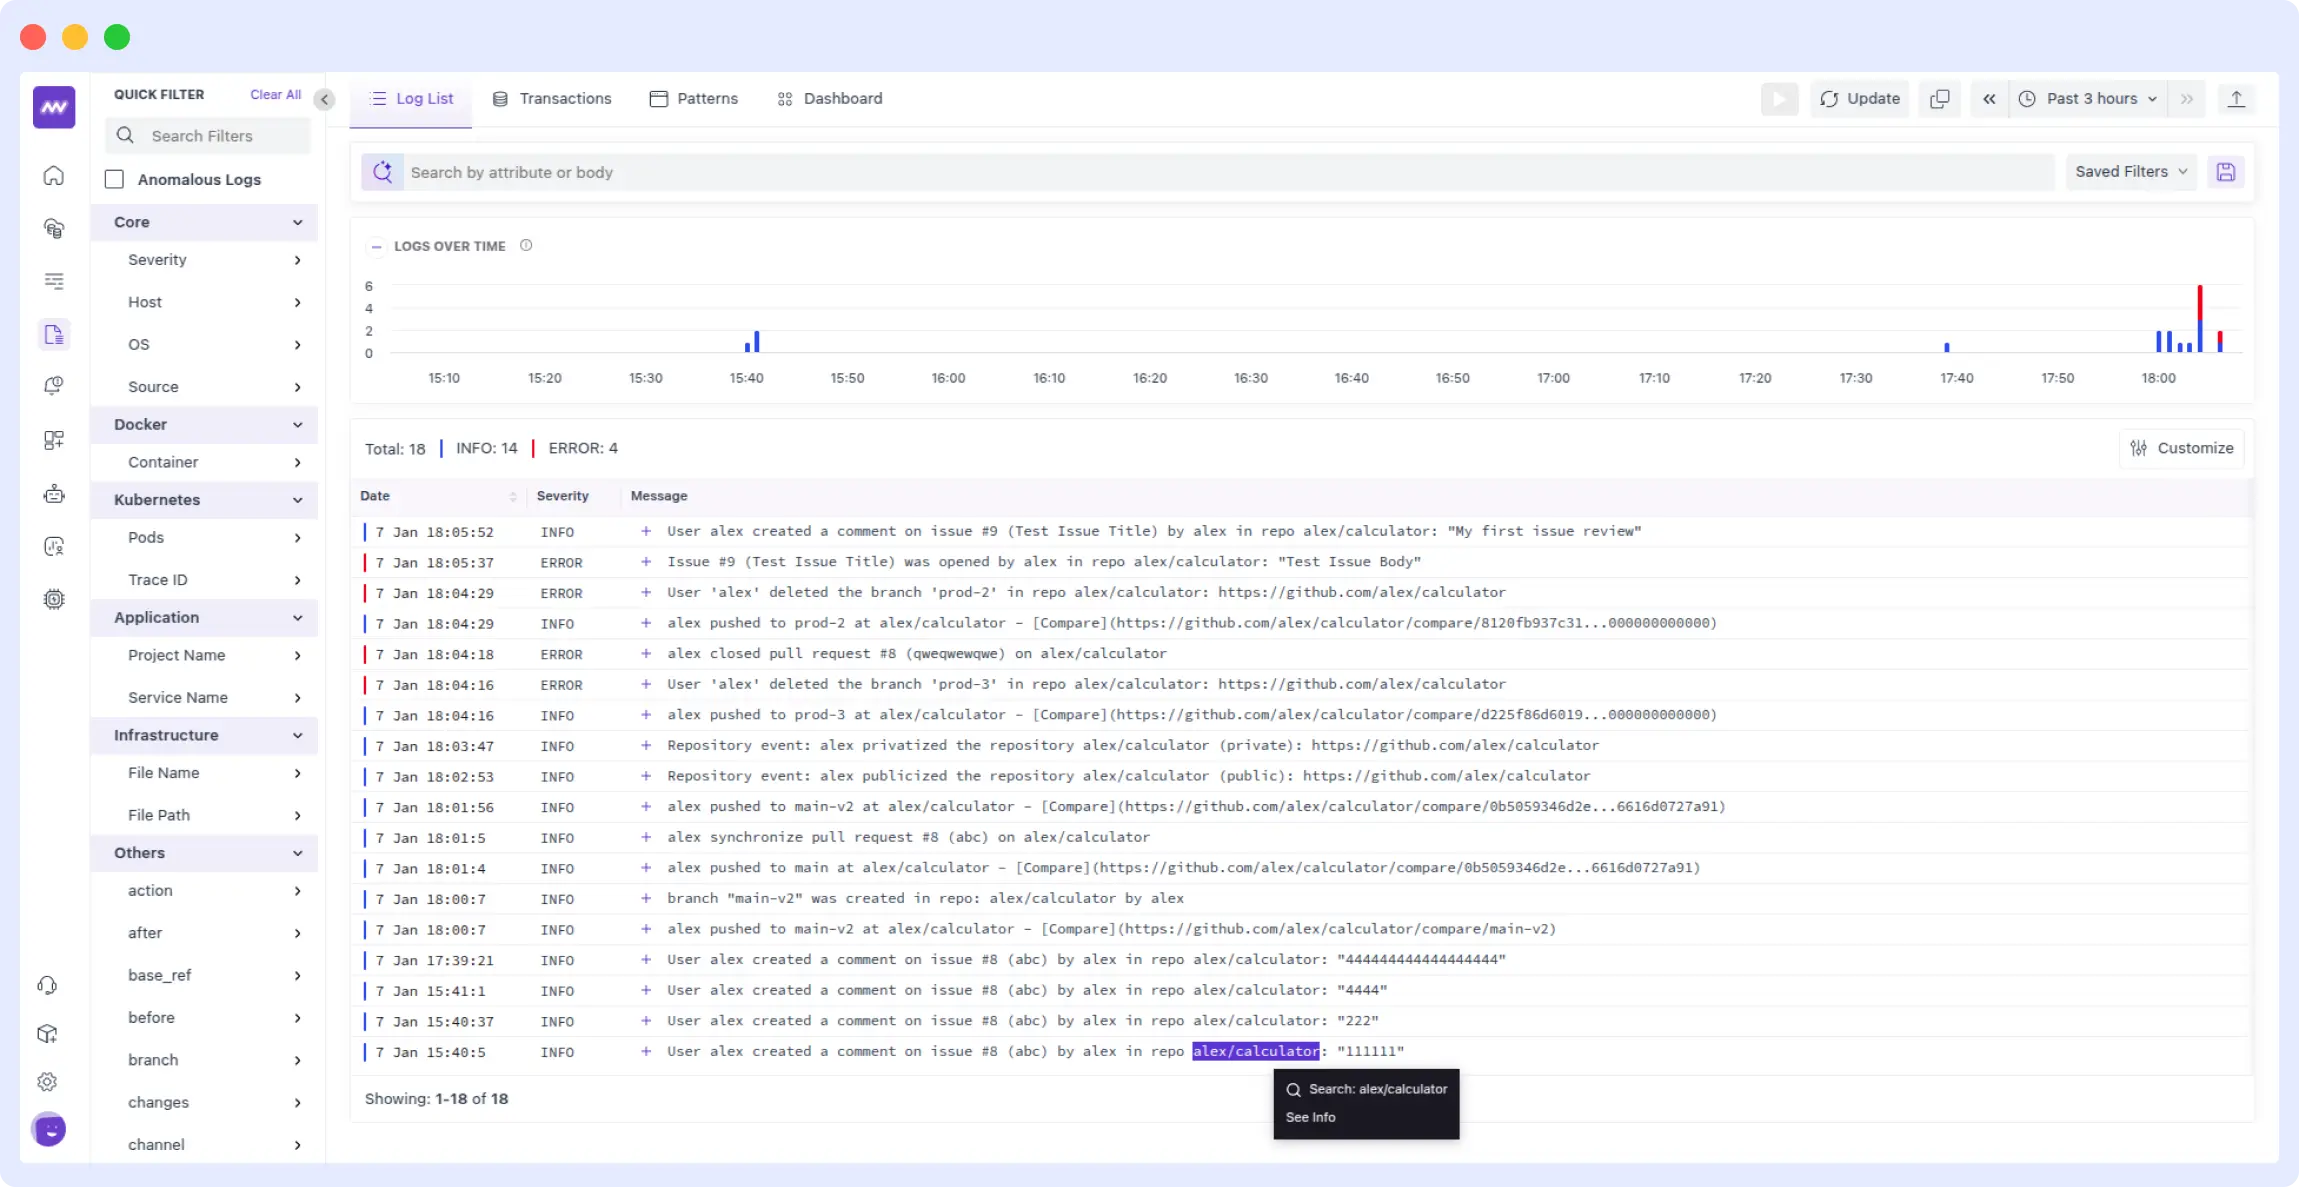
- Puts all the commit details in your alert: When a commit is flagged, you see who made the change, the diff, the commit message, the timestamp, and the pull request link; all without leaving the alert.
- Keeps results clean for big codebases: For monorepos or multi-service setups, Middleware scopes its search to the correct repo structure or service, so you don’t get flooded with irrelevant matches.
- Connects deploys to commits: By linking deployment markers to Git commit hashes, it’s easy to confirm whether a bug came from the latest push or if it’s a regression from an older change.
With this workflow, engineering teams can reduce mean time to resolution (MTTR) dramatically turning hours of detective work into minutes.
Use Case
If a deployment suddenly triggers 500 errors on a critical API, Middleware’s Ops AI can help you identify the exact commit responsible within seconds. By linking stack traces to commit history and showing the code diff, you’ll know exactly what changed and who owns it.
Learn more about how Middleware improves error tracking and cuts down MTTR ⏱️ for modern engineering teams
From there, you can roll back or patch the issue in minutes, without combing through logs or GitHub manually.
Middleware not only matches stack traces to commits but also filters logs by severity logs level (Error, Warning, Info). This ensures you’re focusing on the real problem instead of sifting through noisy debug data.
Know Who Owns the Failing Code
Finding the root cause is one part of the problem. The next challenge? Figuring out who should fix it. Middleware uses GitHub ownership data to automatically identify the right person or team behind the broken code.
- Maps errors to GitHub commit history: When an error occurs, Middleware examines the stack trace to pinpoint the file and function involved, then checks the commit history to determine who has worked on that code most recently or frequently.
- Works with individual and team ownership: Whether you use GitHub’s CODEOWNERS file or rely on commit activity, Middleware can match the error to a specific engineer or an entire team. It understands patterns across large repos, not just the last person who touched the file.
- Delivers alerts to the right person fast: Once the owner is identified, Middleware sends the alert directly via Slack, email, or your incident response tool so it lands with the right person immediately.
- Removes the “who owns this?” guessing game: During incidents, you don’t have to waste time in back-and-forth messages. Alerts include the most likely owner and full commit context, so you can go straight to fixing the problem.
🔎 Discover how Middleware correlates logs, metrics, and traces 📊 into one view for faster debugging. Learn More
Use Case
If a frontend update in your web app suddenly starts throwing errors, Middleware’s Ops AI can point out the exact component and the developer who last committed/fixed it.
The alert goes straight to their inbox or chat, skipping the usual back-and-forth in Slack or manual log digging. The developer can see the commit, diff, and context right away, ship a fix, and get the app stable again before the next deployment window.
Learn how Digital Experience Monitoring (DEM) improves user journeys and how Middleware simplifies monitoring across web and mobile apps.
Get Full Error Context in One View
Even with the right commit and code owner, engineers still need context to act fast: what triggered the error, what the user was doing, and what environment it happened in.
Middleware pulls all that into a single view, so you don’t need to piece it together manually.
- Combines GitHub commit data with runtime details like environment, stack trace, and user actions
- Links error events directly to related deployments and code changes
- Shows when the error first appeared and how often it’s been happening
- Helps teams understand if it’s an edge case or something breaking at scale
Loved how Ops AI pinpoints commits and reduces MTTR? Dive deeper into foundational concepts behind AI-powered monitoring in our What is AIOps guide.
Use Case
If your SaaS product’s conversion rate starts dropping with no clear cause, Middleware’s Ops AI can detect silent errors that slip past normal monitoring. It correlates the issue to the exact commit and file, showing the dev team when and how the problem was introduced. With this context, engineers can deploy a fix before the business feels the impact.
Reduce Time to Resolution with Smarter Workflows
Triaging production issues isn’t just about finding bugs; it’s about understanding context, routing it to the right team, and resolving it fast. The challenge? Most teams juggle too many tools to get the full picture. Middleware brings it all into one place, aligning error data with code, commits, and ownership so engineers can act with confidence, and not assumptions.
- Without this visibility, teams often have to guess whether a deploy introduced the bug, relying on cross-checking timestamps, commit logs, or deployment tools. Middleware cuts through the noise by linking errors to the exact commit that went live, helping teams identify if the issue is deployment-related within seconds.
- When an error appears in production, Middleware parses the associated stack trace and automatically checks Git history to identify the related commit. This makes it easy to pinpoint not just what broke, but when and how it was introduced.
- Instead of vague alerts that send engineers hunting for context, Middleware sends detailed alerts with commit info, file paths, environment, and owner. Teams get everything they need to act, right where they work.
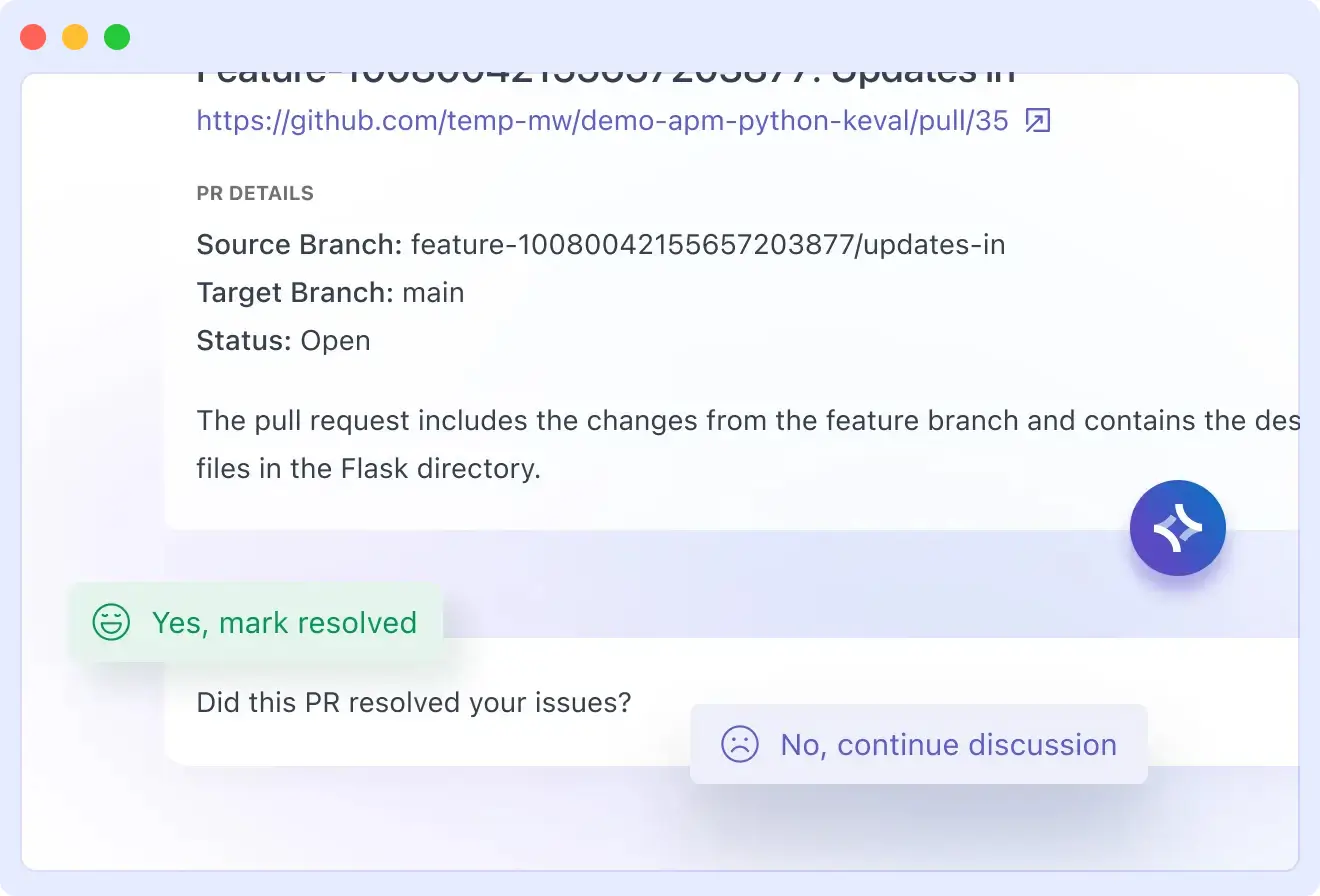
- Middleware can automatically generate GitHub issues tied to the failing commit or notify the reviewer responsible for the change. This shortens the feedback loop and ensures accountability without manual triage.
- In modern architectures, knowing which team owns what is crucial. Middleware tags errors by service or team using repo structure and ownership metadata, helping large orgs route issues quickly and accurately.
Use Case
In a microservices-heavy environment, incident triage can eat up valuable time. Middleware’s Ops AI pinpoints the commit and author responsible for an error, even across dozens of services. Instead of passing issues through a central SRE queue, the alert goes straight to the right engineer with full context, often cutting resolution time from hours to minutes.
Debugging shouldn’t feel like a never-ending guessing game. With Middleware, you get error alerts that already know where the problem started and who can fix it, so your team can jump straight to the solution.
No more long nights chasing bugs or waiting on answers. Just clear context, faster fixes, and more time to focus on building the things that matter.
📚 Also Read
- Python Error Types: Quick guide to identifying and fixing the most common Python errors.
- Reducing Error Rates in a High-Traffic Node.js App Using APM: See how APM tools help lower Node.js error rates in production.
- Discover how smart log pattern detection can reduce noise and surface anomalies in your logs instantly.


