Given the importance of Observability in today’s complex systems, having a set of Observability best practices becomes critical.
This is because Observability best practices provide a set of guidelines for sustained, efficient development that comply with standards and regulations, while also providing a path for continuous improvement.
Wait, what is observability?
Observability is the extent to which you can understand a complex system’s internal state or condition based only on knowledge of its external outputs in real time. Observability analyzes telemetric data to resolve issues and keep the system efficient and reliable. Data such as metrics, traces, and logs are analyzed to gain actionable insights.
Observability adoption has surged, with 78% of enterprises reporting 30% faster incident resolution and 25% better uptime, per the 2025 State of Observability report. Gartner predicts 60% of Fortune 500 companies will prioritize observability by 2027, reducing MTTR by up to 50%.
According to recent studies, companies that use observability at some level have witnessed improvements in system uptime and reliability, user experience, developer productivity, and operational efficiency and security management.
Having understood observability and its importance, let us look at 10 observability best practices every DevOps engineer should implement.
10 Observability Best Practices every DevOps should Implement
1. Know your Platform
You need detailed knowledge of the physical platform to identify all possible data feed sources.
Different platforms and systems require distinct monitoring and observability approaches, and understanding your platform’s unique characteristics can help you optimize your observability practices.
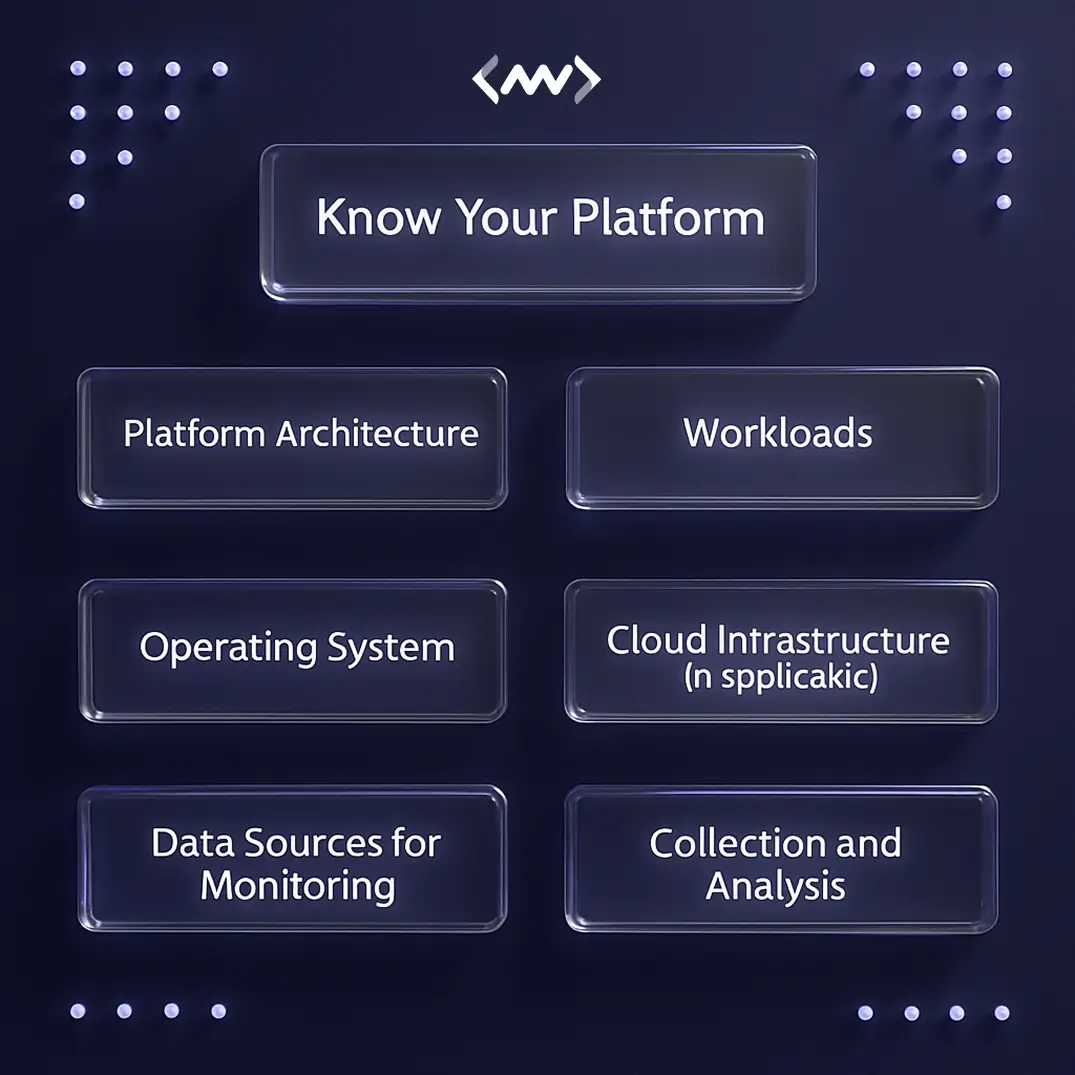
Some factors to consider for understanding your platform are:
- Platform architecture, including the components, dependencies, and communication patterns between services.
- Workloads running on your platform, such as batch jobs, real-time services, and background tasks.
- The operating system running on your platform, including its performance characteristics, resource utilization, and limitations.
- In the case of a cloud platform, the cloud infrastructure’s monitoring and observability capabilities and limitations.
- Relevant data sources for monitoring and observability, such as logs, metrics, traces, and events, and how to collect and analyze them.
Observability isn’t about collecting more data it’s about collecting the right data that helps teams act faster.
Understanding the unique characteristics of your platform can help you optimize your observability best practices score.
2. Monitor What Matters Most
IT platforms generate a lot of data, and not all of it is useful. Observability systems should be designed to filter data as close to the source as possible, at multiple levels, to avoid cluttering with excess data.
This will enable faster real-time data analysis.
Of course, observability best practices recommend that you ensure data that may be unimportant from an operational perspective but important from a business analysis perspective is not deleted.
Monitoring selectively has the following benefits:
- Focusing only on critical metrics and events reduces noise in monitoring data, making it easier to identify and address issues in critical areas faster and reducing downtime.
- DevOps teams can scale monitoring efforts more effectively by focusing resources on the most critical areas, thereby improving cost-effectiveness.
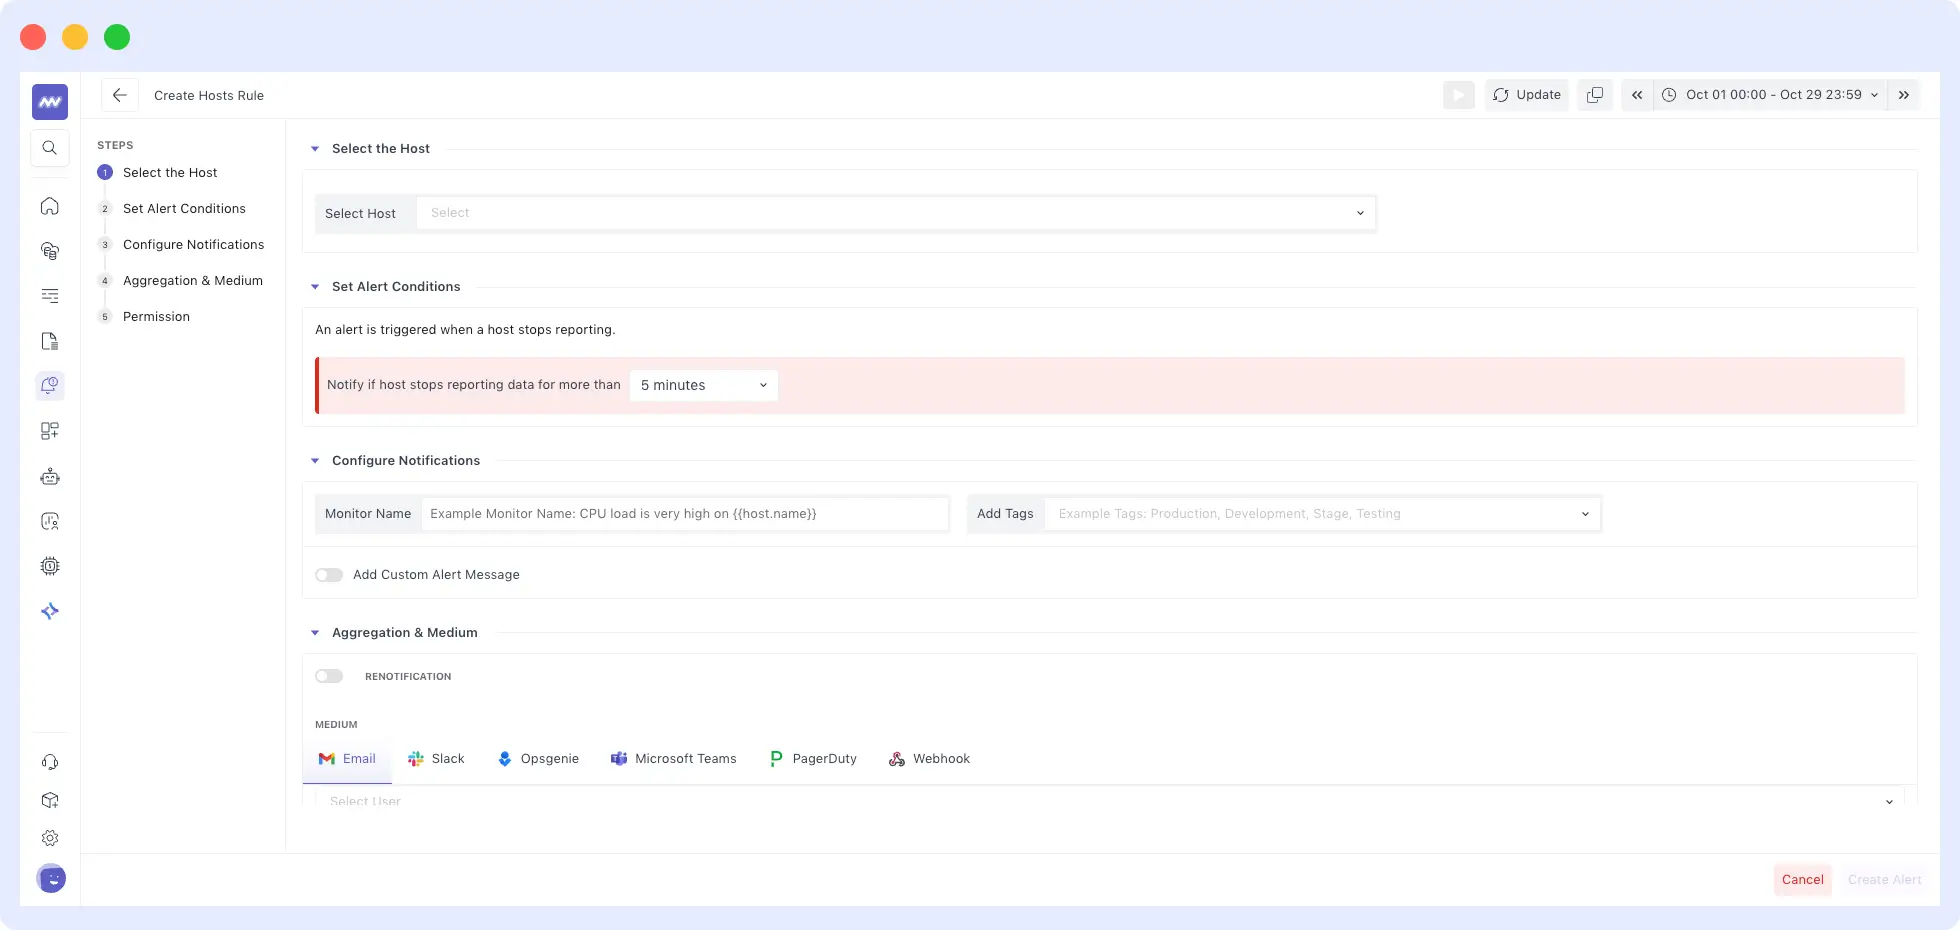
3. Put Alerts only for Critical Events
Alerts can be configured to send notifications for a critical event, such as when an application behaves outside predefined parameters.
It detects important events in the system and alerts the responsible party. An alert system ensures developers know when something needs fixing, so they can stay focused on other tasks.
An effective observability tool like Middleware will detect critical early-stage problems or zero-day attacks on the platform.
Using pattern recognition, they secure platforms from internal and external threats.
Alert fatigue doesn’t come from too many alerts it comes from alerts that don’t matter.
Developers can use self-healing infrastructure or automation to resolve non-critical issues. However, business-critical issues require developers to be more hands-on, leveraging data and analytics.
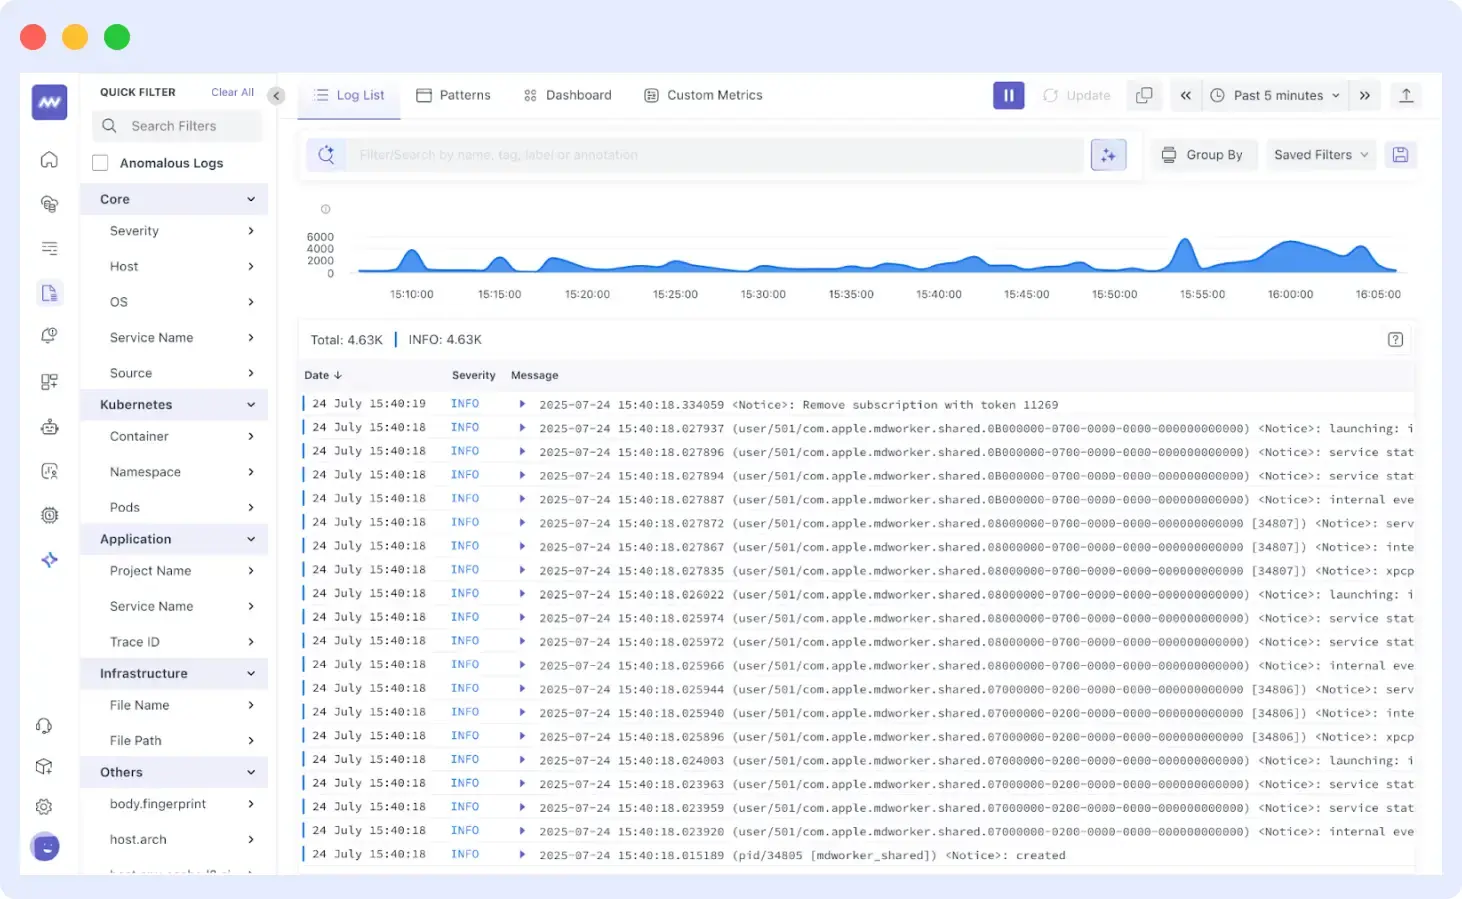
4. Create a Standardized Data Logging Format
Data from logging can help DevOps teams identify problem occurrences in a system and isolate the root cause.
Hence, log data should be formatted for maximizing usage by structuring logs in a standardized manner.
Structured logging represents all crucial log elements as attributes with associated values, making them easy to ingest and parse.
This allows teams to use the log management platform effectively, with data visualization features that enhance the ability to identify application or infrastructure issues and respond to them.
This becomes critical, especially when you are dealing with a large volume of log data.
| Logging Benefit | Impact |
| Structured Format | Easy parsing/visualization |
| Standardized Protocols | Handles high-volume data |
We suggest that you ensure data logging is enabled and use Network Management Protocols or other standardized logging methods wherever possible.
You can use connectors that can translate your data into a standardized format.
5. Store Only Critical Event Logs
Storing only logs that provide insights about critical events is an observability best practice.
Certain logs must be managed and monitored
- Failed login attempts can be red flags that something is wrong. Multiple login failures in a short time period could indicate an attempt to break into the system. Of course, compliance reasons make it a must to manage and monitor them.
- Firewalls and other intrusion detection devices are an important first line of security. Though advanced attacks can nowadays circumvent most firewalls, monitoring logs here is a must.
- When control policies are not being followed or unauthorized changes are occurring, it could be unprofessional behavior, but it could also be something sinister. These changes could be catastrophic and actually bring down a network.
Critical logs to watch for:
- Policy violations: Flag unauthorized changes.
- Failed logins: Detect brute-force attacks; required for compliance.
- Firewall/IDS: Spot intrusions despite advanced threats.
Applications also generate a lot of logs that need to be monitored.
6. Centralize and Aggregate Data
DevOps culture is based on collaborative, consistent, and continuous delivery, and centralized logging plays an important role in it.
Without centralized data, management will be inefficient in the complex, large-scale environments in which DevOps teams operate.
With individual management of logs, the workload increases. This compromises the team’s ability to integrate and correlate data across multiple logs during troubleshooting.
This goes against the grain of DevOps culture.
Centralized logging by aggregating logs from all stages of the software delivery pipeline into a single place gives developers and IT engineers the end-to-end visibility they need to deliver software continuously and consistently.
With centralization, logs from development and testing environments are collected in the same place as production logs, making it easier for all to view and correlate data.
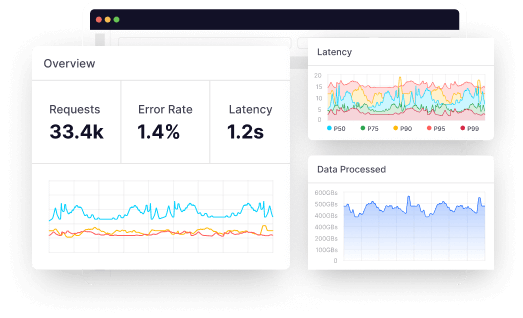
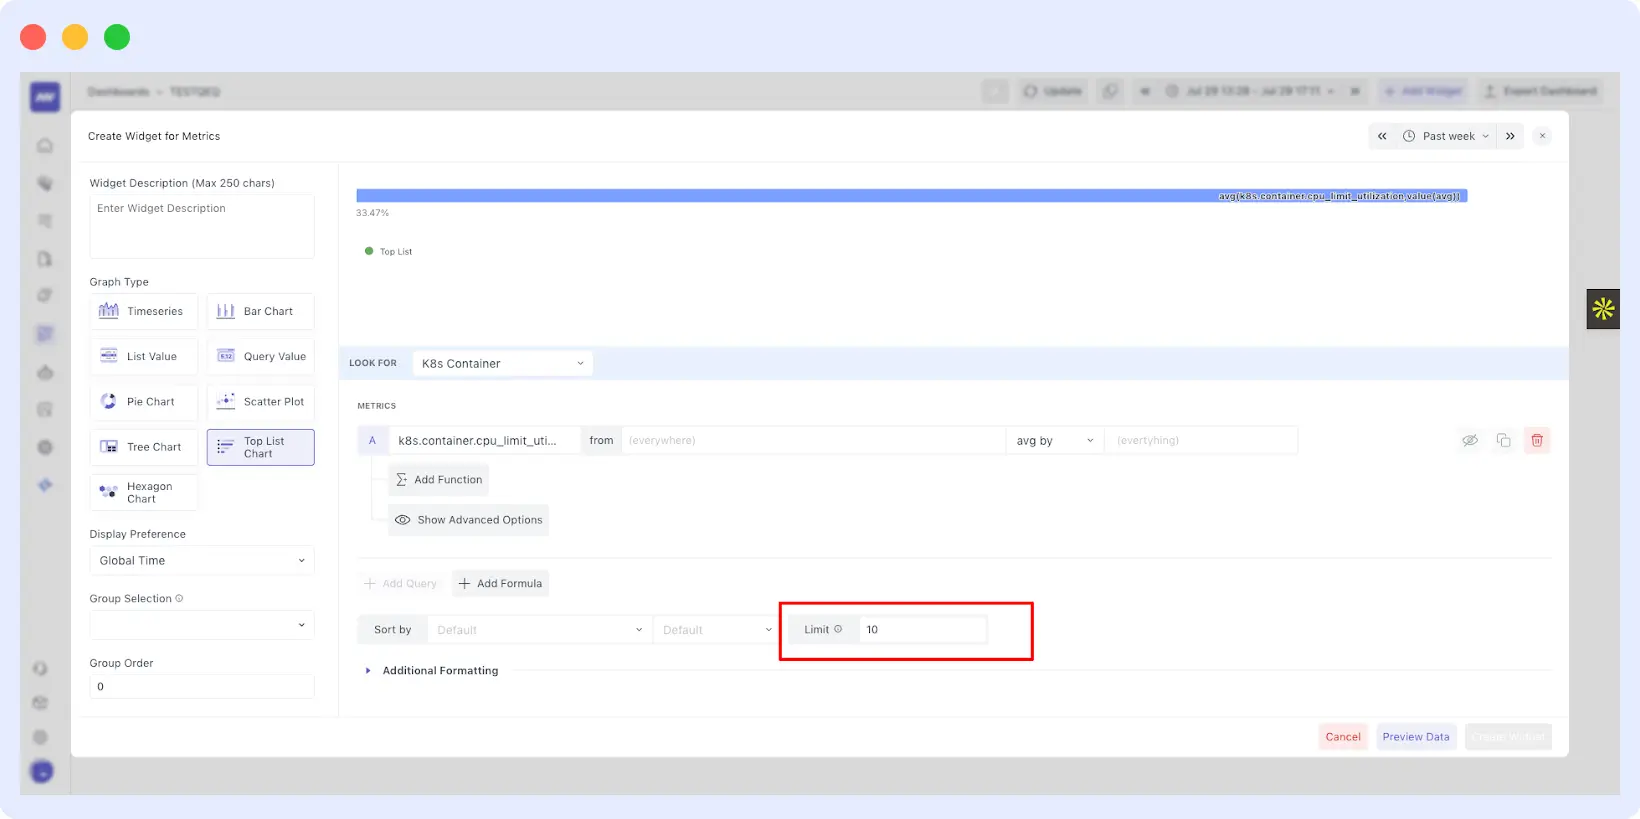
7. Build Custom Dashboards
Default dashboards may provide a starting point, but they are not designed to capture each system’s unique characteristics.
Custom dashboards can highlight important metrics, provide insights into the performance of critical components, and identify potential issues before they impact the system.
Custom dashboards can help identify and highlight important metrics specific to the system. Making it easier for IT teams to analyze and interpret data.
With Middleware, you can create custom dashboards in just a few easy steps and under a minute:
Also, dashboards have a larger audience than just system administrators and IT teams, and they are important for senior IT managers and business clients.
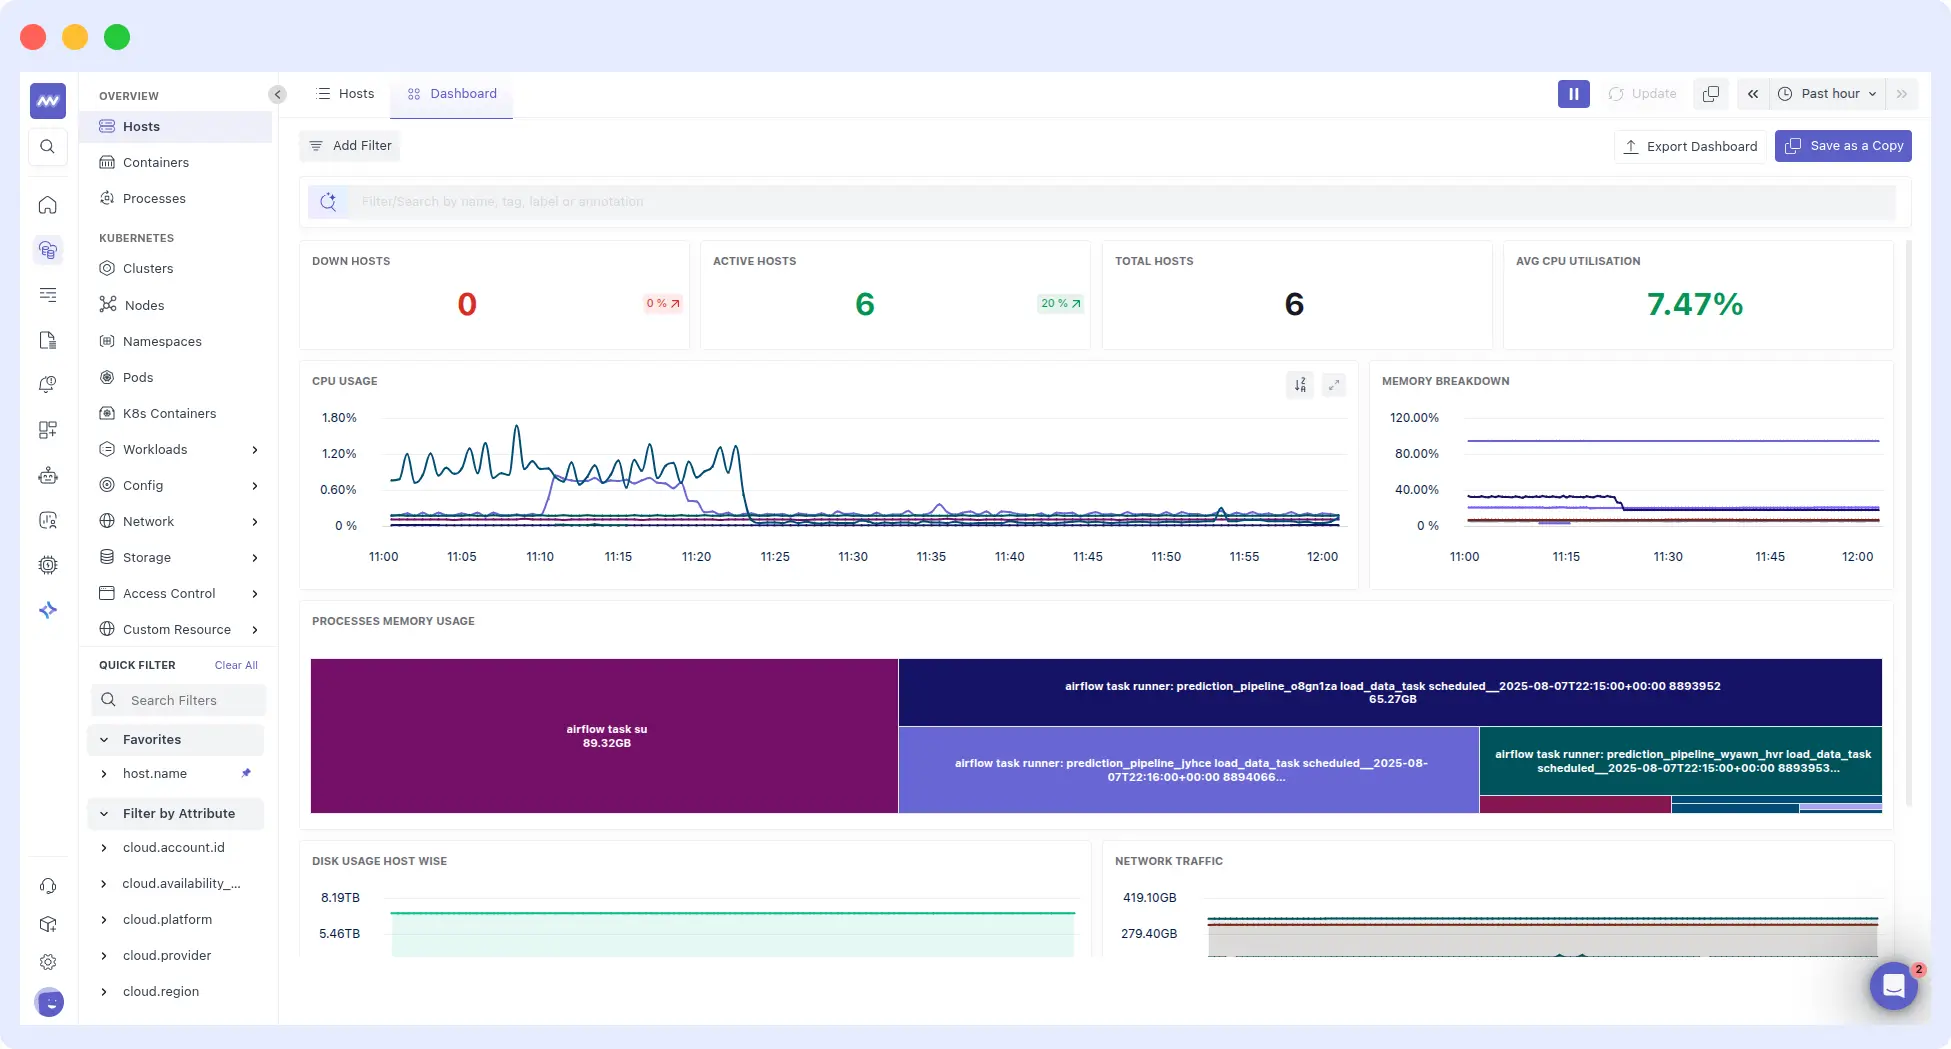
Dashboards should show the root cause of problems with trend analysis for IT professionals, along with the consequent business impacts that management requires.
8. Leverage Integrations
We recommend DevOps teams to automate observability systems for continuous ecosystem monitoring for any issues
Tools like the Middleware platform use AI-powered algorithms to collect and analyze data from across the entire infrastructure to spot signs of potential problems before they even occur.
Artificial intelligence and machine learning algorithms can help automate observability. You can store and process vast amounts of data and identify unique patterns and insights that will help you improve application efficiency.
Moreover, it allows you to scale up easily while eliminating human error.
🔹Explore Middleware integrations to unify logs, metrics, and traces across your DevOps ecosystem.
9. Integrate With Automated Remediation
Observability often identifies relatively low-level issues at the kernel or operating system level. Such issues are routinely addressed by system administrators who have tooling in place to automatically fix them by patching or applying extra resources to a workload.
Observability software, such as Middleware, can be integrated with the existing ecosystem to maintain an optimized environment. Having such a filter can ensure that, even when automation is not possible, IT teams can focus on critical issues and fix them as a priority.
10. Build Effective Feedback Loops in DevOps
Feedback loops are basically an internal review of how teams, systems, and users function, not necessarily in the context of Observability, but also in the larger DevOps context.
They are critical because they help improve development quality while ensuring on-time delivery. The objective of feedback loops is to create a loop between DevOps business units, i.e., development and user.
When a change occurs in one unit, it affects the other unit, eventually leading to a change in the first unit.
This makes the organization agile for continually performing required corrections. Using a feedback loop to collect data and maintain a continuous flow of information enhances Observability in the DevOps context.
Of course, feedback is great, provided you act on it. And that’s where you need to close the loop by solving the problem and tightening it for speed.
Else with an open loop, things will start failing, and teams will be lost as they have failed to find the root cause and communicate it.
High-performing DevOps teams don’t just monitor systems, they continuously learn from them.
Bonus: Master Proper Instrumentation for Observability
Check whether the instrumentation is provided properly; if not, go through it.
Instrumentation is the foundation of observability in systems. It’s like installing instruments (sensors) in your car to monitor its health. In software, instrumentation involves adding code to your application that gathers data about its internal workings. This data, called telemetry, is then sent to a collection system for analysis.
Here’s a breakdown of how instrumentation works in observability:
- Adding Instrumentation: You strategically place code snippets within your application to capture specific data points. This data can include:
- Metrics: Measurements that represent the state of your system (e.g., number of requests processed, database connection pool size).
- Logs: Textual messages containing events and details about what’s happening in your application.
- Traces: Records that track the flow of a request through your system, showing how different parts interact.
- Telemetry Collection: The instrumented code sends the telemetry data (metrics, logs, traces) to a central collection point. This can be a dedicated observability tool or a cloud service.
- Data Analysis: The collected data is then stored and analyzed. This allows you to:
- Monitor the health and performance of your application.
- Identify and diagnose issues quickly.
- Gain insights into how your application is behaving under different loads.
By having the right instrumentation in place, you gain valuable visibility into your system’s inner workings. This lets you proactively identify problems and ensure your application is running smoothly.
Here are some additional points to consider:
- OpenTelemetry: A vendor-neutral standard for instrumentation that lets you write code once and work with various observability tools.
- Minimizing Overhead: Instrumentation should be implemented thoughtfully to minimize its impact on application performance.
Overall, instrumentation is a crucial practice for achieving observability, enabling you to see what’s happening inside your system and make data-driven decisions to optimize performance.
Conclusion
Observability has become a necessary enabler of infrastructure as organizations migrate to decentralized IT platforms.
Without the capability to aggregate and analyze data across all IT platform areas, organizations open themselves to problems ranging from inadequate application performance and poor user experience to major security issues. Most importantly, they are constantly at risk of outages that can cost roughly $500K per hour of downtime.
Implementing the 10 observability best practices mentioned above can help organizations survive and thrive in today’s complex, dynamic environment.
FAQs
What are observability best practices?
Observability best practices include understanding your platform, selective monitoring, critical alerts, structured logging, centralized data, custom dashboards, AI integrations, automated remediation, feedback loops, and proper instrumentation, such as OpenTelemetry.
What is the difference between observability and monitoring?
Monitoring reacts to known issues via alerts; observability understands unknown system states through metrics, traces, and logs from external outputs, enabling proactive debugging.
Why centralize logs in DevOps?
Centralized logging aggregates dev/test/prod data for end-to-end visibility, cuts MTTR by correlating issues across pipelines, and supports a continuous delivery culture.
What is instrumentation in observability?
Instrumentation adds code to capture telemetry (metrics, logs, traces) sent to analysis tools; OpenTelemetry provides vendor-neutral standards minimizing performance overhead.