Collecting logs, metrics, and traces used to be a headache—you must reinstrument at each collection stage, and very few tools enabled unfettered collection.
But times have shifted—software and their respective data have become more automation-based than ever, precipitating an increase in frameworks and tools that offer automated monitoring and observability.
OpenTelemetry is one such framework that automates the capturing and transmission of telemetry data without altering app instrumentation. OpenTelemetry (OTel) unified the standard for service instrumentation and catalyzed the development of various observability tools.
OTel is, therefore, observability made easy. It is a leading project of the Cloud Native Computing Foundation (CNCF) after Kubernetes and a successor of two open-source distributed observability frameworks—OpenTracing and OpenCensus.
The history of Open Telemetry is closely tied to the evolution of modern application architecture and the growing need for more comprehensive observability.
In this article, we deep-dive into the architecture of Open Telemetry, how it works, and its many benefits for developers.
What is OpenTelemetry?
Open Telemetry is an open-source, vendor-neutral, observability framework for collecting telemetry data from applications and their supporting infrastructures to a backend platform to understand their health and performance.
Open Telemetry transforms and standardizes the way telemetry data is collected and transmitted. By instrumenting, collecting, and exporting telemetry data for analysis, OTel enables developers to observe the status of applications and how to debug or troubleshoot them for any issues.
In addition, with its unified form of instrumentation, you do not need to reinstrument code when they switch backend platforms, reducing the boilerplate code required to collect telemetry data.
OTel supports multiple programming languages and platforms, including Java, Python, Go, and Node.js, making it easy to use with various applications.
What is telemetry data?
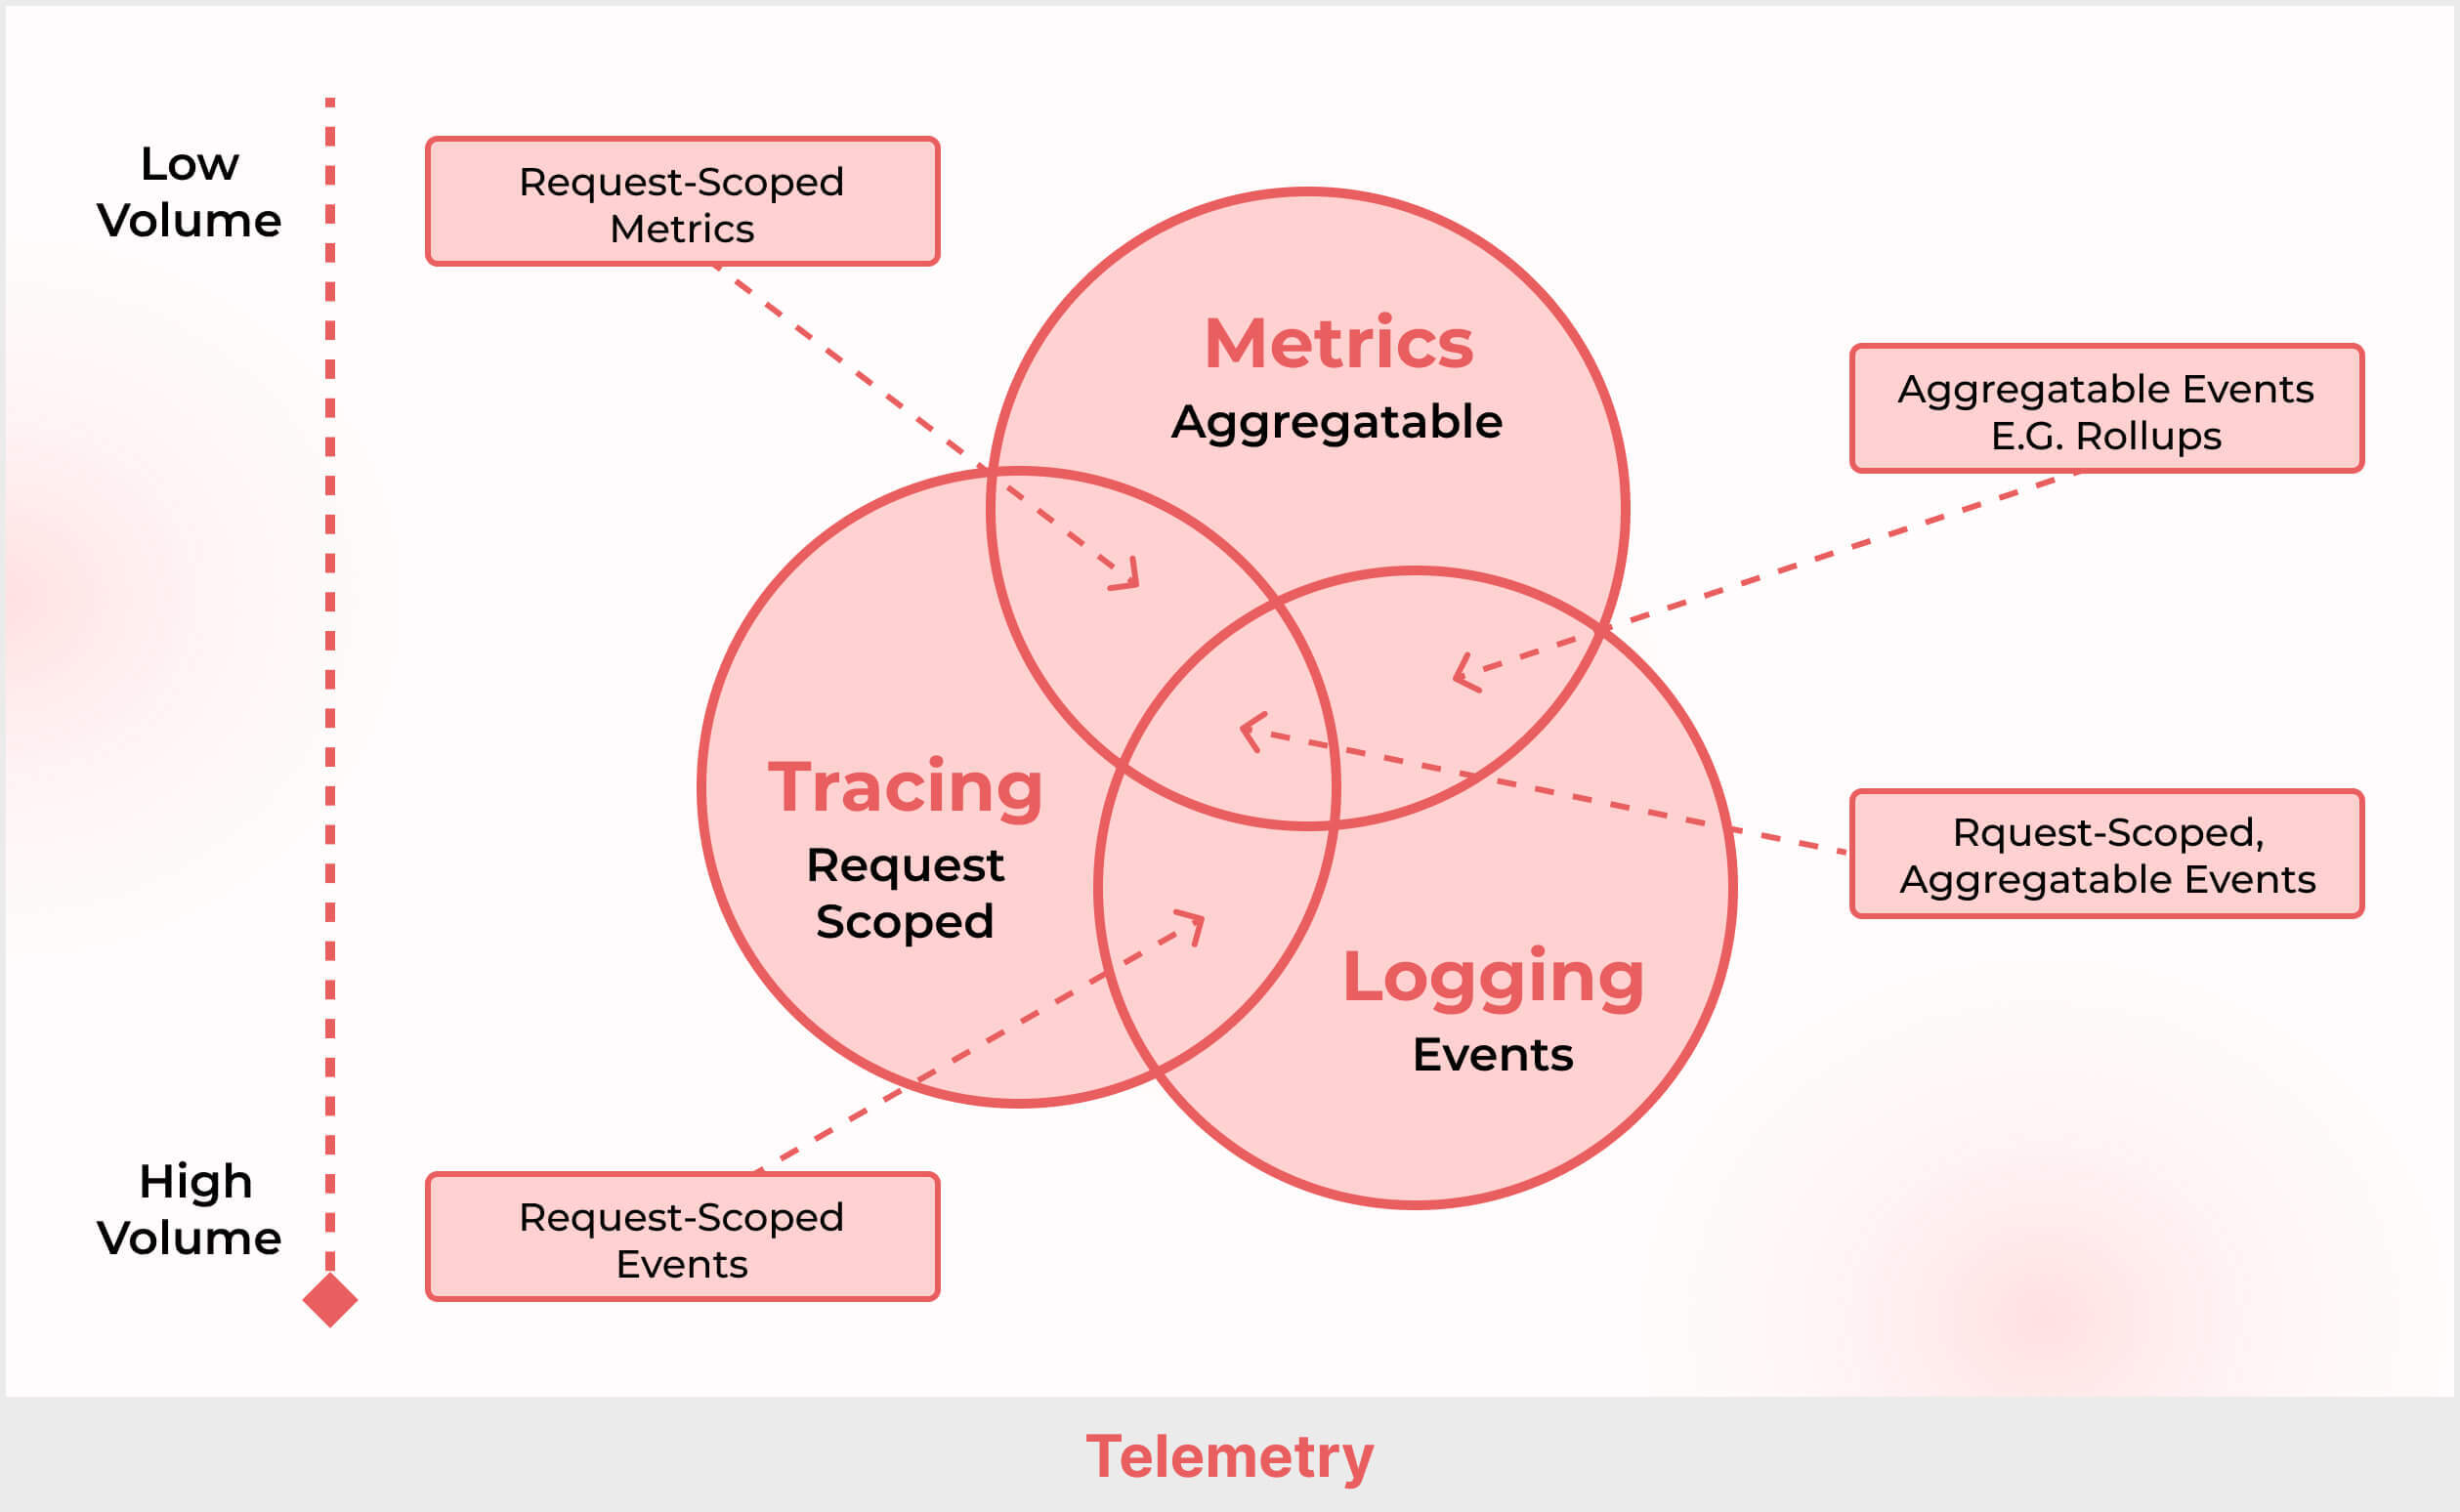
Telemetry data are the three pillars of observability—logs, traces, and metrics. They are collected at functional points within an application to ensure end-to-end visibility into the software and its dependencies.
It helps in application performance management, ensuring the software functions as expected and provides optimal user experience.
1. Logs
These are event-based records of happenings within an application and cloud infrastructure. Logs provide a chronological record of events and actions like user activity, system errors, and application events. Logs are used to troubleshoot issues, identify trends, and monitor system performance.
Cloud-based applications typically generate a large volume of logs, which can be challenging to manage and analyze. OTel offers tools that help collect, store, and analyze logs in real time. You can also integrate third-party solutions into the OpenTelemetry framework for log collection, storage, and analysis.
2. Traces
Traces display how an activity progresses within a system, more like throughput. It is a track of events from start to finish. Traces provide detailed information about the performance of a specific transaction or request.
A trace is a set of related spans that describe the lifecycle of a request. Each span represents a single operation within a trace, such as a function call or a database query. Spans are linked together to form a trace tree that shows the flow of a request through the system.
Traces may include data such as the time to complete the transaction, resources consumed, and any errors. Traces are used to diagnose performance issues and to optimize system resources. It is also used to monitor latency in systems.
3. Metrics
Metrics are measurable data points aggregated over a while. They are a specific type of telemetry data that provides quantitative measurements of system performance and behavior. For example, metrics may include resource utilization, network traffic, and memory usage.
You can use metrics to monitor various performance KPIs like response time, resource usage, error rate, throughput, and availability. Metrics monitor system performance, identify trends and make data-driven decisions to optimize system resources and improve their performance, reliability, and user experience.
How does Open Telemetry work?
Open Telemetry captures and transmits telemetry data with several components, especially the Application Programming Interfaces (APIs) and the Software Development Kits(SDKs).
The API defines the interface that applications use to generate telemetry data, while the SDKs are responsible for implementing the API and handling the processing and exporting of telemetry data.
The following is how OpenTelemetry works:
1. APIs
OpenTelemetry firstly instruments the application code using APIs. This is to generate telemetry data, instruct the application of metrics to gather and how to gather them, and ensure no code changes occur when switching between different SDK implementations.
2. SDKs
OTel provides libraries and language-specific integrations for developers to instrument their code and capture telemetry data. The OTel’s SDK is an OpenTelemetry client library for various programming languages like Java, Golang, and Python. OTel pools the data from these libraries and transmits it for processing and exporting.
With the aid of OpenTelemetry Protocol (OTLP), OTel sends data from the SDK to the Collector. The OTLP specification defines the encoding of telemetry data and the protocol used to exchange data between the client and the server.
3. OTel Collector
The OTel Collector collects telemetry data from SDK or any other source for onward transmission to a supported backend source. It is a central repository for receiving, processing and exporting telemetry data.
OpenTelemetry Collector can serve as a local collector for an application (by which it is deployed as an agent) and a central collector for multiple applications (here, it is deployed as a gateway).
4. Processing
Once the Collector collects the telemetry data with the aid of receivers, its processors then process the data. This comprises sampling, enriching, and aggregating the data, by applying filters and transformations to prepare it for export.
5. Exporters
OTel has a suite of exporters in the Collector that support multiple data formats. The exporters transmit the data to the backend or observability platform that you’ve chosen, such as Middleware. A developer can configure multiple exporters to send telemetry data to different destinations.
6. Observability
Once the telemetry data is exported to the chosen backends, it can be visualized and analyzed using observability tools, such as Grafana for metrics, Jaeger for traces, Kibana for logs, or Middleware built to analyze all forms of telemetry data.
Observability allows you to gain insights into the performance and behavior of your applications and infrastructure.
How Middleware collects, processes, and monitors OTel data
Middleware’s agent is an open telemetry collector. The collector receives processes and exports telemetry data to one or more backends. It is designed to be universal, allowing it to work across multiple open-source or commercial systems.
Middleware agent (Collector) has three components:
- Receiver
The receiver defines how data is gathered: pushing the data to the Collector during regular intervals or pulling it only when queried. If needed, the receiver can collect data from multiple sources. - Processor
The processor performs intermediary operations that prepare the data for exporting, such as batching and adding metadata. - Exporter
The exporter sends the telemetry data to an open-source or commercial backend, depending on what the user has specified. Like the receiver, the exporter can push or pull this data.
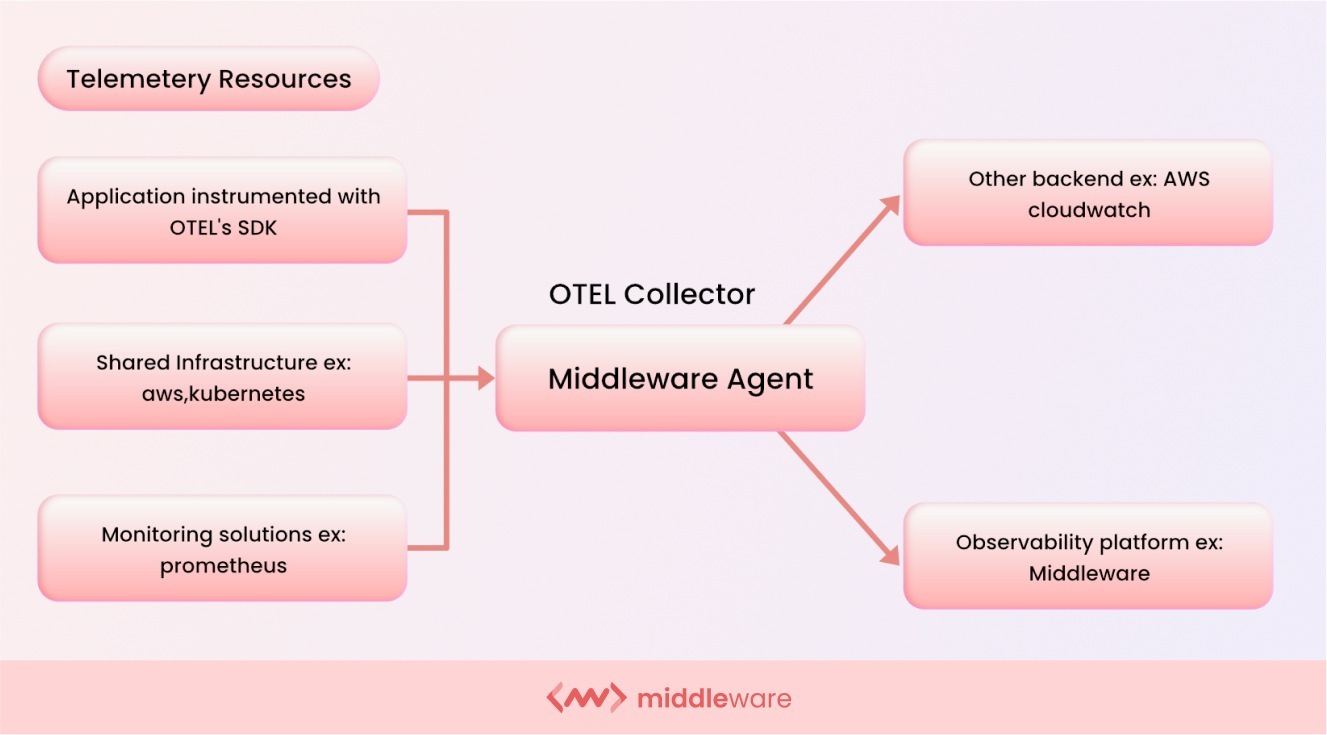
Once the Middleware agent is installed, it collects the data from Telemetry sources (ex: OTEL’s SDK, shared infrastructure, etc.) and processes the data, and sends it to Middleware Dashboard.
Refer to the following flow chart to understand this process:
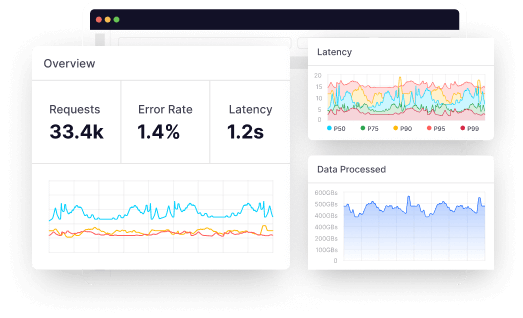
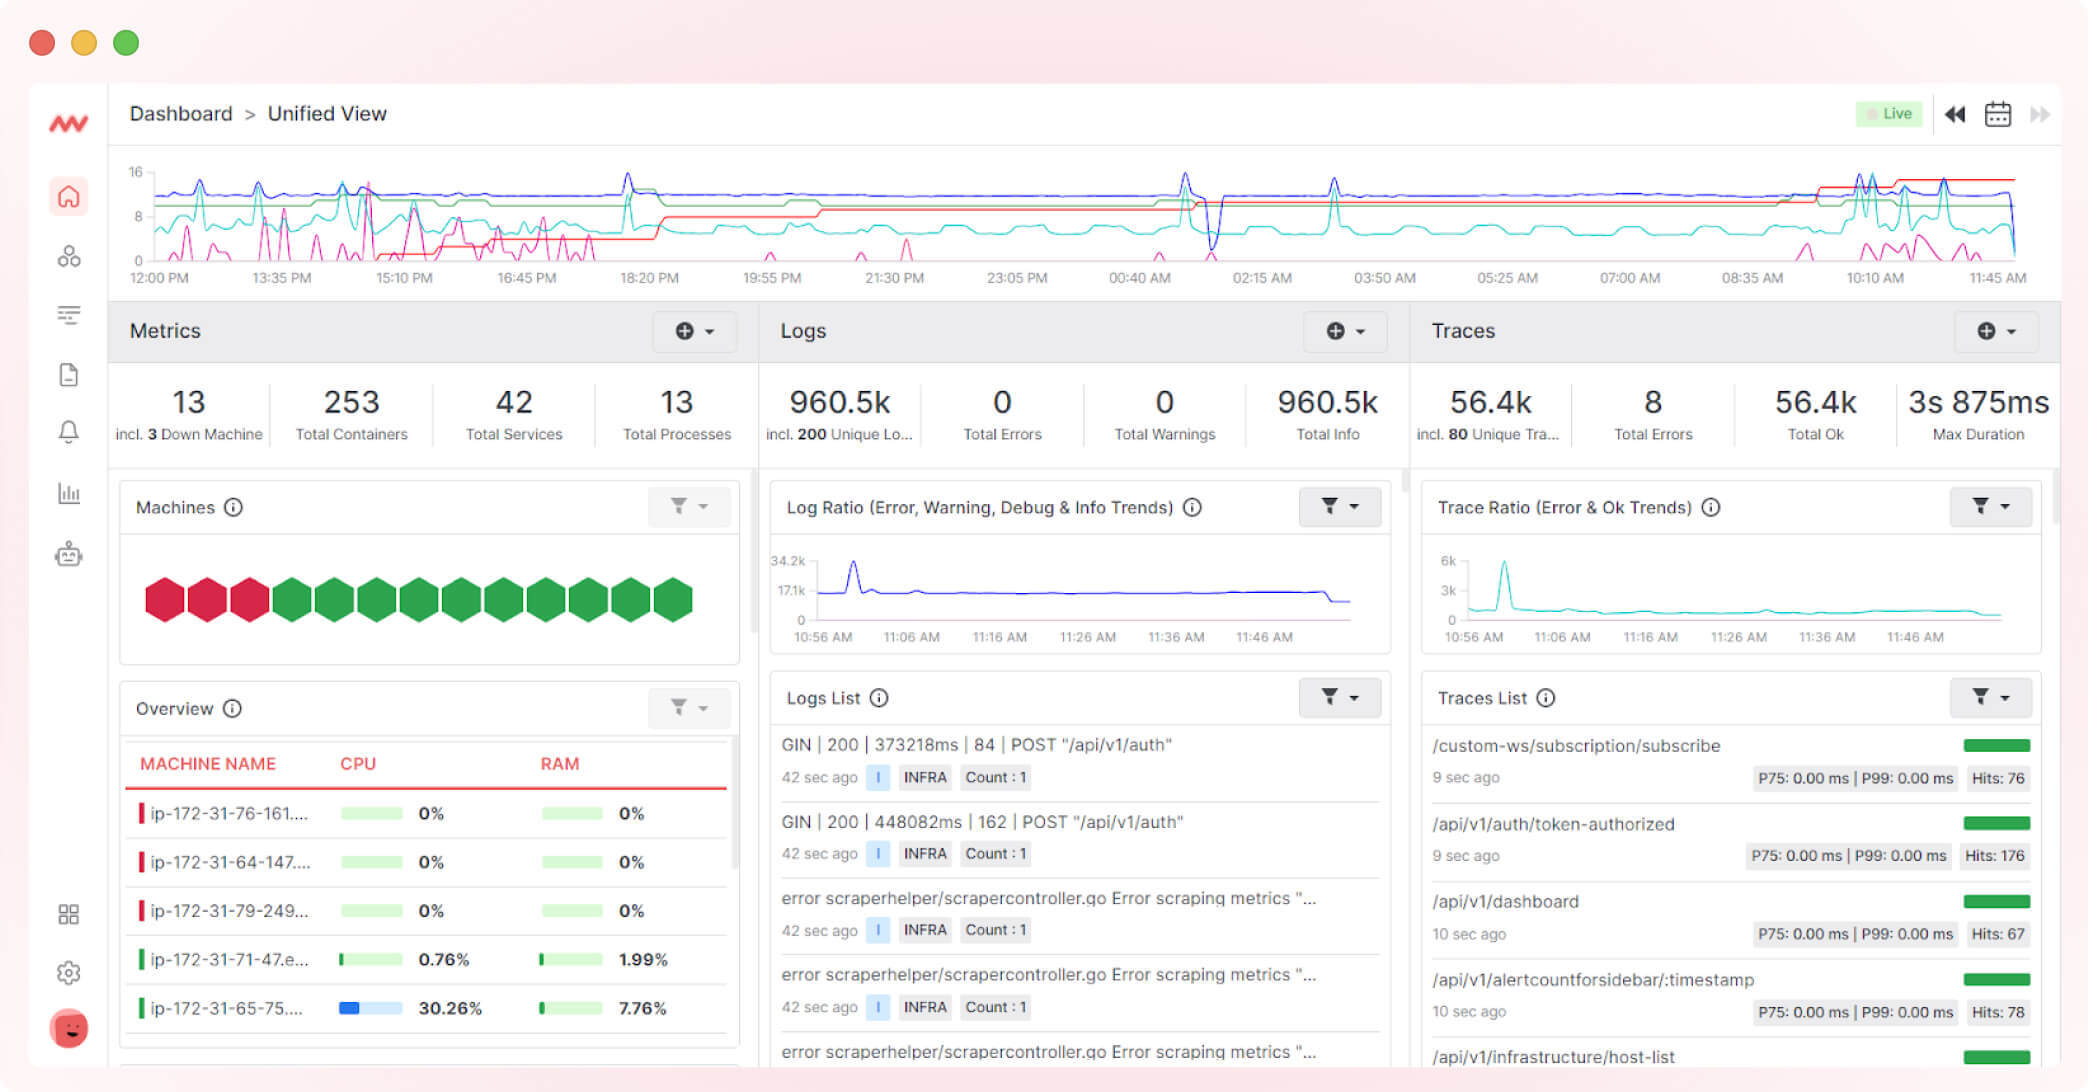
Once the Middleware agent (OTEL Collector) is installed, you can visualize the data in Middleware’s Unified Dashboard. You can see what’s happening in your infrastructure and application by looking at the data.
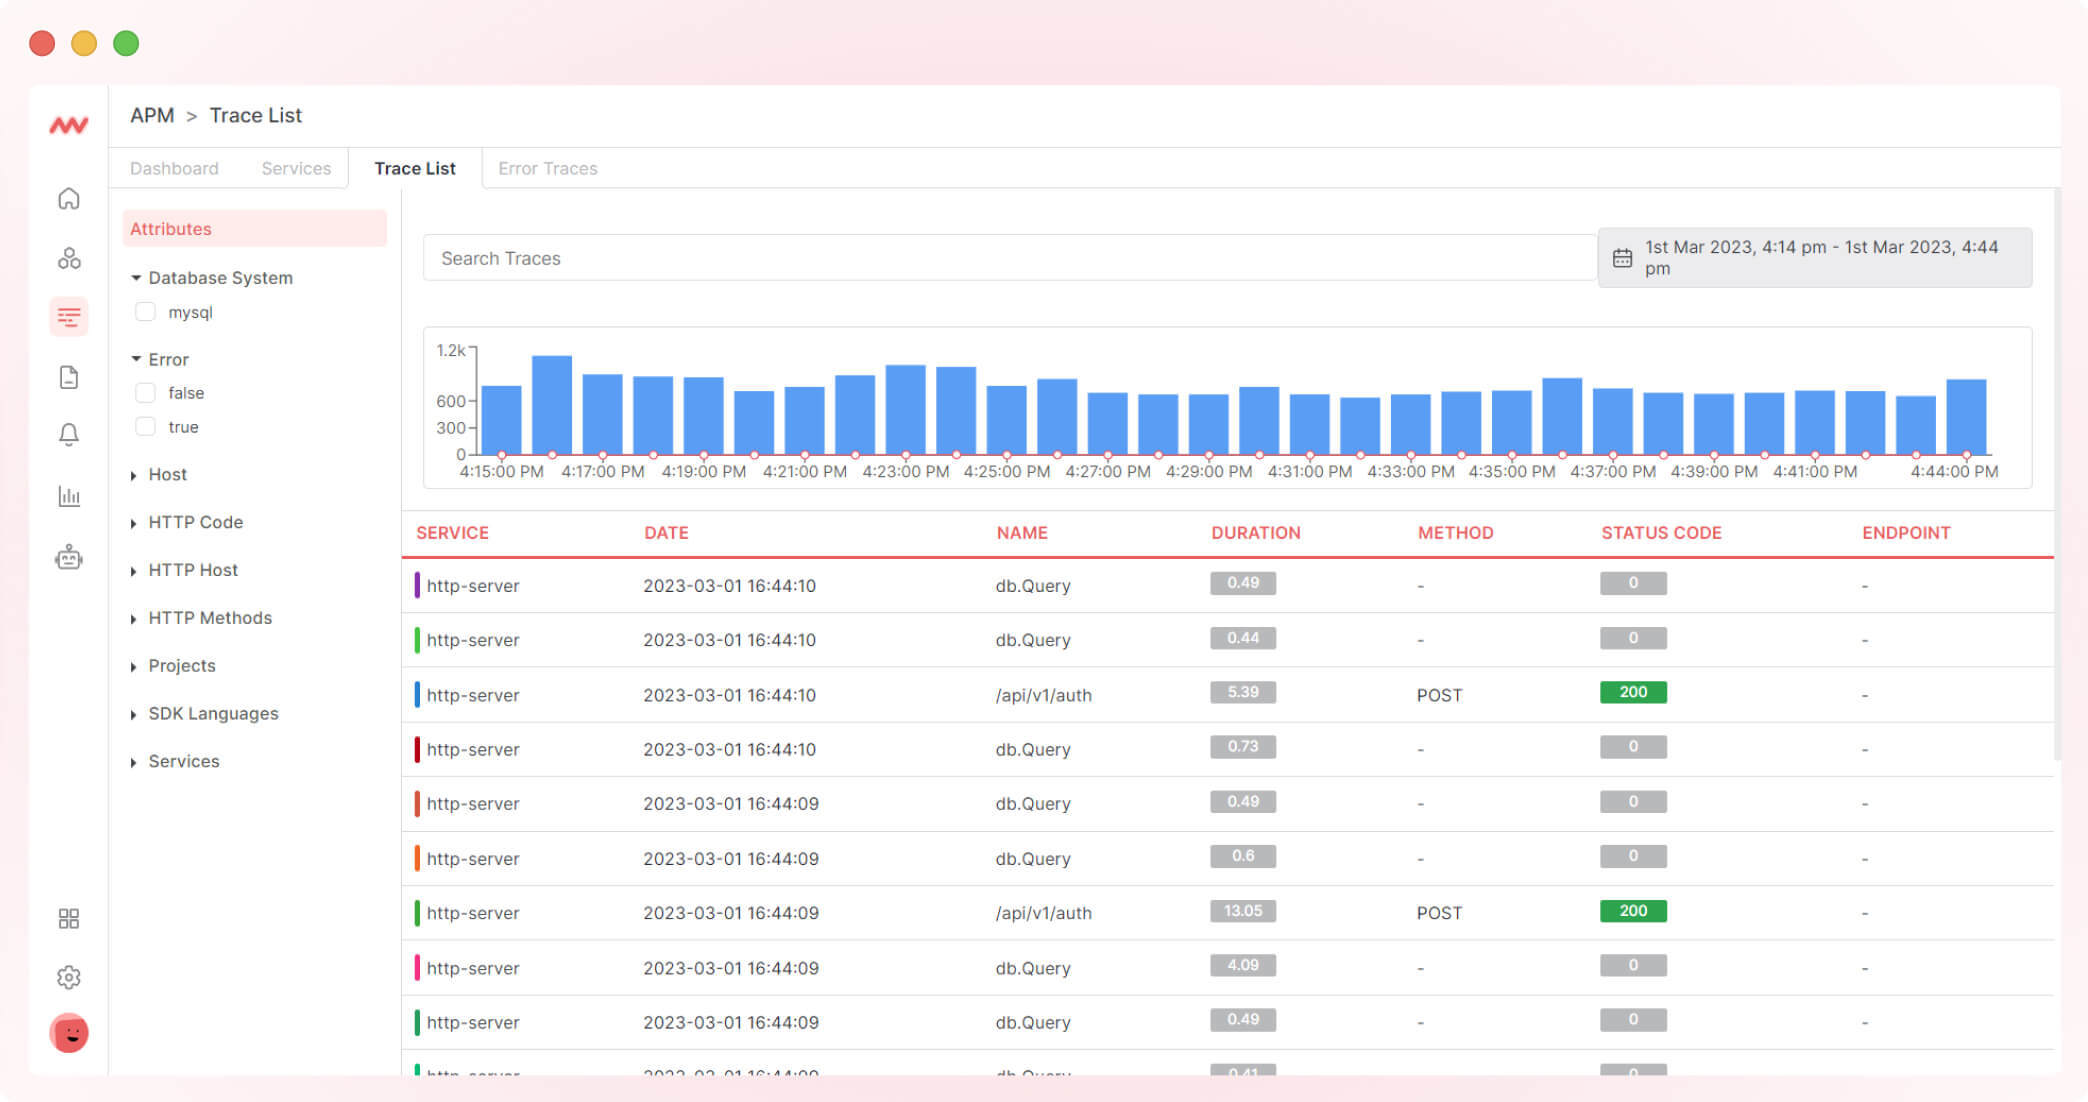
To look into your application, you can use Middleware’s APM, and to get more detail about any trace, you can click on the trace from the trace list and get all the details of the traces.
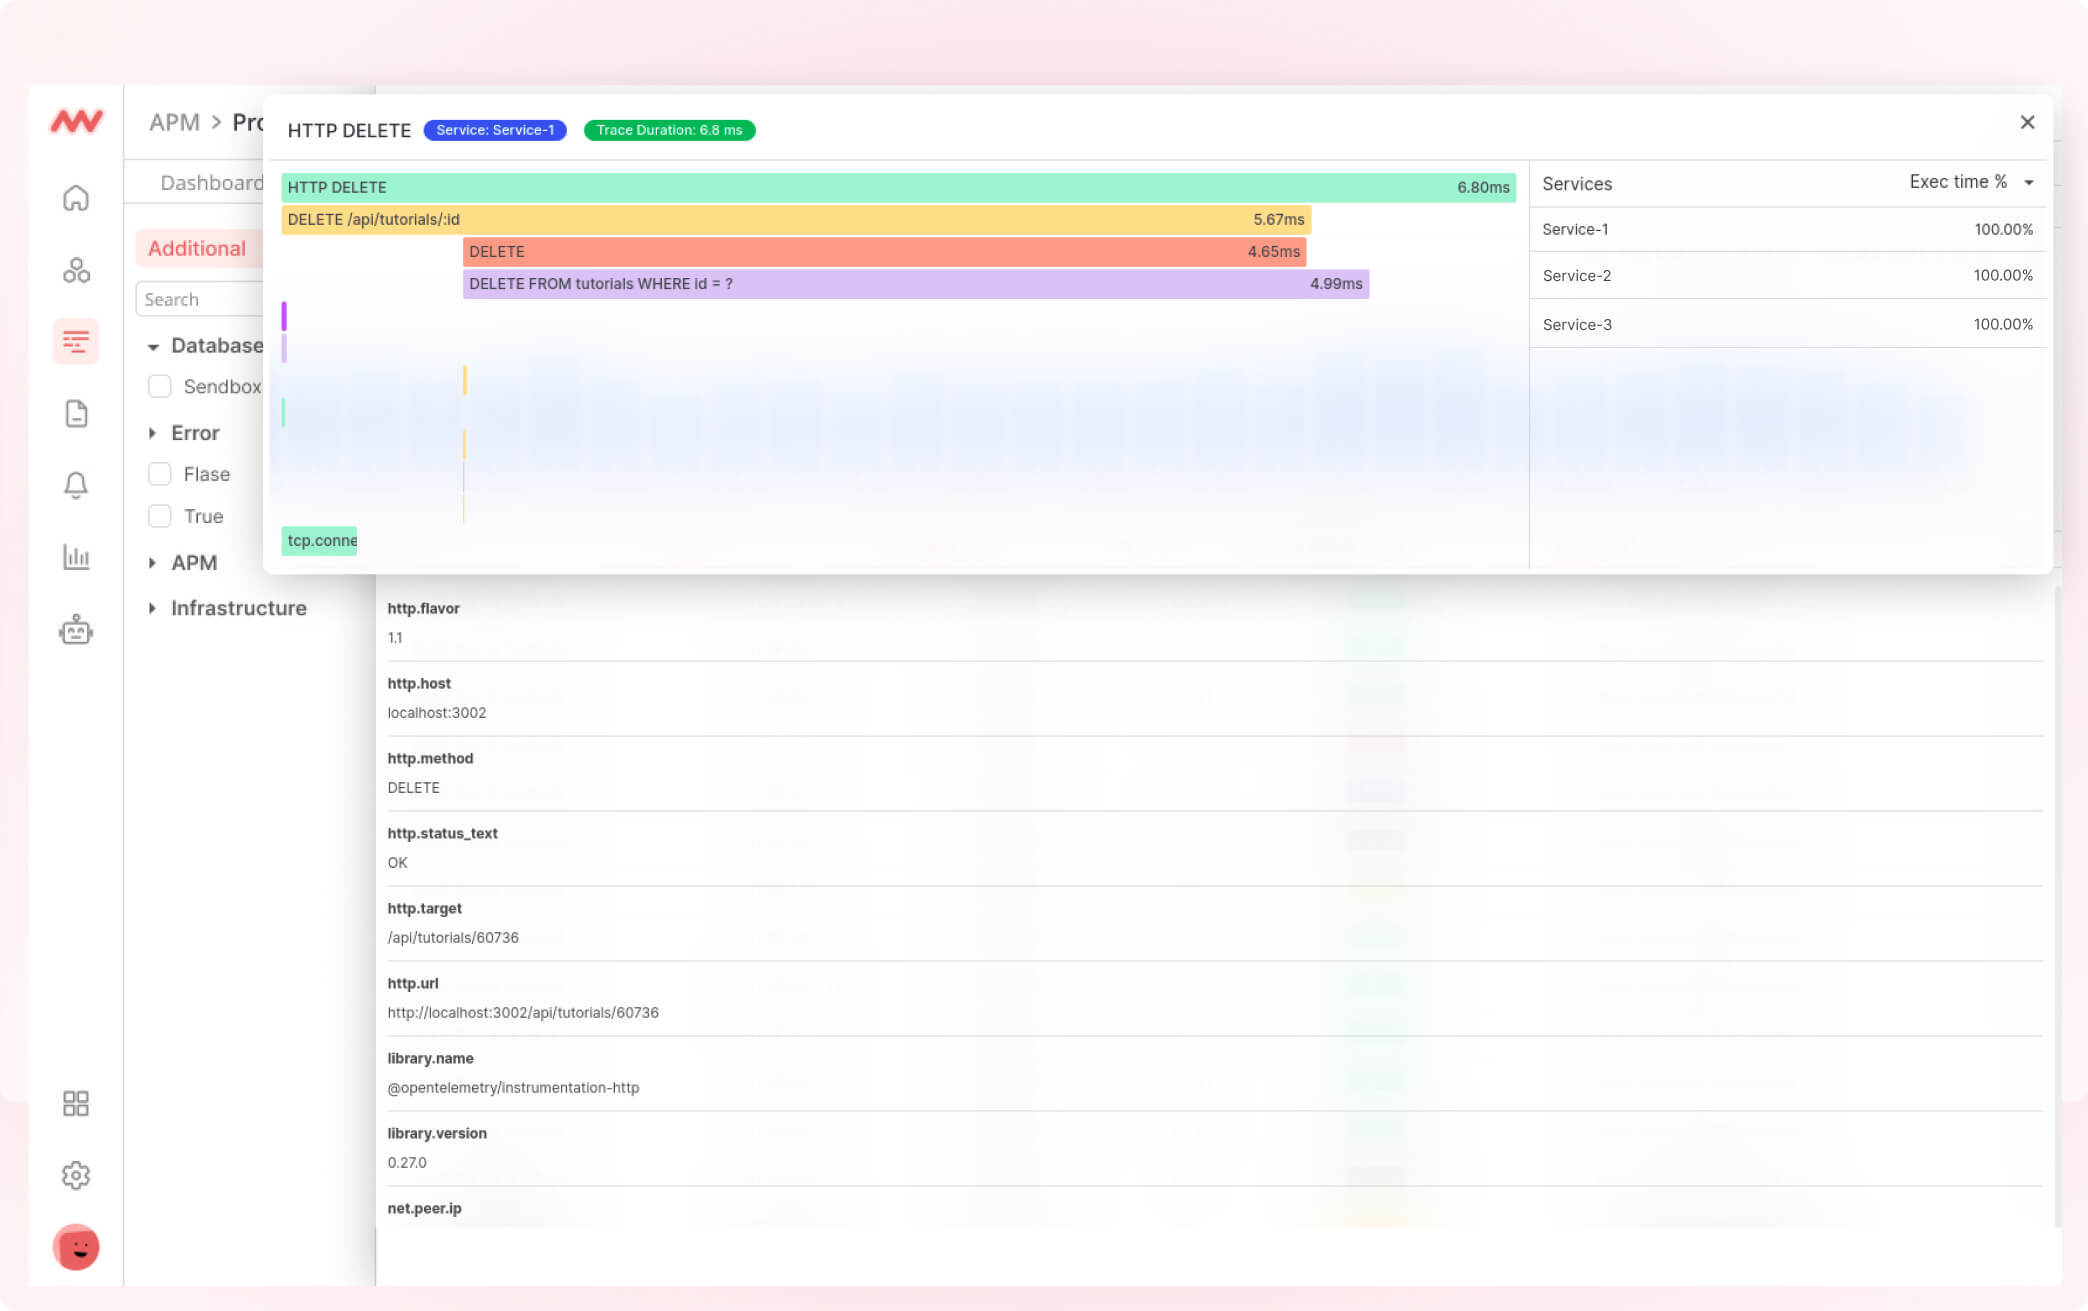
Then you can click on each and get more details:
What are the benefits of Open Telemetry?
OpenTelemetry is valuable to any observability stack a developer will amass, from its simplicity to flexibility and sophisticated features. The following are some of the critical benefits of OpenTelemetry:
1. Vendor-agnostic
OTel can work with any native or third-party vendor. This makes it highly flexible and scalable. And even in the face of innovation, OpenTelemetry is built for emerging compatibility.
2. Consistent instrumentation
The trend is that if you switch to a different framework, you must expend time and resources installing different proprietary agents or reinstrumenting your code.
With OTel, you do not have to alter or expend anything. OTel enables you to easily instrument your application and collect data on performance, errors, and other metrics data. This allows you to quickly compare data across different services, which is vital in a distributed system.
3. Increased visibility
OTel provides a unified view of your application’s performance and behavior, enabling you to easily monitor and troubleshoot your applications. This visibility eases the detection and diagnosis of issues in real-time, reducing downtime and improving the overall performance of your applications.
4. Interoperability
Various systems built with different programming languages can use OTel’s standard instrumentation across all services to exchange information. With this feature, OpenTelemetry bridges the gap of visibility, which is a giant step to reduce the complexity required in pre-existing observability frameworks.
Service instrumentation: The basic concepts
Observability is an investigation to comprehensively understand an application’s performance and health Instrumentation is the first step to observability.
In addition, instrumentation primes the codebase for the collection of telemetry data. Service instrumentation is, therefore, crucial and foundational to real-time observability.
There are two main approaches to service instrumentation—automatic and manual instrumentation. Both have advantages and disadvantages, and the choice of approach depends on the requirements of the application and the resources available for instrumentation.
Some applications even require a combination of manual and automatic instrumentation to achieve the desired instrumentation level.
Manual instrumentation
Manual instrumentation involves adding instrumentation code to the application codebase manually. You, as a developer, can do this during development. System administrators can also do it after deployment.
This instrumentation involves modifying code in specific locations to capture metrics, logs, or traces. Manual instrumentation can be time-consuming and error-prone, but it allows for fine-grained control over what data is captured and how it is collected.
Pros
- Increased control: With manual instrumentation, you have more control over what data is collected and how it is collected, leading to more relevant and accurate data.
- Targeted monitoring: Manual instrumentation allows you to target specific areas of the codebase for monitoring, which can help identify and address specific issues.
Cons
- Time-consuming: Manual instrumentation requires you to manually add monitoring and logging to the codebase, which can be time-consuming.
- Potential for errors: Manual instrumentation can introduce errors into the codebase if not implemented correctly, affecting service behavior.
Automatic instrumentation
Automatic instrumentation involves using specialized tools or libraries to automatically add instrumentation code to the codebase. You can do this during build or deployment.
This instrumentation significantly reduces the manual effort required to instrument an application and helps ensure consistent instrumentation across different application components.
However, automatic instrumentation is relatively less flexible and may not capture all relevant data.
Pros
- Easy to use: Automatic instrumentation requires minimal effort since instrumentation is automatically added to the code at runtime or compile time.
- Real-time monitoring: Since automatic instrumentation is usually implemented at runtime, it enables real-time monitoring, allowing for quick identification and resolution of issues.
Cons
- Lack of control: You have less control over what data is collected and how it is collected, which can hamper the relevance and accuracy of collected data.
- Limited customization: You can not customize how collected data will be stored in the codebase. This limits how much you can customize during metric analysis.
Open Telemetry use cases
Working with OpenTelemetry exposes you to boundless observability and monitoring scenarios. Some scenarios in which OTel is useful are:
1. Tracking performance metrics of distributed microservices/clusters
In a microservices architecture, applications are segmented into multiple clusters called microservices. Monitoring the performance of each microservice can be challenging, especially when dealing with large and complex systems.
OpenTelemetry enables you to unify the instrumentation of all your microservices through the APIS and collect performance data from each.
For example, suppose you are developing a non-monolithic e-commerce platform with a product catalog, checkout, and payment clustered in buckets.
In that case, you can monitor the performance of all these components by implementing OTel. You can then visualize these metrics in a dashboard to quickly identify bottlenecks and troubleshoot issues.
2. Continuous monitoring of cloud-native infrastructure
OTel standardizes the instrumentation and collection of data when monitoring your servers, containers, and databases. For example, suppose your cloud-native infra is running on a platform like AWS or Azure.
In that case, you can instrument each application component with OpenTelemetry and collect performance metrics such as CPU utilization, memory usage, and disk I/O. You can then use this data to continuously monitor your application’s health and performance. If any metrics fall outside predefined thresholds, you will receive alerts and take action to prevent downtime.
Conclusion
OpenTelemetry is a powerful open-source project that has revolutionized observability in modern software systems. Its components, including the SDKs, exporters, and collectors, provide a unified approach to collecting, processing, and exporting telemetry data from various sources consistently and efficiently.
By leveraging OpenTelemetry, developers can gain insight into the performance and behavior of their applications, identify bottlenecks and issues, and improve overall system reliability and user experience. OTel’s vendor-neutral nature enables its integration with third-party monitoring tools like Middleware.
In addition to telemetry data collection, Middleware offers analytical and dashboard customization features, allowing for more flexibility and coverage. Middleware also has an add-on feature that enables you to create custom dashboards for visualizing collected telemetry data, allowing for more flexibility than usual.
Additionally, Middleware stores telemetry data in S3 instead of traditional warehouses or systems. Start collecting OTel data for free today!