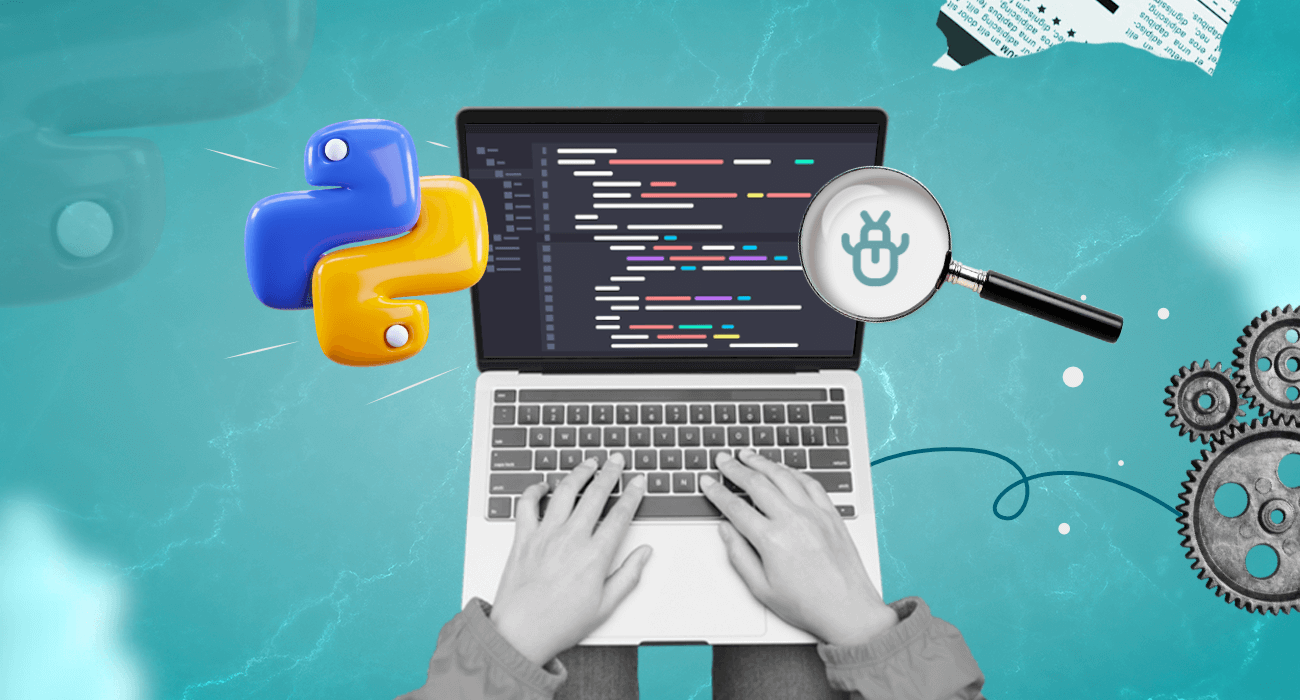
Debugging is one of the most challenging aspects of application development. Well thats correct, but how you can debug issues and troubleshoot them.
This is where logging play a vital role and is essential for monitoring and debugging applications, providing insights into real-world performance. Adopting a proper logging practices can help developers to monitor, debug, and identify patterns to inform product decisions.
If you build applications in Python, logging enables the generation of log messages of varying severity. This article provides an in-depth overview of best practices and how to implement them for effective Python logging.
The basics of logging in Python
Five terminologies bedrock logging in Python. The table below is an overview of each.
| Logger | The primary component of the Python logging module. It is responsible for emitting log messages to various handlers. You instantiate a logger object with a name and call methods to emit log messages of different severity levels. |
| Handler | Responsible for processing and emitting log messages received from a logger object. It determines how the log message is outputted. The Python logging module has a set of handlers—StreamHandler, FileHandler, SocketHandler, SMTPHandler, SysLogHandler, etc. |
| Formatter | Determines how the log message is formatted before the handler outputs it. It takes a message and formats it into a readable form, typically adding attributes such as the logger’s name, the log message’s severity level, the time the log message was created, and the message itself. |
| Level | Defines the severity of a log message and helps you identify the severity of a problem. Logging levels include Debug, Info, Warning, Error, and Critical. When a message is logged with a particular level, all messages of the same level or higher severities are recorded. For example, if you log a message with the ERROR level, logs with the ERROR and CRITICAL levels are recorded. |
| Filter | An optional component controls which log messages are processed or emitted by a logger. It provides finer granularity by specifying the criteria of each log. |
Understanding different logging levels
There are five levels of severity—DEBUG, INFO, WARNING, ERROR, and CRITICAL.
1. DEBUG
Debug is the lowest severity level and provides a detailed account of the application’s state and execution.
2. INFO
This log level provides general information about the program, such as when it starts or stops.
3. WARNING
This indicates that something unexpected happened, but the application can recover.
4. ERROR
It indicates that the application encountered an error, which can potentially cause the application to fail.
5. CRITICAL
This log level indicates that a critical error or failure occurred, which can cause the application to stop unexpectedly.
Getting Started with Logging in Python
To monitor your Python application using Middleware, you must create an account.
Install the Middleware agent on your Python application using our easy one-step installation or one-step auto instrumentation commands provided in the system. For more about Middleware configuration, check our documentation.
Upon successful installation, the Python APM will add severity-based logging support and data export rules so that telemetry data can be forwarded to the Middleware Agent.
To set up your application with Middleware’s Python APM for visualization, install the Python package by running the command below in your terminal:
pip install middleware-apm
Add the below query at the very start of your project to the import tracker:
from apmpythonpackage  import apmpythonclass
tracker  =apmpythonclass()
tracker.mw_tracer  ({APM-PROJECT-NAME}, {APM-SERVICE-NAME})
Run the command below for distributed tracing:
middleware-instrument --resource_attributes=project.name={APM-PROJECT-NAME} --metrics_exporter none --exporter_otlp_endpoint http://localhost:9319 --traces_exporter otlp --service_name {APM-SERVICE-NAME} python3 .py
To start logging Python applications in Middleware, run this command:
handler  = tracker.mw_handler()
logging.getLogger().  addHandler(handler)
logging.error  ("error log sample")
You will see all requisite information about your application on ONE unified dashboard.
Top 12 Python logging best practices
The following are the top 12 Python logging best practices to debug your applications faster.
1. Set the optimal logging level
Determine your activity and set the optimal logging level for your application to balance useful information and performance.
Setting the logging level to higher levels, such as WARNING, will limit the amount of information in the logs, while setting it to lower levels, such as DEBUG, may flood the logs with excessive information.
Thus, it is recommended to set the logging level to DEBUG during development and INFO or higher levels in production. To carry out this practice, here is an example code to call:
python
import logging

# Setting the logging level
logging.basicConfig(
    level=logging.INFO,
    # Other configurations
)

# Example log messages
logging.debug  ('Debug message')
logging.info  ('Info message')
logging.warning  ('Warning message')
logging.error  ('Error message')
logging.critical  ('Critical message')
In this example, the logging level is set to INFO. Only messages at the INFO level or above will be logged.
2. Configure Loggers at the module level
Configure logging at the module level to ensure that each module logs only what it is responsible for.
This helps to prevent loggers from being neglected and wasted, allowing reusable modules to log messages effectively to the central logging system.
To carry out this best practice, here is a practical coding example:
python
import logging

# Creating a logger
logger  = logging.getLogger(__name__)

# Setting up a FileHandler for this logger
handler  = logging.FileHandler('module.log')
handler.setLevel  (logging.INFO)

# Defining the logging format
formatter  = logging.Formatter('%(asctime)s %(levelname)-8s %(message)s')
handler.setFormatter  (formatter)

# Adding the handler to the logger
logger.addHandler  (handler)

# Example log message
logger.info  ('This is a log message from the module')
In this example, a logger is created for the module, and a FileHandler is set up to direct log messages to a file. The handler is set to log messages at the INFO level or higher, and the logging format is defined.
3. Use Timestamps with consistent formatting
Timestamps provide valuable insight into the sequence of events in an application. It is used to identify when a specific event occurred and how long it took and may aid in identifying performance bottlenecks.
Since timestamps provide unique identification for each logged message, ensure that timestamp formatting stays consistent across all applications.
This consistency helps avoid confusion and ensures the proper sorting and long-term management of log data.
Adopting the ISO-8601 format for timestamps is recommended, which specifies the ordering of date and time elements. The format includes the year, month, day, hour, minute, second, and time zone in the following format:
YYYY-MM-DDTHH:MM:SS.sssTZD
Here is an example of how the ISO-8601 format for timestamps may look like:
“` python
2021-07-15T11:45:26.123Z
“`
This ISO-8601 format first gives the date (2021-07-15) and is separated by the letter “T” from the time (11:45:26), which is then separated by a period followed by the milliseconds (123) and ending with the timezone (Z).
4. Use structured logging
Structured logging involves logging data in a structured manner using a key-value pair format. It enables logging to store data in an organized and more machine-readable format (so-called JSON or CSV) that later becomes useful in optimizing data analysis and application debug processes.
This makes filtering, searching, and analyzing logs by specific fields or values easier.
Here is how to use structured logging in Python:
python
import logging

# Configuring the logger
logging.basicConfig()  .setLevel(logging.INFO)
logger  = logging.getLogger(__name__)

# Logging structured data
logger.info  ("Purchase event occurred", extra={
    "event_name": "purchase",
    "product_name": "iPhone",
    "customer_id": "12345"
})
5. Use different logging levels
When you log messages, use different logging levels like DEBUG, INFO, WARNING, ERROR, or CRITICAL, depending on their importance.
It assists in filtering the log messages easily and thus saves time when you want to debug the code. It also enables you to manage the logs better and focus on log messages relevant to your needs.
Below is an example of how to use different logging levels in Python:
python
import logging

# Setting up logger configuration
logging.basicConfig  (format='%(asctime)s %(levelname)s: %(message)s', level=logging.INFO)

# Debug level logging
logging.debug  ('Debug message')

# Info level logging
logging.info  ('Info message')

# Warning level logging
logging.warning  ('Warning message')

# Error level logging
logging.error  ('Error message')

# Critical level logging
logging.critical  ('Critical message')
6. Use log rotation
Integrate log rotation as part of your logging management system to ensure the application doesn’t run out of disk space and reduce the risk of overwriting important logs.
Logically, older logs should get deleted while newer logs are retained, and relevant logs, usually ones formed during the current week, should be compressed and archived.
In Python, the log rotation process is accomplished using the RotatingFileHandler class. This class provides a simple and flexible way to rotate log files based on certain criteria, such as time or file size.
Here’s an example of how to use the RotatingFileHandler class in Python to implement log rotation:
import logging
from logging.handlers import RotatingFileHandler

# create a rotating file handler with a max size of 10MB and a backup count of 5
handler = RotatingFileHandler  ('logs/myapp.log', maxBytes=1024*1024*10, backupCount=5)

# configure the log format
formatter  = logging.Formatter('%(asctime)s - %(levelname)s - %(message)s')
handler.setFormatter(formatter)

# set the logging level to INFO
logging.basicConfig  (level=logging.INFO)

# add the handler to the logger
logger  = logging.getLogger(__name__)
logger.addHandler(handler)

# start logging events
logger.info  ('Hello, world!')
In the above example, we first import the necessary modules and create a RotatingFileHandler object with a maximum file size of 10MB and a backup count of 5. We then configure the log format and set the logging level to INFO.
Finally, we add the handler to the logging object and start logging events using the logger.info() method.
As new log entries are added, the RotatingFileHandler class will automatically manage the log files according to the specified parameters, ensuring that the log files do not become too large or unwieldy.
7. Avoid logging sensitive information
Don’t log sensitive information like passwords, private keys, or credit card details. Logging sensitive data within the application brings a significant security risk, so leaving sensitive, personal information out of the logs is best.
If it is necessary to log such information, it should be encrypted to prevent unauthorized access. You can also scrub or mask the sensitive data before logging it.
Here’s an example of how to carry out this practice:
import logging

# Create a logging object
logger   = logging.getLogger(__name__)

# Define a function to mask sensitive data before logging
def mask_data(data) :
    if isinstance(data, str) and '@' in data:
        # If it's an email address, mask it
        username, domain = data.split('@')
        username = '*' * len(username[:-2])
        domain = '*' * len(domain)
        return f"{username}@{domain}"
    elif isinstance(data, str) :
        # If it's a string containing sensitive data,
        # replace it with asterisks
        return '*' * len(data)
    elif isinstance(data, dict) :
        # If it's a dictionary, mask the values
        # of any keys with sensitive data
        sensitive_keys = ['password', 'credit_card_number']
        for key in data.keys():
            if key in sensitive_keys:
                data[key] = '*' * len(str(data[key]))
        return data
    else :
        # Otherwise, leave it unchanged
        return data

# Define a function to log a message with sensitive data
def log_sensitive_data() :
    # Sensitive data to log
    email  = 'sensitive.email@example.com'
    password  = 'mysecretpassword'
    credit_card  = '1234-5678-9012-3456'

    # Mask sensitive data before logging
    email  = mask_data(email)
    password  = mask_data(password)
    credit_card  = mask_data(credit_card)

    # Log the message with masked sensitive data
    logger.info(f"User login attempt with email: {email} and password: {password}. Credit card number: {credit_card}.")
In the above example, we defined two functions: mask_data() and log_sensitive_data().
The mask_data() function masks any sensitive data that is passed to it before it is logged.
The log_sensitive_data() function logs a message that contains sensitive data, but first, it ensures the sensitive data is properly masked using the mask_data() function.
8. Use descriptive log messages
Use descriptive log messages that accurately describe what’s happening in the application to provide meaningful context to the log reader.
A descriptive log message should include important details such as the event that occurred, the location of the event, the time it occurred, and any relevant metadata.
Here’s an example of how to use descriptive log messages in Python:
import logging

# create a logging object
logger = logging.getLogger(__name__)

# define a function that performs some database operation
def perform_database_operation(data) :
    logger.info  (f'Performing database operation with data: {data}')

    # some code that accesses the database

    logger.info  ('Database operation complete.')

# call the function
data  = {'key': 'value'}
perform_database_operation(data)
In this example, we perform a database operation and log the data used. Including this information in the log makes it easier to diagnose issues related to the database operation and ensures that our logs provide useful information for troubleshooting.
9. Utilize log analysis tools
Consider using log analysis tools like Middleware to analyze, interpret, and display your logs. These tools offer useful features when tracking down an issue in large-scale applications.
They are also used to search, filter, and sort through large volumes of log data to identify patterns, troubleshoot issues, and improve the application’s overall performance.
Middleware’s simple and seamless integration process with Python applications has been discussed earlier.
10. Incorporate log health checks
Regular log health checks should be conducted to ensure the logs are generated correctly and accessible.
This involves checking if there are new messages, whether the logging framework is still active, and whether log files are accumulating excessively.
Log health checks help to identify issues such as missing or incomplete logs, slow performance, or excessive disk usage.
11. Be mindful of performance impacts
Logging can impact the application’s performance, especially if excessive logging is utilized. Logging costs time and system resources, so excessive logging slows down your application or even crashes.
One of the many ways to optimize logging performance is by using formatted logging messages sparingly. Instead of using expensive formatted messages (such as f-strings or % formatting), you can use string concatenation with the `+` operator:
import logging

# create a logging object
logger  = logging.getLogger(__name__)

# define a function that performs some database operation
def perform_database_operation(data)  :
    logger.info  ('Performing database operation with data: ' + str(data))

    # some code that accesses the database

    logger.info  ('Database operation complete.')

# call the function
data  = {'key': 'value'}
perform_database_operation(data)
In this example, we used string concatenation rather than formatted messages to log the data. This is a more performant approach and can help speed up logging operations.
12. Coordinate log levels with third-party libraries
In complex applications, it is common to use third-party libraries. When using third-party libraries, ensure that log levels with these libraries align with those used in your application.
This prevents logs from these libraries from flooding the application logs with redundant information or noise. Failure to so coordinate leads to inconsistencies in debugging efforts and partial code coverage.
Use Middleware for real-time error tracking
By integrating Middleware into your application architectures for monitoring, you will gain real-time error tracking of your applications.
Middleware natively complies with all the Python logging best practices discussed earlier. Three key features set Middleware apart from other logging tools:
1. Real-time error alerting and analysis
Middleware provides real-time insight into application errors, allowing developers to respond to and fix issues that arise quickly. With Middleware, you can set up alerts to notify you of critical errors and failures and diagnose issues in real-time to resolve them quickly.
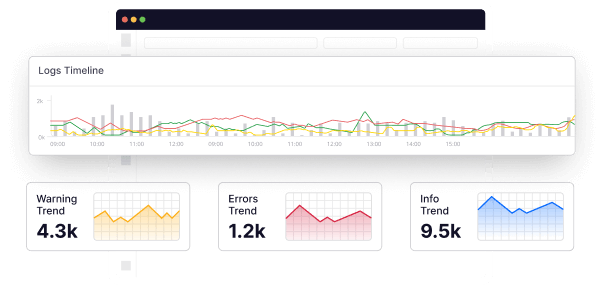
2. Telemetry and timeline data
Middleware tracks and analyzes telemetry and timeline data across an application, giving developers a comprehensive view of how the application is performing. This includes CPU and memory usage data, network traffic, and application behavior, among other things.
3. Unified timestamping
Middleware provides unified timestamping across an application, helping developers to correlate log messages and telemetry data and gain deeper insights into the application’s behavior.
With the unified timestamp, you can easily identify the root cause of issues and better understand how your applications are performing over time.
In closing
Implementing the best practices for Python logging can significantly improve an application’s diagnosability and debugging efficiency.
However, it is important to note that these practices alone may not provide the full observability required to maintain and improve complex applications.
In such cases, adding observability tools like Middleware can fill the gaps and provide a complete understanding of the system’s behavior, performance, and faults. Sign up now to see it in action


