
Summary: Infrastructure monitoring is essential for organizations running cloud and distributed systems. However, many teams still treat it as simple uptime tracking rather than a source of operational insight. This guide explains its importance and how modern teams use it to ensure reliable, high-performing environments.
Key Takeaways
- Infrastructure monitoring provides real-time visibility into system health across compute, storage, and network layers.
- Modern environments require correlation across metrics, logs, and traces, not siloed monitoring.
- Effective monitoring reduces MTTR, prevents cascading failures, and supports capacity planning.
- Cloud-native architectures demand automated discovery and dynamic alerting.
- Monitoring is evolving toward observability-driven operations and AI-assisted incident response.
What is Infrastructure Monitoring?
Infrastructure monitoring is the process of collecting, analyzing, and correlating telemetry data across infrastructure components. It enables teams to detect infrastructure anomalies early, respond more quickly to performance degradation, and maintain service reliability.
Infrastructure monitoring provides engineering teams with continuous visibility into resource utilization, system performance, and service dependencies, allowing teams to detect abnormal behavior sooner and minimize production risk. It focuses primarily on foundational infrastructure layers such as compute, memory, storage, networking, and orchestration systems that support application delivery.

In cloud-native environments where infrastructure scales dynamically, monitoring has evolved from periodic health checks to continuous telemetry analysis. Without infrastructure monitoring, organizations operate with limited operational awareness, making it significantly harder to maintain reliability at scale.
Types of Infrastructure Monitoring
The two primary approaches to infrastructure monitoring are agentless and agent-based, each designed for different levels of visibility and operational control.
Agentless Monitoring
Agentless infrastructure monitoring monitors system and network health without installing software on the target hosts. It typically relies on protocols such as SNMP, WMI, and HTTP to retrieve metrics remotely.
The monitoring platform establishes a connection to the system using one of these protocols and then collects data such as CPU, memory, disk, and network usage. Agentless monitoring introduces minimal system overhead and is often preferred in legacy or highly regulated environments where installing agents is restricted. However, agentless approaches may provide limited telemetry depth compared to agent-based instrumentation.
Get deeper telemetry with agent-based monitoring. → Explore Middleware Docs Try Now
Agent-Based monitoring
Agent-based monitoring collects telemetry through lightweight software installed directly on hosts. It is typically used in dynamic environments such as cloud-native platforms, containers, and Kubernetes clusters, where workload behavior changes rapidly.
Once the agents collect and report data to a central monitoring platform, the platform can be configured to collect specific data and alert on specific conditions. It is more flexible and customizable compared to agentless monitoring.
Agent-based monitoring also enables monitoring of systems behind firewalls or other security controls, or of systems not exposed to the network. Agents can also buffer telemetry during temporary network disruptions and forward it once connectivity is restored.
Agent-Based vs Agentless Infrastructure Monitoring
Many modern monitoring platforms combine both methods, using agentless monitoring for basic infrastructure (such as routers or VMs) and agents for deeper insights into production workloads or secure environments.
Most modern infrastructure strategies use a hybrid approach, agentless monitoring for broad infrastructure coverage and agent-based instrumentation for deep operational insight.
| Feature | Agentless Monitoring | Agent-Based Monitoring |
| Installation | No software agents required | Requires the installation of agents on each system |
| Performance Overhead | Minimal system resource usage | Moderate resource usage by agent processes |
| Visibility & Data Depth | Basic metrics (CPU, memory, disk, network) | Deep-level metrics, including application, logs, and process insights |
| Security Compatibility | May struggle with firewalls or secure networks | Works behind firewalls and in restricted environments |
| Offline Monitoring | Not possible; requires continuous connectivity | Agents buffer data and sync when the connection is restored |
| Scalability | Ideal for large-scale environments with limited system access | Best for environments needing detailed observability per host |
| Customization | Limited configuration or extensibility | Highly customizable with scripts, plugins, and custom integrations |
| Maintenance | Low maintenance (no need to update agents) | Requires version control and agent updates |
| Best Fit | Static infrastructure, network devices | Cloud-native, microservices |
Selecting the right approach depends largely on telemetry requirements, security constraints, and infrastructure complexity.
How Infrastructure Monitoring Works
Infrastructure monitoring captures telemetry across compute resources, networks, containers, and orchestration layers to provide continuous insight into system health and performance. By analyzing metrics, logs, and system signals in real time, teams can quickly detect abnormal behavior and prevent service disruptions.
Most monitoring strategies begin with instrumentation, typically through lightweight agents or agentless integrations, that collect host-level and service-level data without significantly impacting performance.
Once deployed, monitoring systems are continuously:
- Visualize historical trends alongside live system states
- Detect anomalies and performance degradation
- Trigger alerts when thresholds are breached
- Surface dependency issues across services
Real-Time Data Collection and Processing
Modern platforms stream telemetry into a centralized backend where it is enriched, correlated, and analyzed. This enables engineering teams to move beyond reactive troubleshooting toward proactive incident prevention.
As infrastructure becomes increasingly dynamic, particularly in Kubernetes and autoscaling cloud environments, real-time processing is essential for maintaining reliability.
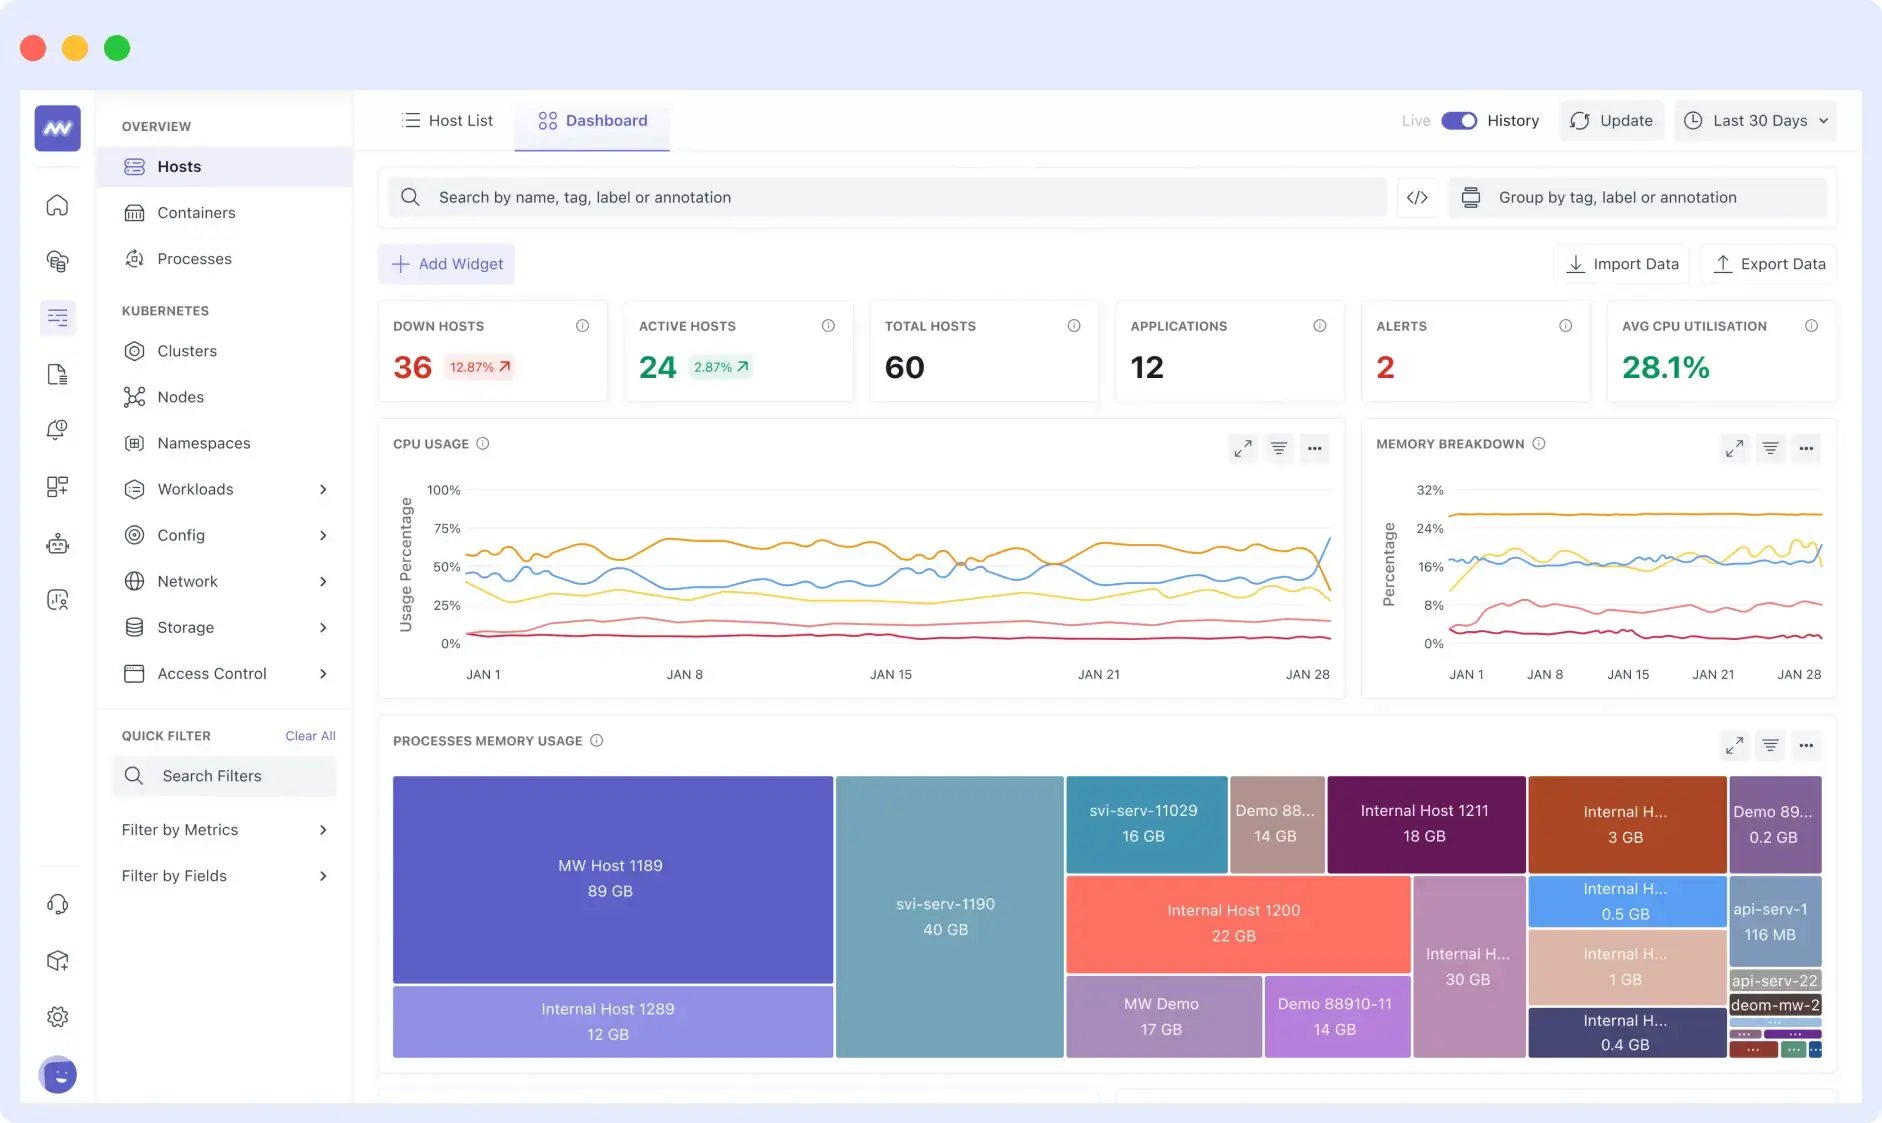
Unified Dashboard View
Collected telemetry is aggregated into a unified dashboard, giving DevOps and SRE teams end-to-end visibility from operating systems to container orchestration.
Whether workloads run on physical servers, virtual machines, or cloud-native clusters, centralized visibility helps teams understand how infrastructure components interact and where bottlenecks emerge.
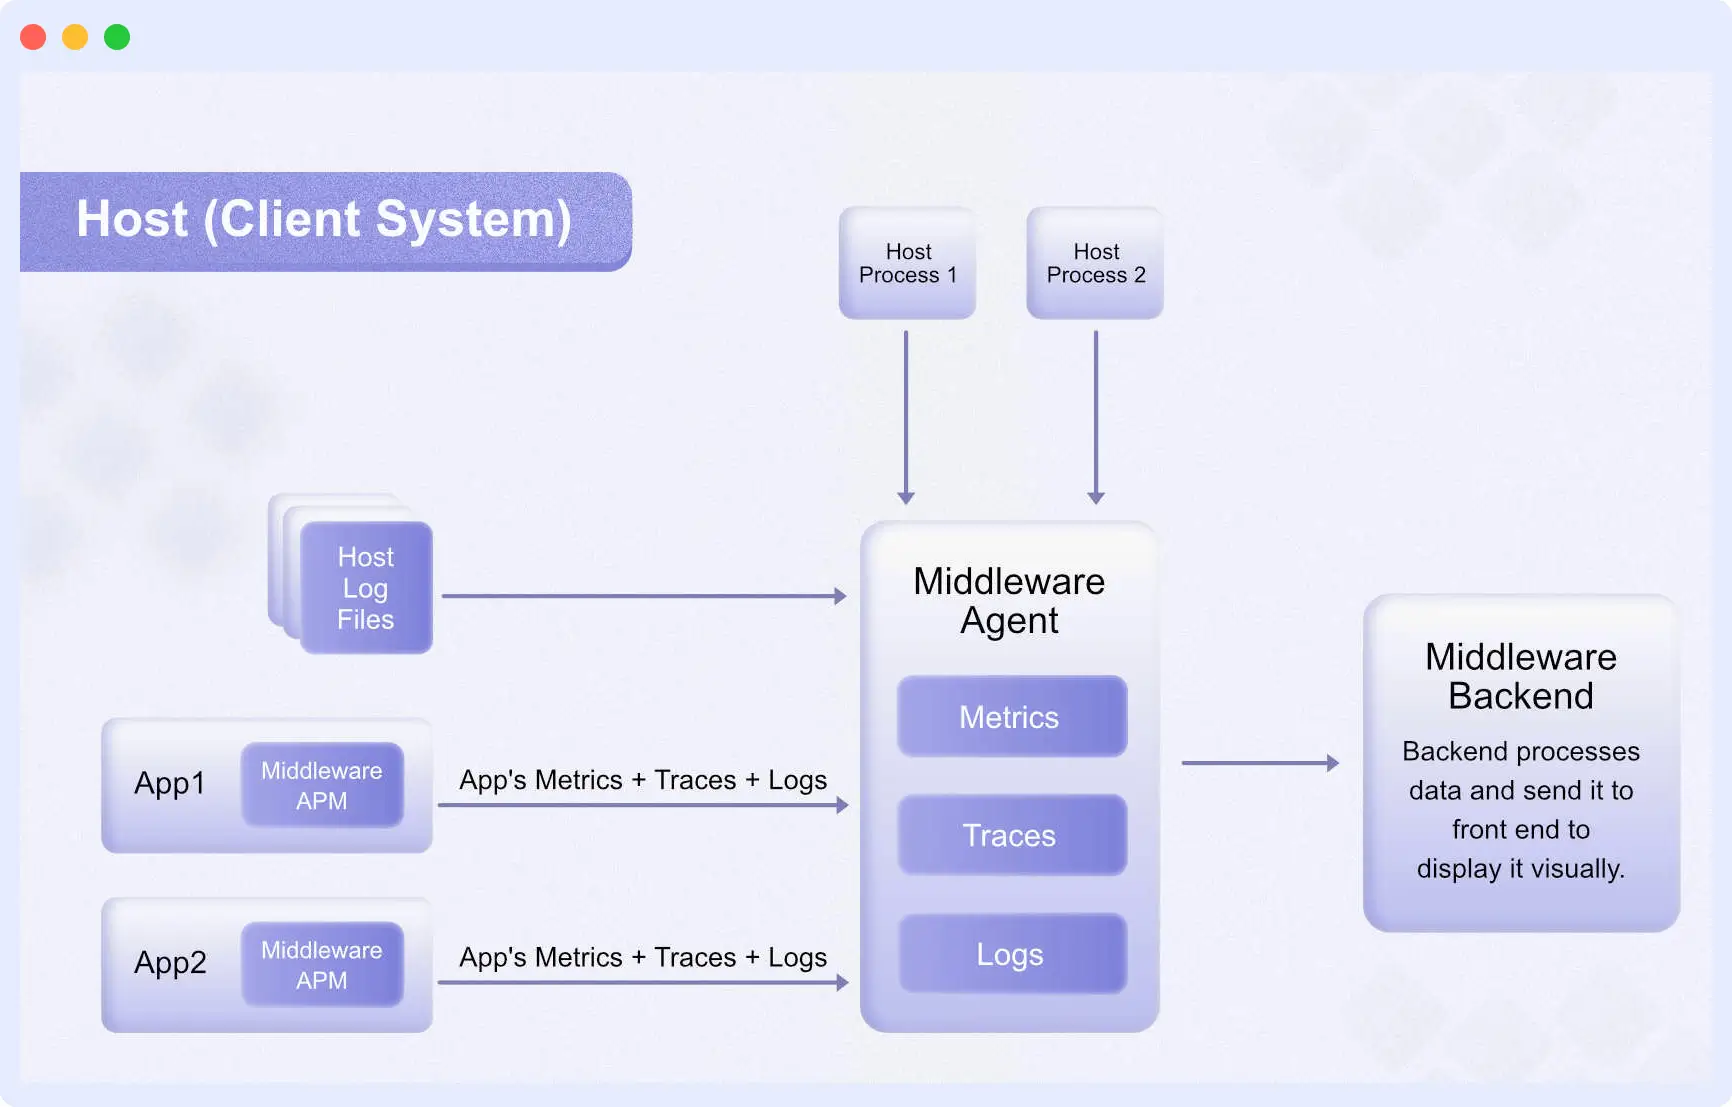
For example, platforms like Middleware automate the discovery of running services, active log sources, and host configurations, enabling teams to deploy monitoring faster and reduce manual setup.
Here’s a small architecture diagram showing you how Middleware collects and processes your data to provide you with robust Infrastructure monitoring:
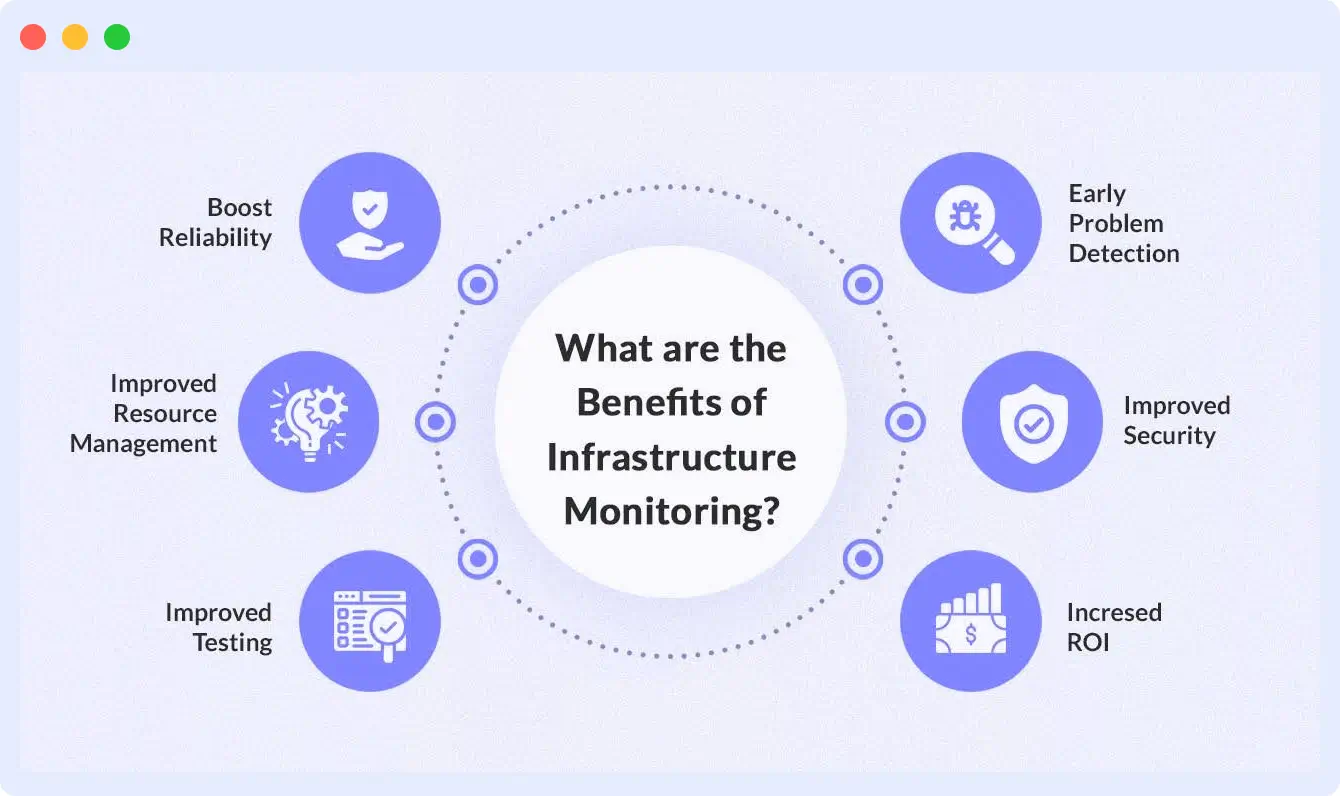
What are the Benefits of Infrastructure Monitoring?
As infrastructure becomes more distributed, spanning cloud platforms, containers, microservices, and edge environments, maintaining reliability without continuous visibility is nearly impossible. Infrastructure monitoring provides operational intelligence teams with the toolsto detect risks early, optimize performance, and scale systems confidently.
When implemented effectively, monitoring shifts organizations from reactive firefighting to proactive reliability engineering.
1. Early Issue Detection
Infrastructure monitoring helps IT teams identify subtle performance anomalies before they cascade into production incidents.
- How: Continuous analysis of metrics such as CPU saturation, memory pressure, disk throughput, and network latency surfaces abnormal patterns in real time.
- Example: A fintech company observed memory consumption increasing after each backend release. Monitoring flagged the regression early, enabling a rollback before customer transactions were affected.
- Impact: Reduces Mean Time to Detect (MTTD) and improves incident response.
2. Higher System Reliability
Consistent telemetry allows DevOps teams to rapidly isolate failure points and restore services faster.
- How: Infrastructure Monitoring Tools collect heartbeat data from servers, services, and databases to detect service degradation or failure.
- Example: An e-commerce platform used monitoring to detect a failing load balancer node that would have otherwise taken down 40% of traffic during a holiday sale.
- Impact: Guarantees SLAs (Service Level Agreements), improves business continuity, and reduces customer churn due to downtime.
3. Optimized Resource Utilization
Monitoring transforms infrastructure planning from guesswork into data-driven decision-making.
- How: Track CPU, memory, and disk usage over time to spot patterns of not using resources.
- Example: Identifying virtual machines consistently operating below 20% CPU utilization allowed one organization to consolidate workloads and significantly reduce cloud spend.
- Impact: Controls infrastructure costs, improves capacity planning and enables efficient scaling.
4. Safer Deployments and Testing
Infrastructure monitoring provides insight during deployments or configuration changes, ensuring new updates don’t negatively impact performance. It supports smoother rollouts and post-deployment validation.
- How: Real-time telemetry detects latency spikes, error-rate increases, and dependency failures following releases.
- Example: After deploying a new microservice, infrastructure monitoring may reveal a sudden increase in response times or failed connections.
- Impact: Enables rapid rollback or fixes, improving developer confidence and velocity.
5. Enhanced Security Visibility
By tracking access patterns, configurations, and anomalous system behavior, monitoring tools can surface potential security threats, such as privilege escalations or unauthorized access, early in the lifecycle.
- How: Tracks unexpected spikes in network traffic, unauthorized access attempts, escalation, and configuration changes.
- Example: Detecting unusual SSH login attempts from foreign IPs can indicate a potential breach.
- Impact: Acts as a first line of defense.
6. Increase ROI for IT Operations
Monitoring reduces the manual effort required for system oversight and troubleshooting. Further, DevOps and SRE teams devote less effort to monitoring your IT systems and more time to providing better value to your end-users.
- How: Automates data collection, alerting, and diagnostics, reducing reliance on manual checks or reactive firefighting.
- Example: Automate detection of high CPU spikes across hundreds of containers. Instead of manual log reviews, engineers received pre-filtered alerts with actionable diagnostics, cutting down investigation time by 60%.
- Impact: Lowers operational overhead, improves team productivity, and increases return on investment from infrastructure and human resources.
Infrastructure Monitoring Use Cases
Infrastructure monitoring plays a critical role in maintaining system health, improving operational efficiency, and supporting reliable software delivery. Operations teams, Site Reliability Engineers (SREs), and DevOps practitioners rely on monitoring to gain real-time visibility into infrastructure behavior and make faster, data-driven decisions.
1. Monitoring Kubernetes Clusters
Kubernetes environments are highly dynamic, with pods continuously starting, stopping, and rescheduling across nodes. Infrastructure monitoring provides real-time visibility into node health, pod performance, resource utilization, and cluster events.
Example: If a node begins experiencing memory pressure, monitoring can trigger alerts before pods are evicted, preventing service disruption.
“There was a point where I had to use a separate tool just to log into our Kubernetes (K8) cluster and check if any pods had crashed. Now, I simply rely on Middleware’s alerts, which are reliable and fast”
Elijah Smith, Software Engineer III at Generation Esports
Why it matters: Without cluster-level visibility, small resource issues can rapidly escalate into application downtime.
Result: Improved cluster stability and more predictable workload performance.
“Pro Tip: According to AWS, up to 60% of system failures could be proactively avoided with intelligent visibility and alerting.”
2. Observing Microservices Dependencies
Microservice architectures rely on dozens, sometimes hundreds, of interconnected services. A failure in one component can propagate quickly across the system.
Infrastructure monitoring helps teams map service dependencies and identify which upstream or downstream component is causing latency or errors.
Example: A slowdown in an authentication service may increase response times across multiple applications. Monitoring highlights the dependency chain, so engineers can isolate the root cause faster.
Why it matters: Dependency visibility reduces guesswork during incidents.
Result: Faster root-cause analysis and reduced Mean Time to Resolution (MTTR).
3. Maintaining Hybrid Cloud Visibility
Organizations often operate across on-prem infrastructure and multiple cloud providers. This distributed footprint makes centralized visibility essential.
Infrastructure monitoring aggregates telemetry from all environments into a unified view, helping teams detect network latency, configuration drift, or workload imbalance.
Example: Monitoring may reveal that traffic between an on-prem database and a cloud application is experiencing packet loss, enabling teams to reroute traffic before users are impacted.
Why it matters: Operational blind spots increase risk in distributed systems.
Result: Consistent performance and stronger cross-environment reliability.
4. Supporting Autoscaling Environments
Autoscaling dynamically adjusts infrastructure capacity based on demand, but improper thresholds or unexpected traffic spikes can still degrade performance.
Monitoring ensures that scaling policies trigger at the right time and verifies that newly provisioned resources function correctly.
Example: During a high-traffic product launch, monitoring detects rising CPU usage and confirms that additional instances are successfully absorbing the load.
Why it matters: Scaling without visibility can lead to overprovisioning or service instability.
Result: Balanced resource utilization and controlled cloud costs.
5. Strengthening CI/CD Environments
Continuous integration and deployment pipelines require stable infrastructure to prevent failed builds, delayed releases, or inconsistent environments.
Monitoring provides insight into build servers, test environments, and deployment infrastructure.
Example: If disk utilization spikes on a build server, monitoring alerts teams before pipelines begin failing.
Why it matters: Pipeline instability directly impacts developer velocity.
Result: Faster releases and more dependable delivery workflows.
While these use cases highlight the operational value of monitoring, selecting the right tooling ultimately determines how effectively teams can realize these outcomes.
Common Infrastructure Monitoring Challenges (and How to Solve Them)
As infrastructure becomes more distributed across cloud, containers, and hybrid environments, monitoring introduces new operational challenges that teams must proactively address.
Here are the key Infrastructure monitoring challenges and their solutions
1. Too Many Monitoring Tools
Large organizations often rely on 8–10 different tools to monitor networks, applications, databases, logs, traces, storage, and more. Each tool comes with its own dashboard, making it nearly impossible to gain a centralized, real-time view of infrastructure health.
Challenge: Fragmented observability
Solution:
- Consolidate telemetry into a unified observability platform that correlates metrics, logs, and traces. Reducing tool sprawl improves visibility and shortens investigation time during incidents.
- Use platforms that support multi-layered monitoring in one place.
- Disable redundant dashboards from individual tools.
2. Infrastructure Too Big to Monitor
As businesses scale, the number of components, such as servers, containers, cloud services, devices, and applications, also grows. Monitoring each part manually or through limited tools becomes inefficient and error-prone.
Challenge: Monitoring complexity at scale
Solution:
- Ensure your solution supports real-time, end-to-end visibility across hybrid and cloud-native environments.
- Prioritize platforms built for horizontal scalability, automated discovery, and intelligent correlation so infrastructure growth does not reduce visibility.
3. Rising Monitoring Costs
Pricing models based on hosts, ingestion volume, or feature tiers can cause monitoring costs to scale unpredictably as environments grow.
Some budget-friendly tools reduce upfront costs but offer limited storage or hidden cloud fees, resulting in unexpected expenses.
Challenge: High operational costs
Solution: Evaluate pricing structures carefully and prioritize platforms that align cost with actual usage while maintaining full telemetry visibility.
4. Alert Fatigue
Excessive alerting can overwhelm engineering teams, causing critical signals to be missed.
Solution: Implement alert tuning, dynamic thresholds, and noise-reduction strategies to ensure responders focus only on actionable incidents.
Best Practices for Infrastructure Monitoring
Following proven operational practices helps teams extract greater reliability and performance from their monitoring strategy.
- Opt for automation: Automate telemetry collection and incident workflows to reduce manual intervention and accelerate recovery times.
- Install the agent across your entire environment to ensure comprehensive coverage of production systems, preventing blind spots in critical dependencies.
- Prioritize alerts: Tune alert thresholds carefully to minimize noise while preserving high-signal incident detection.
- Create custom dashboards: Design role-specific dashboards that enable engineers, SREs, and leadership to quickly interpret system health.
- Test your tool: Continuously validate monitoring during deployments and infrastructure changes to confirm telemetry accuracy.
- Correlate Infrastructure with Application Signals: Infrastructure metrics gain significantly more diagnostic value when correlated with application performance data, enabling faster root-cause analysis.
Addressing these challenges requires more than visibility; it demands a monitoring strategy built for scale, automation, and rapid diagnosis.
Leading Infrastructure Monitoring Tools to Consider
The infrastructure monitoring landscape includes a mix of open-source and enterprise-grade platforms, each designed to support different operational needs. The tools below are widely adopted across engineering teams for their reliability, extensibility, and ability to deliver real-time infrastructure visibility.
1. Grafana / Prometheus
Grafana is widely used to visualize telemetry data and build real-time dashboards across the infrastructure and application layers. When paired with data sources like Prometheus, it becomes a powerful monitoring solution for cloud-native environments.
Teams value Grafana for its flexible dashboards, strong community ecosystem, and support for complex observability workflows.
2. Middleware
Middleware is a full-stack observability platform designed to unify metrics, logs, and traces within a single interface. It supports modern infrastructure environments and helps teams correlate telemetry to accelerate root-cause analysis.
The platform is often adopted by organizations seeking consolidated visibility without having to manage multiple monitoring tools. Built for modern, distributed environments, Middleware supports cloud-native architectures, Kubernetes, containers, serverless workloads, and hybrid infrastructure.
It also tracks the health & performance of your complete tech stack. By correlating telemetry in real time, the platform helps teams quickly identify anomalies, understand service dependencies, and accelerate root-cause analysis before issues impact users.
Beyond traditional infrastructure monitoring, Middleware delivers full-stack visibility through capabilities such as Application Performance Monitoring (APM), distributed tracing, database monitoring, real user monitoring (RUM), synthetic testing, and continuous profiling.
Middleware also simplifies observability workflows by generating AI-driven dashboards. Instead of manually configuring widgets and queries, teams can build dashboards using natural language prompts.
With over 200+ Integrations to improve your overall workflow, it reduces the gap between front-end and back-end data visible in a single integrated dashboard.
Ideal for teams looking for full visibility with minimal overhead.
See how Middleware correlates telemetry in real time — Explore Infra Monitoring.
2. Nagios Core
Nagios Core is a long-standing open-source monitoring platform known for its extensibility and plugin-driven architecture.
It is particularly suited for teams that require deep customization and prefer maintaining full control over their monitoring stack.
Nagios Core can also serve as part of an infrastructure monitoring solution that covers all servers in your company or organization, including operating systems (OS), applications, connectivity issues, andmore!
👉 A deeper evaluation of monitoring platforms can further clarify which solution aligns best with your operational requirements. check out our full guide on Infrastructure Monitoring Tools.
How do You Choose an Infrastructure Monitoring Tool?
Selecting an infrastructure monitoring platform requires careful evaluation beyond feature lists. Teams should prioritize capabilities that support long-term scalability, operational clarity, and rapid incident response.
- Unified Telemetry: Choose a platform that correlates metrics, logs, and traces to eliminate investigative silos.
- Role-Based Visualization: Dashboards should adapt to different stakeholders, enabling engineers and operators to quickly interpret system health.
- Cloud and Container Awareness: Ensure the platform integrates seamlessly with Kubernetes, serverless workloads, and major cloud providers.
- Intelligent Alerting: Look for dynamic thresholds, anomaly detection, and noise reduction to prevent alert fatigue.
- Predictable Pricing Model: Monitoring costs should scale transparently with infrastructure growth to prevent unexpected operational spend.
- Automated Discovery: Platforms that automatically detect new services and dependencies reduce manual configuration and prevent visibility gaps.
The right tool strengthens every layer of infrastructure operations, but its true value emerges when monitoring becomes part of a broader reliability strategy.
How to Implement Infrastructure Monitoring Effectively
Implementing infrastructure monitoring requires a structured approach that balances visibility, scalability, and operational readiness. Teams should focus on building a monitoring strategy that evolves alongside their architecture.
1. Define Critical Systems
Identify the services, hosts, and dependencies that directly impact availability and user experience so monitoring efforts prioritize what matters most.
2. Establish Meaningful Metrics
Track signals such as latency, saturation, traffic, and error rates to create an accurate picture of system health.
3. Standardize Telemetry Collection
Ensure metrics, logs, and traces are collected consistently across environments to eliminate diagnostic blind spots.
4. Configure Intelligent Alerts
Use dynamic thresholds and anomaly detection to surface actionable incidents while minimizing alert fatigue.
5. Continuously Refine Your Strategy
Infrastructure evolves rapidly monitoring should be reviewed regularly to maintain coverage as systems scale.
Organizations that treat monitoring as a continuous discipline rather than a one-time setup are significantly better positioned to maintain reliability at scale.
Conclusion
Infrastructure monitoring has evolved from basic uptime checks to a foundational reliability practice for modern systems. As environments grow more distributed and dynamic, continuous visibility into infrastructure health is no longer optional; it is operationally critical.
Organizations that invest in scalable monitoring strategies gain faster incident detection, stronger performance stability, and greater confidence in their ability to support business growth. The key is not just adopting monitoring tools, but embedding observability-driven thinking into everyday operations.
For teams evaluating modern infrastructure monitoring platforms, exploring solutions like Middleware can provide insight into how unified observability simplifies day-to-day operations.
Sign up on the platform to see how Middleware can help you with Infrastructure monitoring.
Ready to gain full visibility into your infrastructure? Start your free Middleware trial today.
What is infrastructure monitoring?
Infrastructure monitoring is the continuous process of collecting, analyzing, and interpreting telemetry data from systems and applications to ensure performance, availability, and reliability. It enables teams to detect anomalies early, troubleshoot faster, and maintain operational stability.
What is the role of infrastructure monitoring?
The role of infrastructure monitoring is to provide real-time visibility into the health, performance, and dependencies of technology environments, including servers, virtual machines, containers, databases, and networks, so teams can proactively prevent incidents and optimize system performance.
What kind of problems can be detected with infrastructure monitoring?
Infrastructure monitoring helps detect issues such as resource saturation, network bottlenecks, service outages, failed workloads, configuration drift, anomalous traffic patterns, and capacity constraints, allowing teams to mitigate risks before they impact users.
Why is infrastructure monitoring important?
Infrastructure monitoring is important because it improves incident detection (MTTD), reduces recovery time (MTTR), and strengthens overall system reliability. Continuous visibility helps organizations minimize downtime, protect user experience, and support scalable growth.
How do I choose the right infrastructure monitoring tool?
The right infrastructure monitoring tool depends on factors such as infrastructure scale, deployment model, telemetry depth, automation capabilities, and budget. Teams should prioritize platforms that provide unified visibility across environments, support intelligent alerting, and scale alongside infrastructure growth.
What is the difference between infrastructure monitoring and observability?
Infrastructure monitoring focuses on tracking predefined metrics and system health indicators, while observability enables teams to understand system behavior by analyzing metrics, logs, and traces collectively. Monitoring tells teams when something is wrong; observability helps explain why.