Windows performance monitoring is critical because Windows servers fail quietly. Memory leaks grow for days before performance tanks. Disk space runs out slowly until SQL Server crashes. These Windows server performance issues often go unnoticed until users report them. CPU spikes at 3 AM, and nobody notices until users call in the morning. You find out about problems only after users do.
While many Windows server monitoring tools exist, Middleware focuses on real-time metrics, alerting, and deep process-level visibility. This guide to Windows performance monitoring covers how to track critical metrics, set up alerts, and troubleshoot production issues effectively.
If you’re troubleshooting production issues, logs debugging play a critical role alongside metrics.
What You Need Before You Start
This guide assumes you manage Windows servers in production and have administrator access to install software. You’ll need:
System Requirements:
- Windows Server 2016 or higher
- 64-bit processor (x86_64)
- Administrator privileges
Note: The agent also runs on Windows 10/11 for testing and development, but this guide focuses on production server monitoring.
Middleware Account:
- Active Middleware account
- API key from your dashboard (Installation → Agent → Windows)
- Target URL (the endpoint where your agent sends data)
The API key and target URL are unique to your account. Copy both from the dashboard before you start. You’ll need them during installation. If you’re setting up multiple servers, you can reuse the same API key.
How to Monitor Windows Server Performance with Middleware
If you’re wondering how to monitor Windows Server 2016 performance, the process is straightforward with Middleware. The agent collects real-time metrics across CPU, memory, disk, and network, giving you full visibility into system health.
Setting up monitoring on your Windows system takes about 10 minutes. The agent installs as a service, gets metrics from your system, and sends them to Middleware. Your applications continue to run at normal speed.
How to Install the Middleware Agent on Windows
Middleware simplifies infrastructure monitoring for Windows Server environments across cloud and on-prem setups.
You can use the graphical installer or PowerShell. The GUI makes sense for single servers. PowerShell is faster when deploying to multiple machines or working on headless servers.
Method 1: GUI Installation
Download the installer from GitHub. Run it, and a setup wizard opens. You’ll paste in your API key and target URL when prompted.
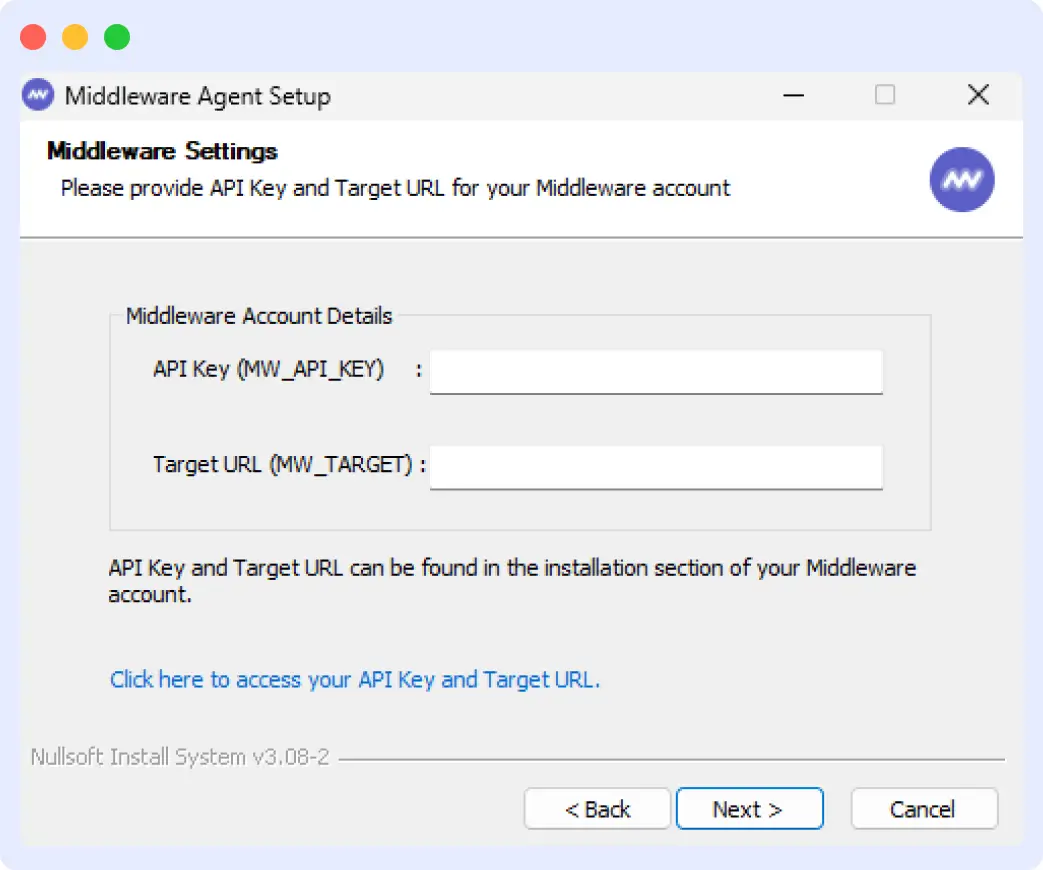
The wizard handles everything else, including creating the service, setting permissions, and starting the agent.
Method 2: PowerShell Installation
Open PowerShell as Administrator and run these commands:
Invoke-WebRequest `
-Uri "https://github.com/middleware-labs/mw-agent/releases/latest/download/mw-windows-agent-setup.exe" `
  -OutFile mw-windows-agent-setup.exe -UseBasicParsing
This downloads the installer to your current directory. Next, run the silent installation:
Start-Process `
  -FilePath ".\mw-windows-agent-setup.exe" `
  -ArgumentList "/S /MW_API_KEY='<MW_API_KEY>' /MW_TARGET='https://<MW_UID>.middleware.io:443'" `
  -Wait
Replace `<MW_API_KEY>` with your actual API key and `<MW_UID>` with your unique identifier from the target URL. The `/S` flag runs the installer silently without any UI prompts. The `-Wait` parameter ensures PowerShell waits for the installation to complete before returning control.
Both Methods install the agent as a Windows service that starts automatically.
How to Verify if the Installation was Successful
After installation completes, verify the agent is running and sending data to Middleware.
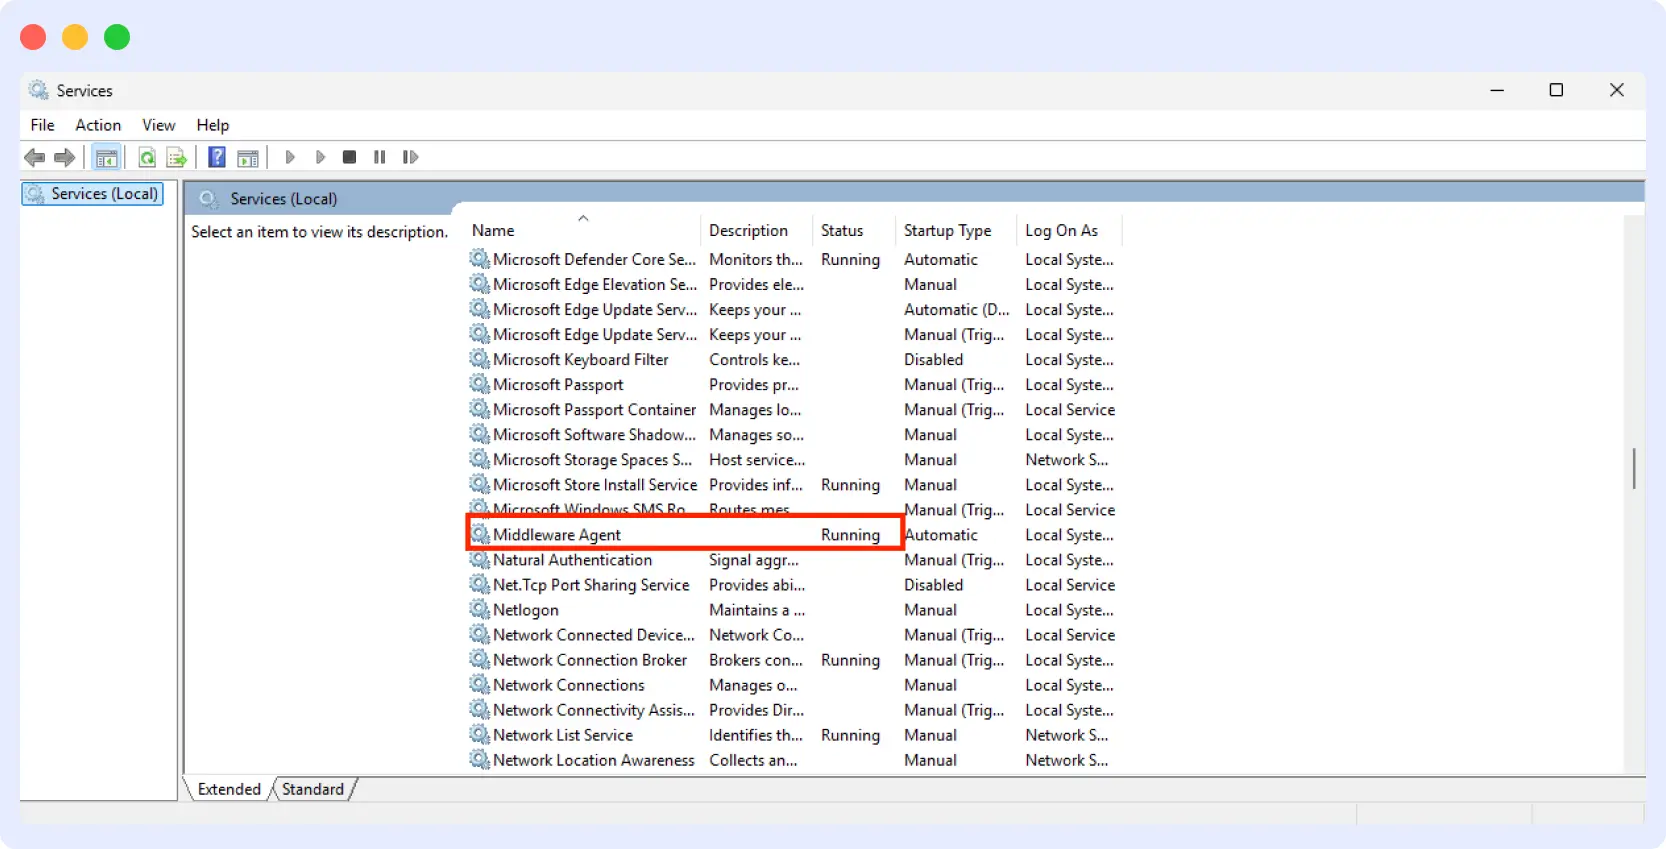
Check the Windows Service
Open the Services app. Look for “Middleware Agent” in the list. The status should show “Running”.
If you installed via PowerShell, you can check the service status directly from the terminal:
You should see output showing:
- Status: Running
- Name: mw-windows-agent
- DisplayName: Middleware Agent
Verify in the Middleware Dashboard
Log into your Middleware dashboard and navigate to Infrastructure → Hosts. Your Windows system will appear here once the agent successfully connects and sends metrics.
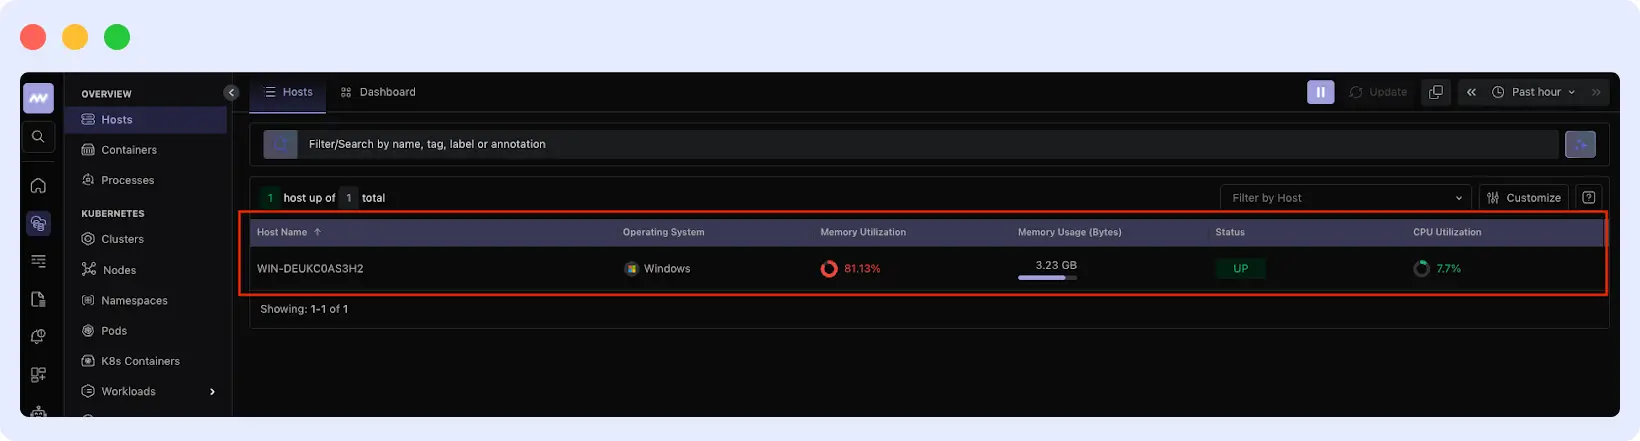
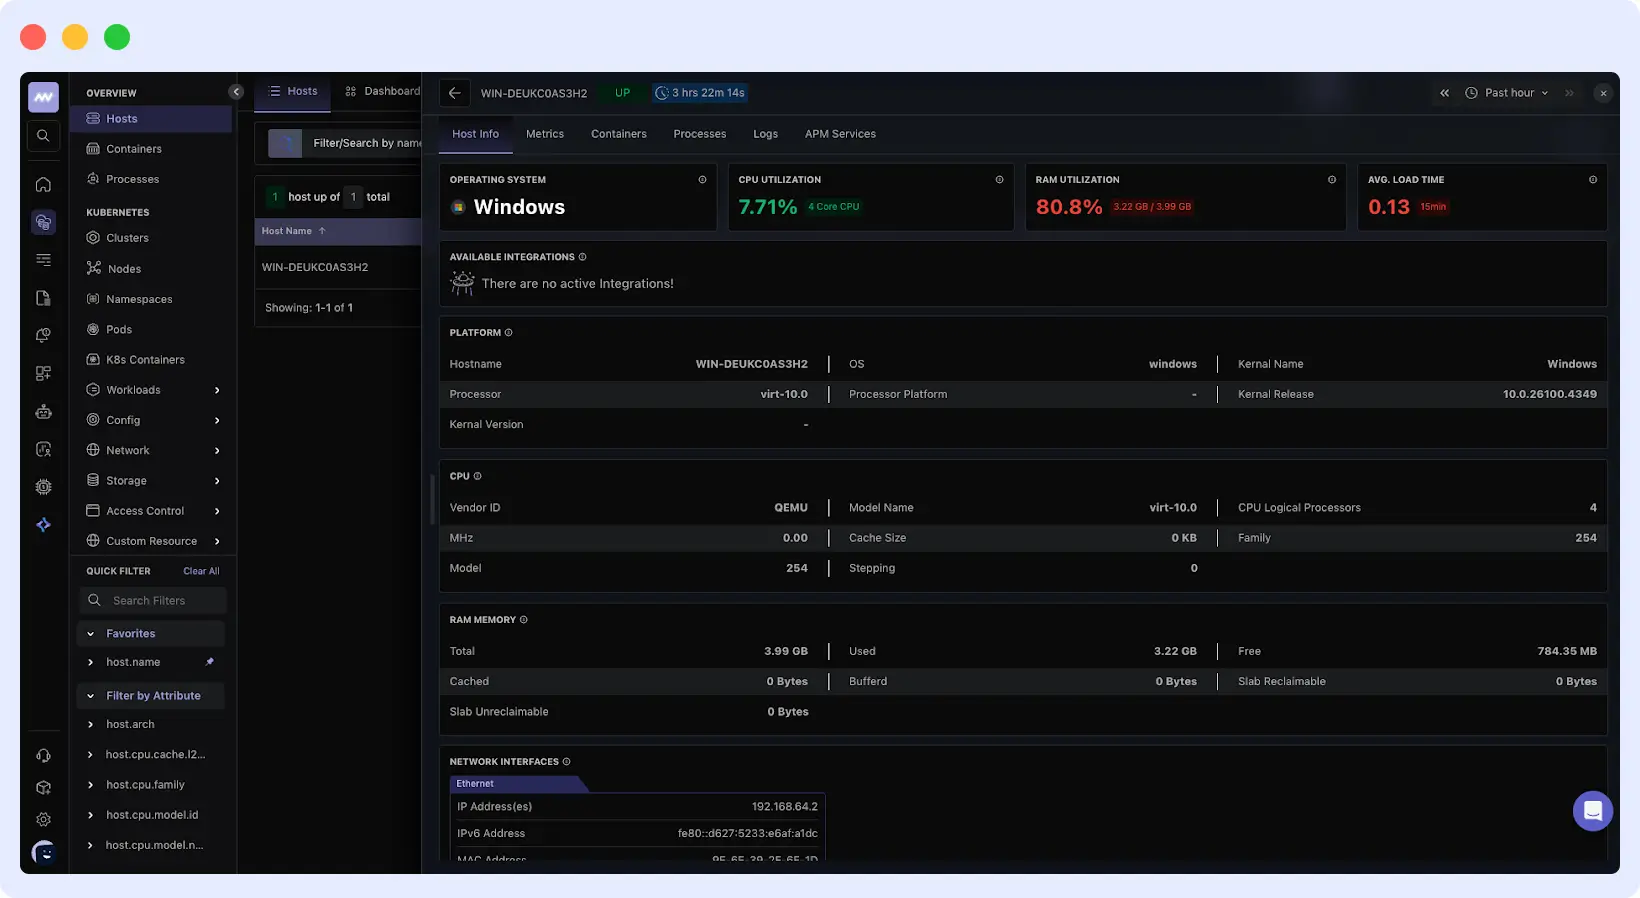
Click your system name to see host details, metrics, running processes, and logs.
If the service is running but your host doesn’t appear in the dashboard, double-check that you entered the correct API key and target URL during installation.
Once your agent is running, you can start visualizing these metrics in real-time inside Middleware’s dashboard.
What Metrics Matter in Windows Performance Monitoring?
Most monitoring setups fail not because of missing data, but because engineers don’t know what signals actually matter. Metrics are useless if you can’t interpret them during an incident.
What you really need is to know what to look for during an actual incident, like when you get paged at 2 AM because the app is slow, or you come in Monday morning and performance has been garbage since Saturday night.
What Does High CPU Usage Actually Tell You?
Raw CPU percentage doesn’t tell you much. A server running at 75% CPU can be perfectly healthy if it’s handling a real workload. What matters is whether that usage is causing performance issues and, if so, why.
Windows doesn’t have load average like Linux, so you need to look at Processor Queue Length instead. This shows how many threads are waiting for CPU time. If it consistently exceeds 2 per CPU core (for example, 8+ on a 4-core server), you’re dealing with CPU contention.
Next, check how CPU time is split between User mode and Privileged mode.
- High User Time (>70%) → applications are doing actual work (usually normal)
- High Privileged Time (>30%) → too much time in kernel mode
High privileged time often points to deeper issues like:
- Excessive context switching
- Disk I/O bottlenecks
- Applications making too many small system calls instead of batching operations
What looks like a CPU problem is often a disk problem in disguise.
If CPU usage is moderate (50–70%), but Privileged Time is high, and disk queue length exceeds 2, your system is I/O-bound. Applications are waiting on disk, not CPU.
Adding more CPU won’t fix it. You need faster storage.
Instead of manually correlating CPU, memory, and disk signals during incidents, Middleware brings all these metrics together with process-level visibility in one place.
👉 See how Middleware helps you identify root cause faster
When Should You Worry About Memory Usage?
Windows manages memory aggressively, so high usage alone isn’t a problem. The OS uses available RAM for caching to improve performance.
What actually matters is Available Memory (free memory + standby cache that can be reclaimed instantly). When this drops below 10% of total RAM and page file usage starts increasing, you’re entering a risk zone.
Steady growth in page file usage over time is a strong indicator of a memory leak. Sort processes by memory usage and look for anything that keeps growing without a corresponding increase in workload. For example, a service jumping from 2 GB to 4 GB within an hour without increased activity is likely leaking.
The worst case is page file thrashing. If Available Memory drops below 5%, disk I/O spikes, and page file usage keeps rising, Windows is constantly swapping memory to disk. Since disk is significantly slower than RAM, performance degrades rapidly.
At this point, you need to either increase RAM or optimize the application causing the leak.
What Network Metrics Tell You About Application Health
Network throughput (bytes sent/received) shows how much traffic your system is handling, but it doesn’t tell you if that traffic is healthy.
What really matters is packet loss and error rates. Even a small percentage of dropped packets can significantly degrade TCP performance, because lost data must be retransmitted.
If you see dropped packets on the receive side, your system isn’t keeping up with incoming traffic. This can happen when:
- The CPU can’t process packets fast enough
- The NIC is misconfigured
- Interrupt handling isn’t optimized
On the transmit side, errors usually point to infrastructure issues—like faulty cables, switch port problems, or NIC hardware failures. If error rates spike suddenly, check the network layer before blaming the application.
For applications with many concurrent connections (like web servers or databases), monitor connection states. A buildup in TIME_WAIT or CLOSE_WAIT often indicates connection handling issues, such as:
- Connection pool exhaustion
- Applications are not closing connections properly
Why Process-Level Data Matters for Root Cause Analysis
System-wide metrics show symptoms. Process-level data shows the cause.
When CPU spikes or memory runs low, the first question is: which process is responsible?
During an incident, sort processes by CPU usage. A process that has been consuming high CPU for days is likely part of a normal workload. But if a process started 10 minutes ago and is already using 40% CPU, that’s a red flag.
The same applies to memory. A process using 15% memory after just a couple of hours can quickly consume all available RAM, which is often a sign of a memory leak.
Also, check the user context each process runs under. Services running as SYSTEM or LOCAL SERVICE are usually expected. But unknown or unexpected executables with elevated privileges could indicate misconfiguration or even malicious activity.
How to Set Alerts for Windows Servers
Knowing how to set alerts for Windows servers ensures you catch issues before they impact users.
Why You Need Alerts for These Metrics
Who’s watching dashboards at 3 AM? Nobody. That’s the whole point of alerts. They catch problems the moment metrics cross into dangerous territory, so you’re fixing issues before users start complaining or systems go down.
Here’s what happens without proper alerting:
A .NET application starts leaking memory. At first, it’s slow—usage climbs from 40% to 50% on day one. No one notices.
By hour 36, it reaches 70%. Still no alerts.
At 48 hours, memory hits 85%. The server starts thrashing the page file. Performance drops sharply. Now users start reporting issues.
The on-call engineer gets paged—but only after things begin to fail. By then, they’re debugging under pressure, with users complaining and management asking for updates.
This entire situation could have been avoided with a simple memory alert set earlier.
If they had set an alert at 75% Available Memory, it would have triggered hours earlier, giving them enough time to restart the service during a maintenance window. No user impact. No firefighting.
Middleware lets you create real-time alerts and detect anomalies before they impact users.
👉Try Middleware for real-time Windows infrastructure monitoring
Alert Rules Based on Critical Metrics
Don’t set alerts based on round numbers like “80%” just because they sound reasonable. Set thresholds based on what actually signals a problem in your environment.
Use these as starting points, then tune them based on your system’s baseline:
Processor Queue Length
Alert when it exceeds 2 per CPU core for more than 5 minutes.
For example, a 4-core server with a queue length consistently above 8 indicates CPU contention and degraded performance.
Available Memory
Alert when Available Memory drops below 15% of total RAM.
Below 10%, the system is likely paging to disk. A 15% warning gives you time to act before performance is impacted.
Page File Usage
Alert if page file usage:
- grows by more than 30% within an hour, or
- exceeds 50% of its configured size
Sudden growth often indicates a memory leak. Sustained high usage usually means insufficient RAM.
Disk Queue Length
Alert when it stays above 2 per physical disk for more than 10 minutes.
This indicates your storage can’t keep up with I/O demand, and applications are waiting on disk operations.
Network Dropped Packets
Alert on any non-zero dropped packet rate that persists for more than 2 minutes. Even a small percentage of drops degrades TCP performance significantly.
Process-Specific
Set alerts for critical services (IIS, SQL Server, or your application) when they exceed expected CPU or memory usage.
For example, if your application normally uses 2 GB of memory and suddenly spikes to 6 GB, it should trigger an alert immediately.
How to Configure Alerts in Middleware
Navigate to the Alerts section in your Middleware dashboard and click “Add New Rule” in the top right corner. You’ll see different alert types.
For Windows infrastructure monitoring, you’ll need two:
Host alerts: Notify you when a server stops reporting to Middleware. This catches agent failures, network issues, or server crashes.
Metrics alert: trigger based on threshold conditions for CPU, memory, disk, or network metrics. This is what you’ll use most often for performance monitoring.
Setting Up a Host Alert
Use host alerts to detect when a server goes offline or stops sending data.
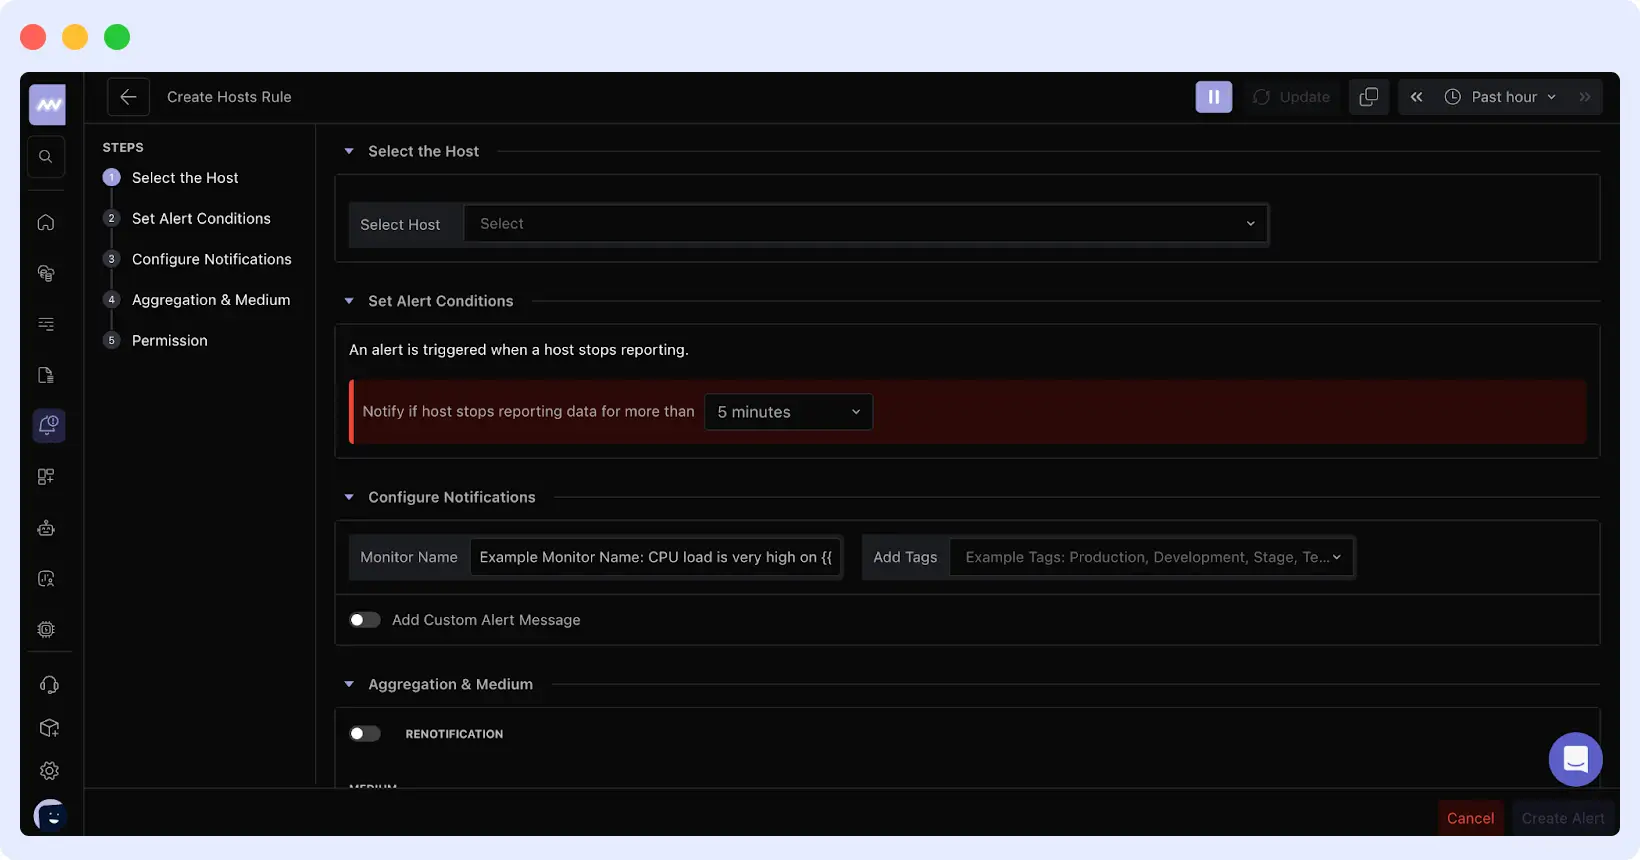
Click the “Host” card and configure the following:
Click the “Host” card and configure the following:
Select Host
Choose the server(s) to monitor. You can target a single host or apply alerts across multiple systems using tags.
Alert Condition
Define how long the host can stop reporting before triggering an alert.
The default is 5 minutes, which works for most setups. Increase this if you have planned maintenance or intermittent network issues.
Notifications
Give your alert a clear name like “Production Server Down” or “Database Host Offline”.
Add tags to organize alerts by environment (Production, Staging, etc.).
Notification Channels
Choose how you want to be notified: Email, Slack, Microsoft Teams, PagerDuty, Opsgenie, or Webhooks. Enable re-notifications to receive repeated alerts until the issue is resolved.
Permissions
Define who can view and manage this alert.
Setting Up a Metrics Alert
Metrics alerts are where most of your monitoring logic lives.
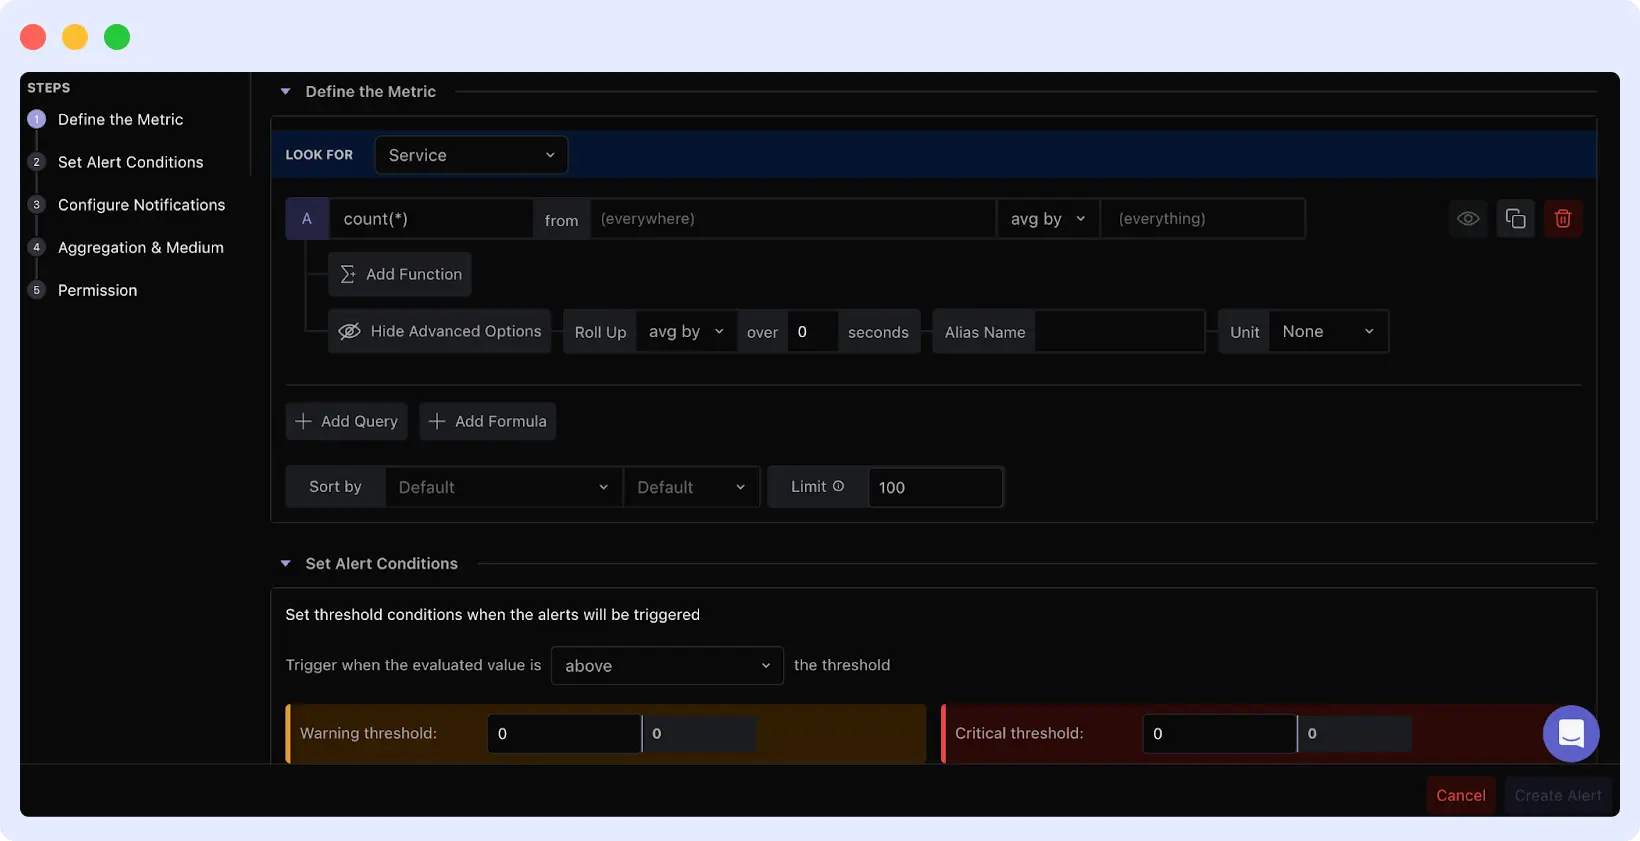
Click the “Metrics” card for threshold-base alerting. The configuration allow you to define exactly what metric to watch and what values trigger alerts.
Metric Selection
Choose what to monitor (CPU, memory, disk, or network). You can target specific hosts, services, or environments. Threshold Conditions
Set warning and critical thresholds.
For example:
- CPU > 75% → Warning
- CPU > 90% → Critical
Evaluation Window
Define how long the condition must persist before triggering an alert.
A 5-minute window helps filter out short-lived spikes. Aggregation Type
- Use max → to catch spikes
- Use avg → to detect sustained issues
Notifications & Channels
Same as host alerts, set alert name, tags, and notification channels.
Middleware evaluates alerts based on the time window you define.
For example, with a 5-minute window using max, the alert triggers if the threshold is crossed at any point within that period. This helps reduce noise from temporary spikes.
With the right alert setup, you can catch issues early and respond before they impact users.
👉 Explore alerting in Middleware
Best Practices for Windows Monitoring
Effective monitoring isn’t just about collecting metrics; it’s about reducing noise and responding to the right signals. These are proven Windows server alerting best practices that reduce noise and improve incident response.
Establish Baselines Before Setting Alerts
Don’t enable alerts on day one. Run monitoring for 1–2 weeks to understand what “normal” looks like.
For example, your SQL Server might hit 90% CPU during nightly batch jobs, which is expected, not an incident. Set thresholds based on actual usage patterns, not arbitrary numbers.
Correlate Metrics and Logs
Metrics tell you when something went wrong. Logs tell you why.
When an alert fires, check logs immediately. If CPU spikes at 3:47 AM, review Windows Event Logs from 3:45–3:50 AM. You’ll often find the root cause like a failed service, scheduled task, or query issue.
Tune After Every Incident
False positives train teams to ignore alerts. After incidents, ask: “Could monitoring have caught this earlier?” After false positives, ask: “Why did this fire incorrectly?” Tune based on experience, not guesswork.
Monitor Windows-Specific Components
Generic system metrics aren’t enough for Windows environments. Make sure you’re also tracking:
- Windows Services (IIS, SQL Server, custom apps)
- Event Logs for system and application errors
- Certificate expiration and system-level warnings
These signals often catch issues that CPU or memory metrics alone won’t reveal.
Ready to start? Sign up for Middleware and get your server reporting within 30 minutes.
Conclusion
Effective Windows monitoring isn’t just about collecting metrics—it’s about catching issues before they impact users.
With Middleware, you get real-time visibility into CPU, memory, disk, and network performance, along with alerts and process-level insights to quickly identify the root cause.
Start by installing the agent, setting up critical alerts, and tuning thresholds based on your system’s baseline. The goal is simple: detect and fix issues during maintenance windows, not during outages.
FAQs
What is Windows performance monitoring and why does it matter?
Windows performance monitoring tracks CPU, memory, disk, and network activity in real time to identify bottlenecks and prevent downtime. It helps teams detect issues before they turn into user-facing problems.
How do you monitor Windows Server 2016 performance effectively?
To monitor Windows Server 2016 performance, track key metrics like Processor Queue Length, Available Memory, and Disk Queue Length using a monitoring agent. Real-time visibility helps identify issues early and maintain system stability.
What are the most common Windows server performance issues?
Common Windows server performance issues include CPU contention, memory leaks, disk I/O bottlenecks, and network packet loss. These problems often develop gradually and require continuous monitoring to detect.
Which metrics are critical for infrastructure monitoring on Windows Server?
For effective infrastructure monitoring on Windows Server, focus on Processor Queue Length, Available Memory, Page File Usage, Disk Queue Length, and network errors. These metrics reveal system health and performance bottlenecks.
How do you detect memory leaks in Windows Server?
To detect memory leaks in Windows Server, monitor steady growth in memory usage and page file activity over time. Identify processes consuming increasing memory without workload changes.
What is the best way to troubleshoot CPU issues in Windows Server?
A Windows server CPU troubleshooting guide starts with checking Processor Queue Length and CPU usage split between User and Privileged time. High queue length indicates contention, while high privileged time suggests system-level bottlenecks.
How to set alerts for Windows servers without false positives?
To set alerts for Windows servers, define thresholds based on real usage patterns and use time windows (e.g., 5–10 minutes). This reduces noise and ensures alerts trigger only for sustained issues.
Are Windows server monitoring tools enough for performance troubleshooting?
Most Windows server monitoring tools provide metrics, but effective troubleshooting requires correlating metrics with process-level data and logs to find the root cause.