January’s release is one of our biggest so far. We focused heavily on auto-instrumentation, APM usability, search, AI-powered workflows, and Kubernetes visibility—along with major improvements across alerts, pipelines, dashboards, and endpoint monitoring.
Here’s everything that shipped 👇
Simplified Kubernetes Auto-Instrumentation
We’ve redesigned the entire K8s auto-instrumentation experience.
- One-script installation – no extra configuration required
- Updated UI/UX for clearer setup flow
- Infrastructure agents are now grouped by platform:
- Kubernetes
- Linux
- Docker
- Windows
- macOS
- ECS
- Heroku
This makes onboarding faster and much easier to understand.
Auto-Instrumentation for Linux Hosts
Middleware agents can now:
- Detect services running on Linux hosts automatically
- Enable APM auto-instrumentation for:
- Java
- Node.js
- Python
No manual configuration required.
Auto-Discovery of Databases
As part of auto-instrumentation:
- Agents now detect running databases automatically
- Databases appear in the UI for easy configuration and monitoring
Endpoint Monitoring (formerly API Catalogue)
We’ve completely revamped API Catalog into full Endpoint Monitoring.
- Connect API definitions via:
- GitHub
- File upload
Endpoint detail view includes:
- Parameters breakdown:
- Path
- Query
- Body
- Response metrics:
- Requests vs errors
- Latency
- Dependency map
- Span & trace summary
- Error breakdown per endpoint
This gives deep observability at the API level. Refer doc for more details.
Notebooks for Logs
You can now create notebooks that combine:
- Logs
- Metrics
- Traces
- Notes
Perfect for:
- Incident investigations
- Performance analysis
- Postmortems
- Sharing context with teammates
Get started by creating notebooks, refer to this documentation for details.
Alerts – Less Noise, More Signal
Alert Templates
Prebuilt templates for:
-
- Kubernetes
- Infrastructure
- APM
- Logs
Select a template → auto-configured alert.
Improvements
- Updated default thresholds to reduce noise
- Improved alert drill-down view to show:
- Triggering data
- Alert configuration context
Unified Pipeline
We merged the Ingestion Control Agent Pipeline into one unified Pipeline.
New capabilities
- Select hosts / clusters as data sources
- Apply ingestion control directly via pipelines
- Centralized management of data flow
Simplified Vercel Integration
Vercel integration is now one-click installable:
- No code changes required
- Automatically configures:
- Log drains
- Trace drains
- Correlates logs and traces out of the box
Extended log source support , Now includes:
- Redirect
- Static
- Lambda
- Edge
- Build
- External
- Firewall
📖 Full documentation here.
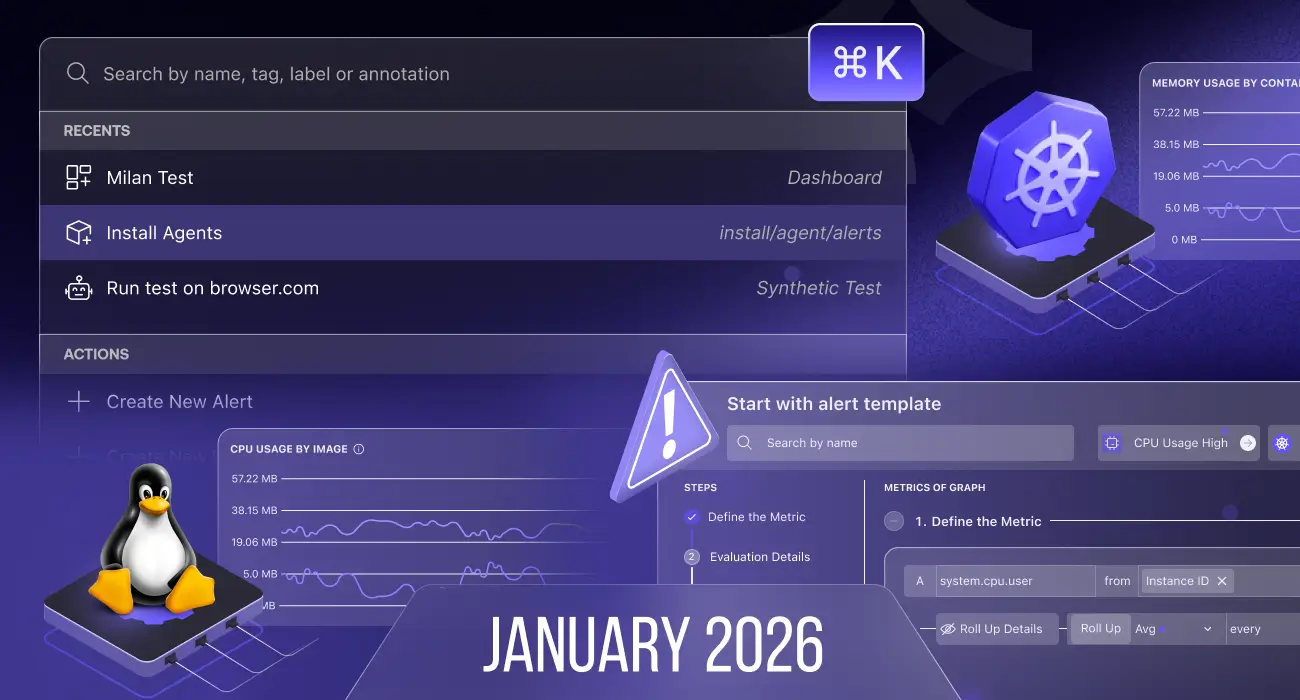
Search Across the Entire Platform
We introduced global command search:
- Press Ctrl / Cmd + K anywhere
- Search for:
- Screens (Traces, API Catalog, Dashboards, etc.)
- Actions (create alert, create dashboard, etc.)
Think of it as command palette for observability.
APM – Smarter Setup & Better UX
Dynamic Setup Guide
APM now adapts setup suggestions based on your actual services:
- See whether alerts, logs, synthetics, or infra monitoring exist for a service
- Configure missing pieces directly from the service view
- Guided setup based on detected service metadata
UI Enhancements
- Interactive icons added to:
- All APM labels
- Side panels
- Attribute-based icons added in log detail views
Infrastructure Monitoring
Kubernetes Policies
- Updated Custom Resource screen
- Enhanced drill-down views with deeper network-related context
Dashboards – Massive Kubernetes Expansion
We added 15 new default Kubernetes dashboards, including:
- Ingresses
- Services
- Persistent Volumes
- PVCs
- HPAs
- StatefulSets
- DaemonSets
- CronJobs
- Jobs
- ReplicaSets
- Deployments
- Containers
- Namespaces
- Clusters
All dashboards were also updated with:
- New metrics
- Improved layouts
- Better visualizations
RUM Updates
- Added SDK support for cookieDomain
- Added new attributes:
- Referrer domain
- Page view
- Page live (on location change)
- Fixed application listing issues
Synthetic Monitoring
- Performance improvements for tag-filtered count queries
Bug fixes for incorrect counts