May is all about automation, AI-powered workflows, and deeper database observability. This month, we expanded OpsAI capabilities with automated investigations and AI-driven alert creation, while significantly enhancing PostgreSQL monitoring with new metrics, insights, and dedicated database analysis screens.
Here’s everything new this month 👇
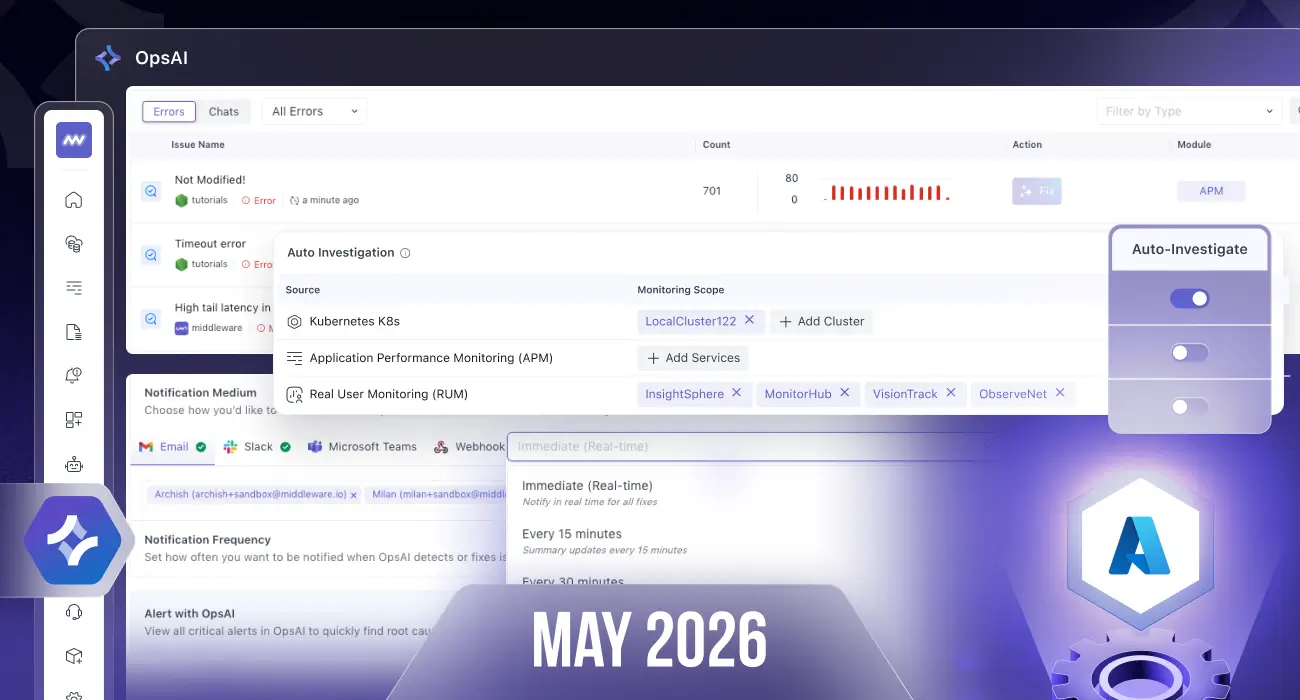
🤖 OpsAI – Automated Investigations & Smarter Alerting
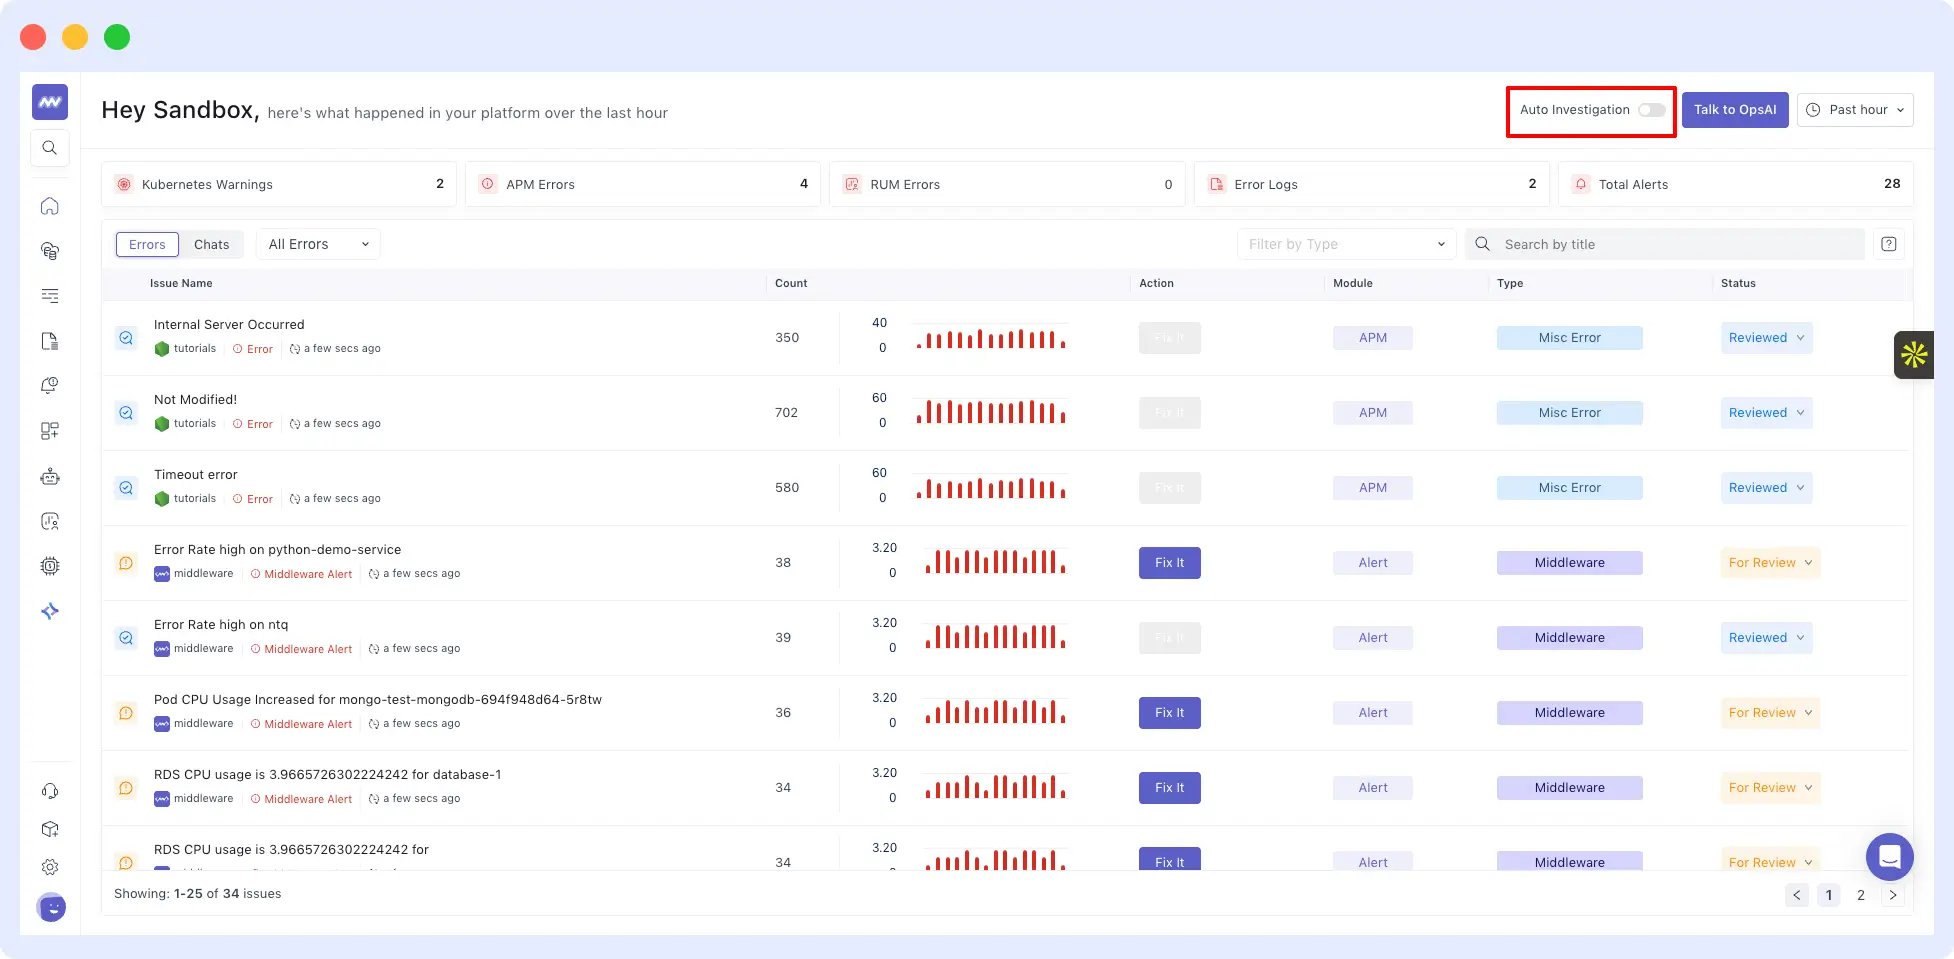
Auto Investigation
OpsAI can now automatically investigate issues without requiring manual intervention.
Users can enable Auto Investigation from:
- Home screen
- Settings → OpsAI Settings
Currently supported for:
- Kubernetes issues
- APM errors
- RUM errors
Once enabled, OpsAI will automatically perform RCA and provide investigation results whenever an issue occurs.
Notification Controls
Users can configure:
- Notification channels
- Notification frequency
to receive updates whenever OpsAI automatically investigates an issue.
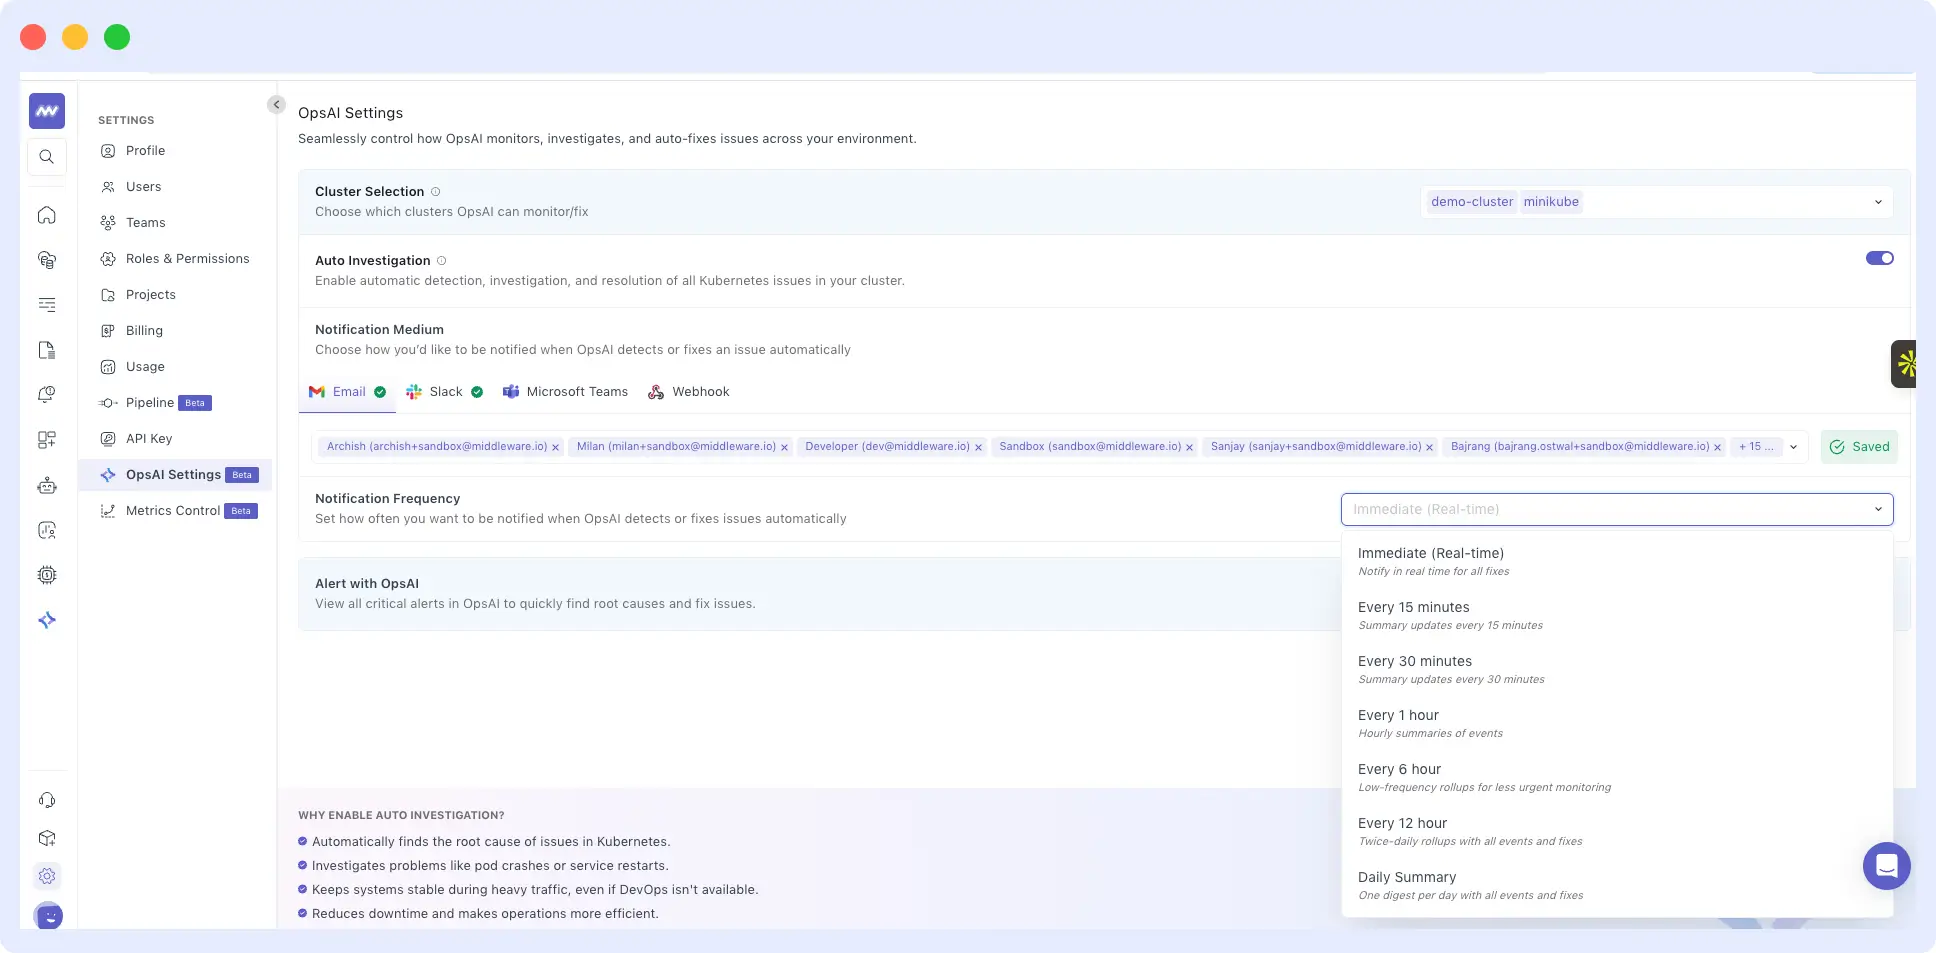
Granular Scope Selection
You can now choose exactly where Auto Investigation should run:
- Kubernetes clusters
- APM services
- RUM applications
This provides more control over which environments are monitored by OpsAI automation.
🚨 Create Alerts with OpsAI
Alert creation is now powered by AI.
Simply describe what you want to monitor, and OpsAI will generate the alert configuration automatically.
Examples:
- “Create an alert when API latency exceeds 500ms”
- “Alert me when PostgreSQL connections are unusually high”
Smart Alert Recommendations
OpsAI can also determine the right metrics and thresholds automatically.
Instead of specifying exact values, you can describe the use case and OpsAI will:
- Analyze your metrics
- Review logs and traces
- Identify appropriate thresholds
- Configure alerts automatically
This makes alert setup significantly faster, especially for new services and environments.
☁️ Azure Integration
Azure Container Apps Support
We added support for Azure Container Apps monitoring.
The integration now collects:
- 31 performance metrics
- Resource utilization metrics
- Service-level operational metrics
This expands visibility into containerized workloads running on Azure.
🐘 Database Monitoring – Major Upgrade
We’ve significantly expanded PostgreSQL observability across all deployment models.
Supported Environments
PostgreSQL monitoring now supports:
- Self-hosted Linux environments
- Kubernetes deployments
- AWS
- Azure
- Google Cloud Platform
New Performance Metrics
Added deeper visibility into database activity with metrics including:
- Throughput
- Execution duration
- Commits
- Rollbacks
- Connections
- Transaction time
- Rows modified by operation type
Lock Monitoring
Track locks with detailed breakdowns by:
- Relation
- Lock type
- Lock mode
This helps identify contention and query bottlenecks faster.
Replication Insights
Added replication monitoring including:
- Write-Ahead Log (WAL) size
- Replication-related metrics
Index Performance Monitoring
Gain visibility into index effectiveness through metrics such as:
- Index block hits
- Index block reads
- Index scans
- Row reads per table
Additional PostgreSQL Insights
Added monitoring for:
- Blocks
- Vacuum operations
- Database functions
for deeper database performance analysis.
📊 New PostgreSQL Monitoring Screens
To complement the new metrics, we’ve introduced dedicated PostgreSQL analysis views.
Query Metrics
View queries in both:
- Full query format
- Normalized query format
Along with key metrics such as:
- Execution count
- Average duration
- Wait events
Query Detail Panel
Drill into individual queries and view:
- Related APM services
- Traces
- Performance metrics
- Blocking activity
Blocking Queries
Identify and troubleshoot database contention.
View:
- Blocked queries
- Full query statements
- Affected tables
- Maximum block time
- Total block duration
- Occurrence count
You can also inspect blocking query samples and execution duration.
Query Samples
Analyze real query executions with:
- Full SQL statements
- Execution details
- Duration graphs
- Associated attributes
- Related traces
Schema Explorer
Explore database structure directly from Middleware.
View:
- All schemas
- Host information
- Columns
- Indexes
- Foreign keys
Along with:
- Schema-level metrics
- Variants
- Related queries
⚡ Improvements
Azure Integration
- Added Azure Container App metrics collection support.
Linux Auto Instrumentation
- Added support for RPM-based Linux distributions.
This enables easier auto-instrumentation across a wider range of enterprise Linux environments.