An EdTech platform with 200k users learned a hard lesson in reactive monitoring. After a Friday deployment, their status page was green, but their checkout was dead for iOS 14 users. It took two hours to diagnose while revenue leaked.
By pivoting from manual regression to a Synthetic-First Observability Strategy with Middleware, they cut detection time from 45 minutes to 5 and reclaimed 30+ engineering hours per week.
This case study breaks down how their DevOps team transitioned to a Synthetic-First Observability Strategy using Middleware, scaling to 200+ global tests and cutting customer-reported bugs by 83%.
👉 Related Read: The Complete Guide to What is Synthetic Monitoring
The Incident That Changed Everything
There is a specific panic in seeing support tickets stack up on a Saturday morning. Following a routine Friday checkout update, this EdTech platform, which hosts competitive gaming tournaments, appeared healthy. Staging was clean, and QA had signed off.
However, the reality was a silent failure: the “Submit” button was dead for users on iOS 14 and older.
The team spent two hours merely identifying the scope of the regression while hundreds of users abandoned the registration window. The incident proved that “Works on my MacBook” is not a guarantee of production.
After that incident, the CTO stopped being diplomatic:
“We’re learning about problems from users posting angry tweets. This is backwards.”
This realization triggered a complete rebuild of their observability strategy.
The Limitations of Unit Testing and Manual QA
Traditional testing suites often fail because they cannot replicate the entropy of the real-world user experience. Despite having standard unit and integration tests, the team identified three critical visibility gaps:
I. Geographic Blind Spots
Localized infrastructure failures, such as a CDN misconfiguration in Frankfurt, remain invisible to US-based staging environments. Without regional testing, “All Systems Operational” only applies to the home office.
II. Browser and OS-Level Regressions
Modern QA often suffers from the “Works in Chrome” fallacy. Without automated cross-browser validation in production, legacy environments (e.g., Safari 14 on macOS Big Sur) can remain completely broken, leading to silent customer attrition.
III. The Post-Deployment “Observability Gap”
Standard CI/CD testing is transactional; it validates code at the moment of deployment. However, the production environment is dynamic. Failures often manifest hours or days after a push due to:
- Downstream API Volatility: A third-party service changes its response schema without notice.
- Infrastructure Drift: A CDN configuration update or a load balancer tweak introduces latency.
- State Decay: Issues that only appear under specific, sustained production load.
As a product scales, the delta between “Staging Success” and “Production Reality” grows. Continuous synthetic validation is the only way to bridge this gap at scale.
What Is Automated Browser Testing with Synthetic Monitoring?
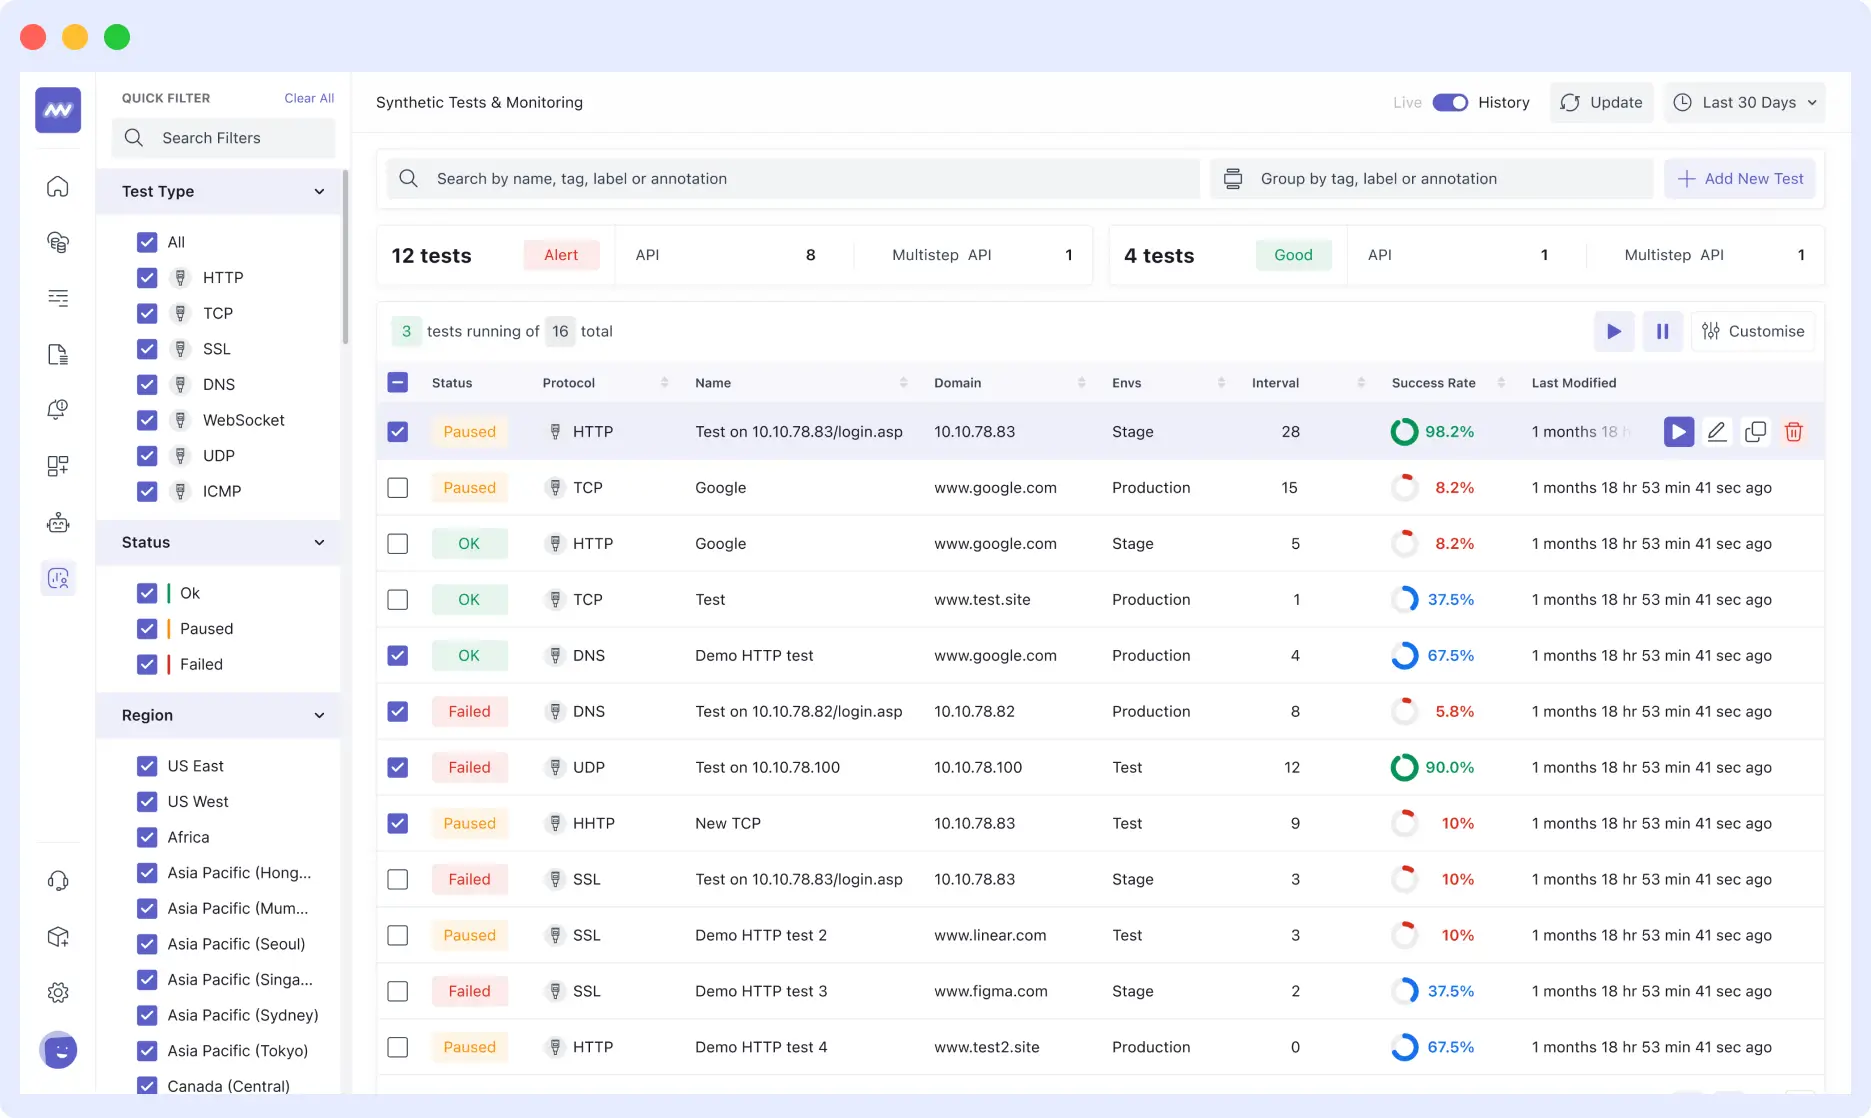
Automated browser testing with synthetic monitoring means running scripted, real-browser tests against your live production environment on a continuous schedule from multiple geographic locations without any human involvement.
Unlike unit tests that check isolated code functions or manual QA that validates specific flows before a deploy, synthetic monitoring validates your actual product as real users experience it, continuously, from everywhere your users live.
How it works:
- The Script: A runner opens a real browser (Chrome, Edge, or mobile emulation).
- The Journey: It walks through a defined user path: signup, checkout, login, or enrollment.
- The Validation: It checks that every step completes and the expected UI state appears.
- The Alert: If any step fails, an alert fires immediately with screenshots, network timing data (HAR files), and a step-by-step failure log.
- The Frequency: This runs every 5 to 30 minutes, depending on the criticality of the flow.
- The Distribution: It runs simultaneously from the US, Europe, Southeast Asia, and beyond.
The outcome: You stop hearing about broken flows from customers. You hear about them from an automated alert that fires before most users have even encountered the bug.
👉 Learn more: Mobile App Synthetic Testing Guide
Key Takeaways
- Manual regression doesn’t scale: It drains engineering resources and still misses edge cases.
- Bridge the gap: Synthetic monitoring connects staging success to real-world performance.
- Start with critical user flows, then expand coverage
- Flaky tests reduce trust reliability matters more than quantity
- Results: faster detection (45 → 5 min), 75% faster resolution, 83% fewer user-reported bugs
Selecting a Synthetic Monitoring Framework: The Decision Logic
Before evaluating vendors, the engineering leadership defined the specific technical requirements needed to close their visibility gaps. This architectural clarity is vital; procuring a tool without a well-defined problem set often leads to “shelfware” or fragmented data silos.
The team established five non-negotiable criteria for their production validation layer:
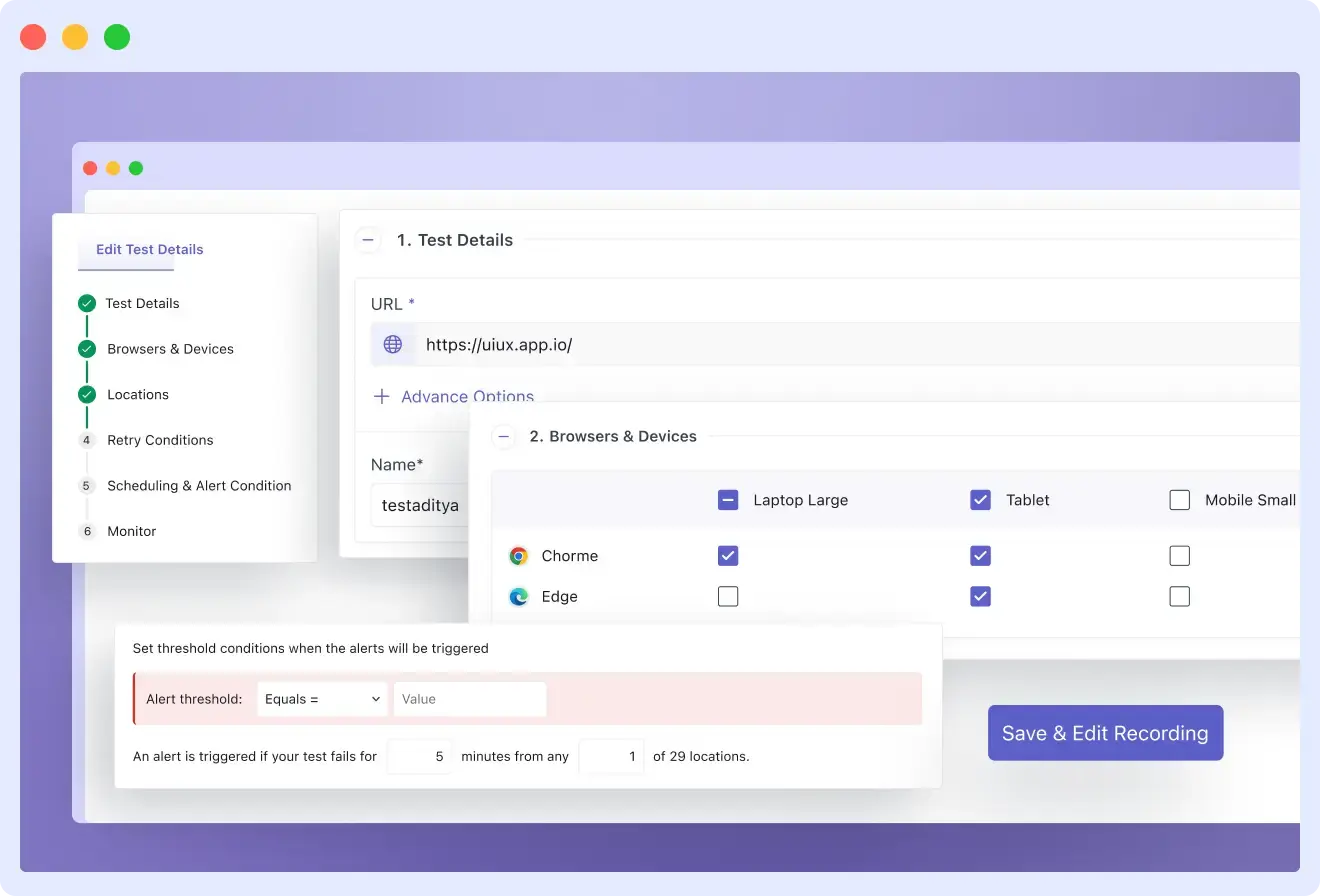
- Continuous Execution: Tests must run on a fixed cadence (e.g., every 5–15 minutes), decoupling validation from the deployment pipeline.
- Global Point-of-Presence (PoP) Testing: The ability to execute scripts from diverse geographic nodes to identify localized CDN or gateway latency.
- Deep Diagnostic Context: Beyond a binary “Up/Down” status, failures must surface actionable telemetry, including screenshots, DOM snapshots, and network HAR files.
- Observability Integration: To avoid “monitoring islands,” the solution must correlate synthetic failures with existing APM (backend) and RUM (frontend) data.
- Autonomous Alerting: The system must operate without manual oversight, triggering high-signal notifications only when critical user journeys fail.
Why Middleware?
After a technical evaluation, the team selected Middleware Synthetic Monitoring to anchor their strategy.
The platform provided several high-leverage features that accelerated adoption:
- Low-Code Scripting via Chrome Recorder: An extension that records manual user interactions and compiles them into executable test scripts, significantly lowering the barrier to entry for QA and Product teams.
- Advanced Logic Support: Native JavaScript support enables the team to handle complex scenarios such as conditional redirects, third-party authentication, and MFA flows.
- Unified Data Correlation: Because the team already uses Middleware for APM and RUM, synthetic failures are automatically linked to backend traces, enabling near-instant root-cause analysis.
The implementation followed a High-Impact, Low-Volume strategy: rather than attempting to automate the entire application at once, the team identified the “Critical Five” the core business flows that, if broken, would result in immediate revenue loss. By building confidence in these essential paths first, they established a scalable foundation for full-suite automation.
The “Critical Five”: Prioritizing High-Stakes User Journeys
In any complex application, not all features are created equal. The team identified five specific “Critical Flows” journeys where failure doesn’t just result in a minor UI glitch, but in an immediate, catastrophic impact on revenue and user trust.
By focusing on these core pillars, the team avoided the common pitfall of “test bloat,” where hundreds of brittle tests create noise without providing actionable value. For this EdTech platform, the “Critical Five” were:
- User Registration & Authentication: The primary gatekeeper. If users cannot create accounts or log in, the rest of the stack is effectively inaccessible.
- Tournament Enrollment: The core product action. For this user base, the inability to register for an event is a total service failure.
- Payment Processing: The direct revenue engine. Any friction here results in immediate, unrecoverable financial loss.
- Live Streaming Delivery: The primary value proposition. Since users pay for the tournament experience, streaming interruptions are considered high-priority outages.
- Results Submission: The foundation of competitive integrity. Failure to record outcomes undermines the platform’s credibility and triggers a flood of high-urgency support tickets.
👉Want to go deeper into how synthetic monitoring integrates with tracing for faster root cause analysis?
Architectural Non-Negotiables
To ensure these flows remained bulletproof, the test architecture was designed around three technical requirements:
- Global Persistence: Tests execute on a continuous, fixed schedule from multiple geographic nodes to catch localized infrastructure failures.
- Instant Diagnostic Context: Alerts must be enriched with enough telemetry (logs, traces, and screenshots) to eliminate the need for manual reproduction.
- Observability Cohesion: All synthetic results must stream directly into the existing observability stack, ensuring a “single source of truth” for the DevOps team.
This disciplined focus ensured that the team built a high-signal, low-noise monitoring environment, preventing the resource drain of managing a massive, unreliable test suite.
Stop diagnosing bugs through support tickets. Get a Demo of Middleware Synthetic Monitoring
Building Tests That Actually Work
Most synthetic test suites fail due to a common dichotomy: they are either too superficial to catch regressions or so brittle that maintenance becomes a full-time burden. This team bypassed both pitfalls by focusing on modularity and event-driven logic rather than static scripts.
I. Starting With the Chrome Recorder
To bridge the gap between QA and Engineering, the team utilized the Middleware Chrome Recorder. This allowed them to capture complex user journeys, such as the registration flow, simply by interacting with the UI. The recorder automatically translated clicks, form inputs, and navigation events into executable code.
For a standard signup test, the recorder handled:
- Navigate to the registration portal.
- Inputting credentials and validating “Terms of Service” checkboxes.
- Form submission and verifying the “Success” state.
- Triggering the welcome email verification.
By generating a zero-code baseline, the team empowered non-engineers to contribute to the test suite while ensuring 100% accuracy in mimicking real-world interaction.
Ready to build your first test? See how to set up the Middleware Synthetic Chrome Recorder in minutes. View Documentation →
II. Handling Multi-Role Conditional Logic
The platform’s registration flow was dynamic, presenting different fields for students, educators, and coaches. To avoid the maintenance overhead of managing three separate scripts, the team implemented conditional logic within a single test file:
// Validate that role-specific fields appear correctly
const selectedRole = document.querySelector('input[name="role"]:checked').value;
if (selectedRole === 'educator') {
  return document.querySelector('#school-name').style.display !== 'none';
}
return true;
This approach ensured a single source of truth that remained readable and easy to update as the UI evolved.
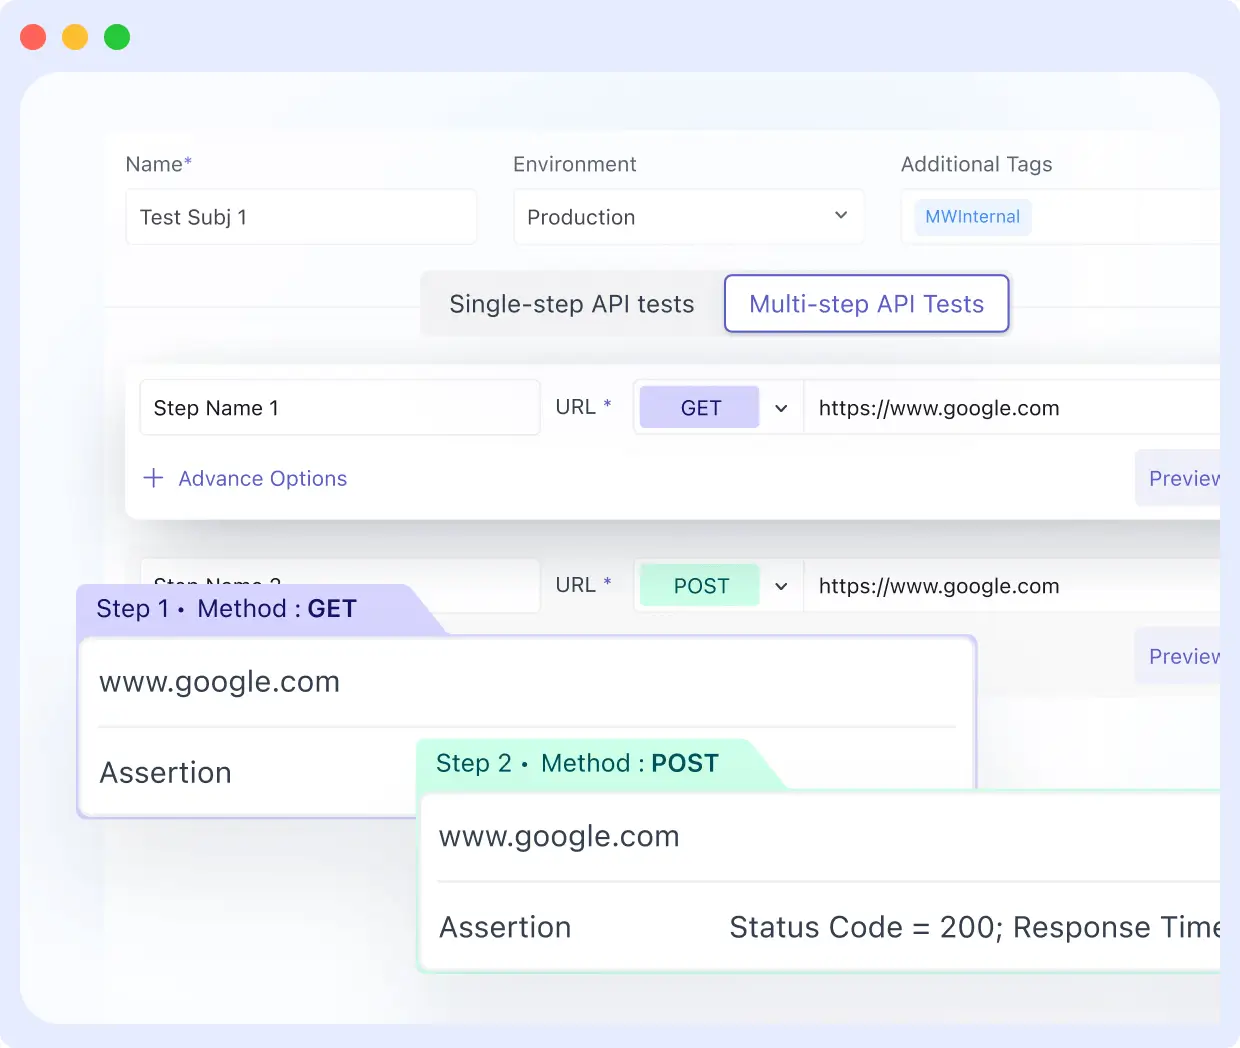
III. Managing Third-Party Redirects & Asynchronous States
Validating the payment flow required navigating the transition between the platform and Stripe’s hosted checkout. The team moved away from fragile, time-based pauses (e.g., wait 5s), which often lead to flaky results. Instead, they utilized explicit event-based waits:
- Wait until a specific DOM element renders.
- Wait until a specific XHR request resolves.
- Wait until a specific response payload is received.
Middleware’s native tab-switching capabilities allowed the test to follow the redirect to the gateway, enter test credentials, and return to the confirmation page verifying the Order ID end-to-end.
IV. Reusing Session Tokens
To maximize execution efficiency and reduce “noise” from flaky login steps, the team implemented two advanced patterns:
Token Reuse: Instead of re-authenticating for every test, the suite captures and stores session tokens in localStorage. This allows subsequent tests to bypass the login UI and jump straight to the feature being validated, significantly reducing execution time.
// Store after login
localStorage.setItem('auth_token', document.querySelector('#session-token').value);

// Reuse in the next step
const token = localStorage.getItem('auth_token');
The Reusable Auth Module: To solve the maintenance nightmare of updating 200+ tests when a login UI changes, the team built a single, global authentication module. Every test references this module; a single update here propagates across the entire suite instantly.
V. Automated MFA & OTP Integration
Security was never compromised for the sake of automation. For accounts requiring Two-Factor Authentication (2FA), the team integrated their scripts with an internal OTP (One-Time Password) service via API:
// Pull OTP from internal test endpoint
const otpResponse = await fetch('https://internal-api/test-otp', {
  headers: { 'Authorization': process.env.TEST_API_KEY }
});
const { otp } = await otpResponse.json();

// Fill the MFA field
await fillInput('#mfa-code', otp);
This enabled full end-to-end validation of secured accounts without manual intervention or weakening production security protocols.
VI. Building a Reusable Auth Module
Managing 200+ tests that each require a distinct login sequence is a maintenance disaster in the making. If the login UI changes, even a minor CSS selector update, a standard suite would require 200 individual manual fixes.
The team neutralized this risk by architecting a Reusable Authentication Module. This module encapsulates the entire login sequence into a single, global reference. Every functional test across the suite simply calls this module to establish a session.
The result: When the login interface evolves, the DevOps team updates one centralized file, and the change propagates across the entire 200-test ecosystem automatically. This modular approach transformed their testing from a brittle collection of scripts into a resilient, scalable observability asset.
When Should Your SaaS Team Make the Switch?
These are the clearest signals that synthetic monitoring is the right investment:
You find out about bugs from customers, not your tools. If a support ticket or a tweet is your first indicator of a broken checkout, your detection surface has a gap that unit tests and uptime pings do not fill. That gap is exactly what synthetic monitoring closes.
You have global users, but test from one location. CDN failures, regional latency issues, and localization bugs are invisible if you only test from your servers’ locations. Synthetic tests from multiple geographic locations catch these before your users in Singapore or Frankfurt do.
Release anxiety is slowing your team down. If “Friday deploy” triggers a risk conversation, that is a monitoring problem wearing a process problem’s mask. Automated post-deployment validation changes the psychology of shipping.
Your test surface has grown beyond what manual QA can cover. There is a point where the number of flows, browsers, devices, and geographies grows faster than any team can manually test. That is when automated browser testing stops being optional.
You have RUM or APM data but no proactive testing. Real User Monitoring tells you what happened after users hit a failure. Synthetic monitoring tells you what is broken before users reach it. They are complementary, not interchangeable. Having one without the other means missing half the picture.
Building a Strong Testing Strategy with Middleware Synthetic Monitoring
With Middleware Synthetic Monitoring, teams can unify browser and API testing into a single workflow, eliminating silos and enabling continuous validation of production environments. Reusable modules and automation help scale testing without increasing operational overhead.
Dive into the documentation to start building your tests, or try Middleware with a free trial.
[Start Your Free Trial →] | [Read More Customer Stories →]
FAQs
What is synthetic monitoring in software testing?
Synthetic monitoring runs automated browser scripts against your live production environment on a continuous schedule, from multiple geographic locations. It tests real end-to-end user flows signup, payment, login, enrollment in real browsers, before real users encounter failures. Unlike real user monitoring, it does not wait for users to hit a problem first. It proactively checks whether those flows are working right now.
How is synthetic monitoring different from unit tests or integration tests?
Unit tests check isolated code functions. Integration tests check that services communicate correctly. Synthetic monitoring tests the full end-to-end user experience in a real browser, from a real network location, against your actual production environment. All three are valuable. Each catches a different category of failure. Synthetic monitoring closes the gap that the other two cannot reach.
How many synthetic tests does a SaaS team need to get started?
Five to ten tests covering your most business-critical flows is the right starting point. These are the flows that generate immediate support volume or direct revenue loss when broken. Get those stable and trusted before expanding. A lean, reliable suite is far more valuable than a comprehensive one that nobody fully trusts.
Why do synthetic tests produce false positives, and how do you fix them?
The most common cause is arbitrary time-based waits, pausing for a fixed number of seconds rather than waiting for a specific element, network request, or API response to complete. The fix is replacing every time-based wait with an event-based wait. Requiring two consecutive failures before alerting eliminates the remaining noise.
How do you handle authentication and 2FA in automated browser tests at scale?
Build one reusable authentication module that handles the full login sequence, including multi-factor authentication via integration with an internal OTP service. Store session tokens where possible to avoid re-running the login before every test. When the login UI changes, update one module in every test that references it, and it picks up the change automatically.
Does synthetic monitoring replace manual QA?
No. Synthetic monitoring automates continuous validation of well-defined, critical user flows. Manual QA remains essential for exploratory testing, edge-case discovery, and evaluating new features that lack automated coverage. The two complement each other; synthetic monitoring fills the gap in continuous detection that pre-deployment manual testing cannot cover.