Analyzing CloudWatch Logs is an essential practice for any organization aiming to optimize their AWS expenditure and enhance the overall visibility of their cloud environment.
These logs contain data that, when properly queried and analyzed, enables teams to respond more effectively and efficiently to operational issues. For instance, if an unexpected issue arises, CloudWatch Logs Insights can be utilized to perform in-depth queries, helping to quickly identify potential causes and verify the effectiveness of deployed fixes.
In this article, we’ll dive into several practical methods for analyzing CloudWatch Logs using Middleware. You’ll learn how to use built-in tools like metric streams and custom dashboards to perform deep-dive queries, rapidly identify issues, and validate the effectiveness of the solutions you deploy.
Understanding AWS CloudWatch
Amazon CloudWatch is a comprehensive monitoring service offered by AWS that tracks the performance and health of your AWS resources and applications. It collects and stores operational metrics and log files from various AWS resources such as EC2 instances, RDS databases, and Lambda functions.
CloudWatch enables you to monitor your AWS account and resources effectively, reacting to system-wide performance changes, optimizing resource utilization, and gaining a unified view of operational health. Think of it like the go-to tool for cloud visibility and monitoring.

What are AWS CloudWatch logs?
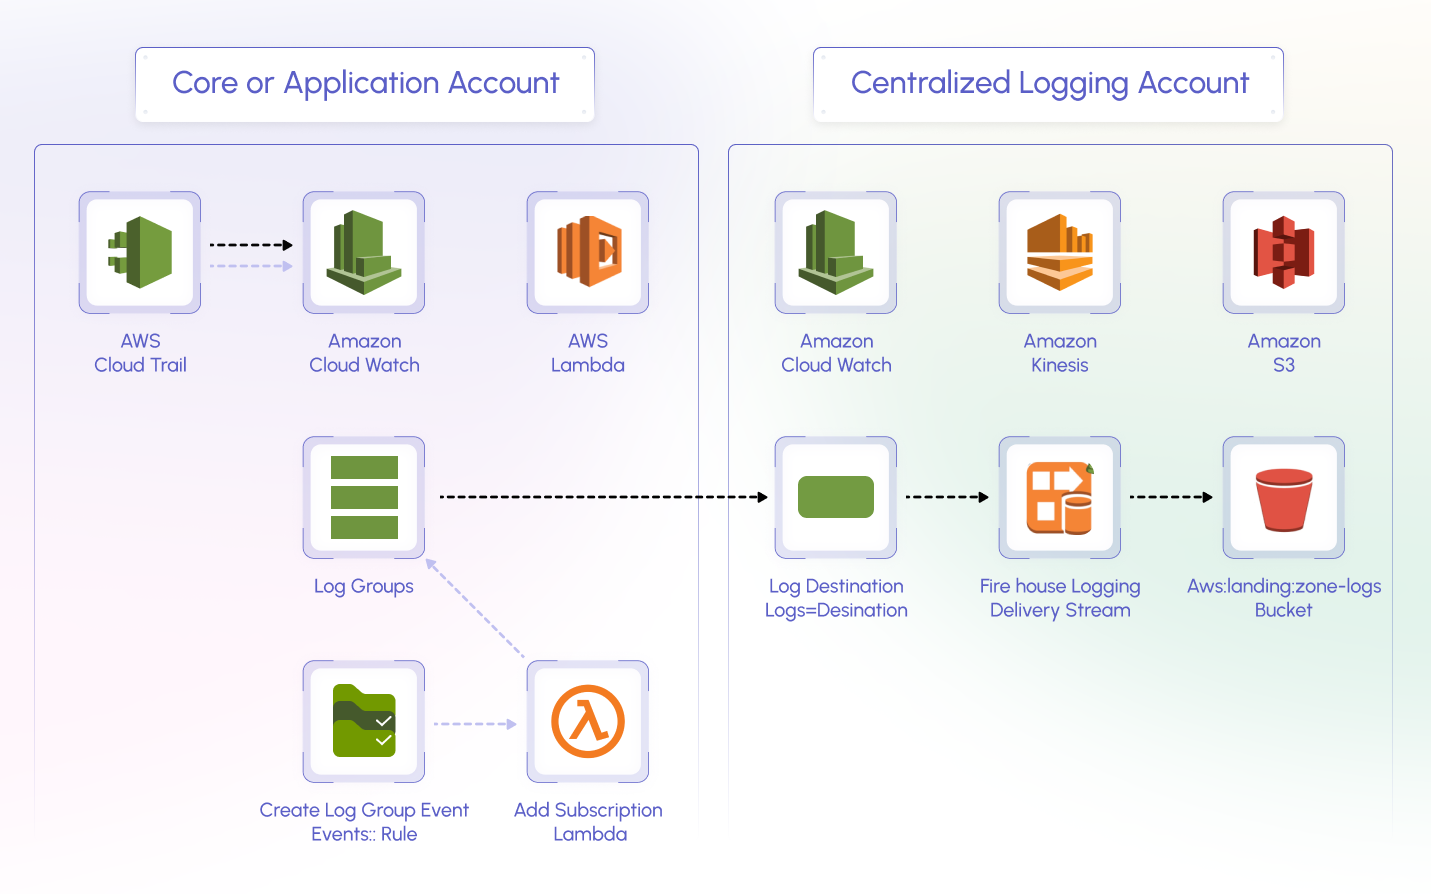
CloudWatch Logs is a feature within CloudWatch that allows you to monitor, store, and access logging information from Amazon EC2 instances, AWS CloudTrail, and other sources. This service is crucial for centralizing logs from all your applications, systems, and AWS services into a single, highly scalable service.
With CloudWatch Logs, you can streamline log management by viewing, searching, and filtering logs irrespective of their origin, thus maintaining a consistent and chronological flow of events.
How to analyze AWS CloudWatch resources, data & metrics using Middleware?
AWS CloudWatch provides robust monitoring capabilities, and integrating it with Middleware can enhance your ability to analyze resources, data, and metrics.
This comprehensive guide will walk you through the 3 steps to start monitoring your AWS environment with Middleware effectively.
Step 1: Integrate AWS CloudWatch or ECS with Middleware
To begin streaming AWS CloudWatch metrics in real-time, we can use Metric Streams, a service provided by Amazon Web Services. This integration involves setting up a Delivery stream and a Metric stream.
Here’s a link to the documentation on how to set it up.
With the Middleware Agent, you can also monitor your ECS containers and tasks running on EC2 instances and ECS Fargate. This ensures comprehensive monitoring of your containerized environments.
For more detailed instructions, refer to the Middleware integration documentation.
Step 2: Display metrics and logs in Middleware log section
Once you have integrated AWS services with Middleware, the next step is to display and analyze the metrics and log data. Here’s how you can make the most of the Middleware dashboard:
Viewing metrics
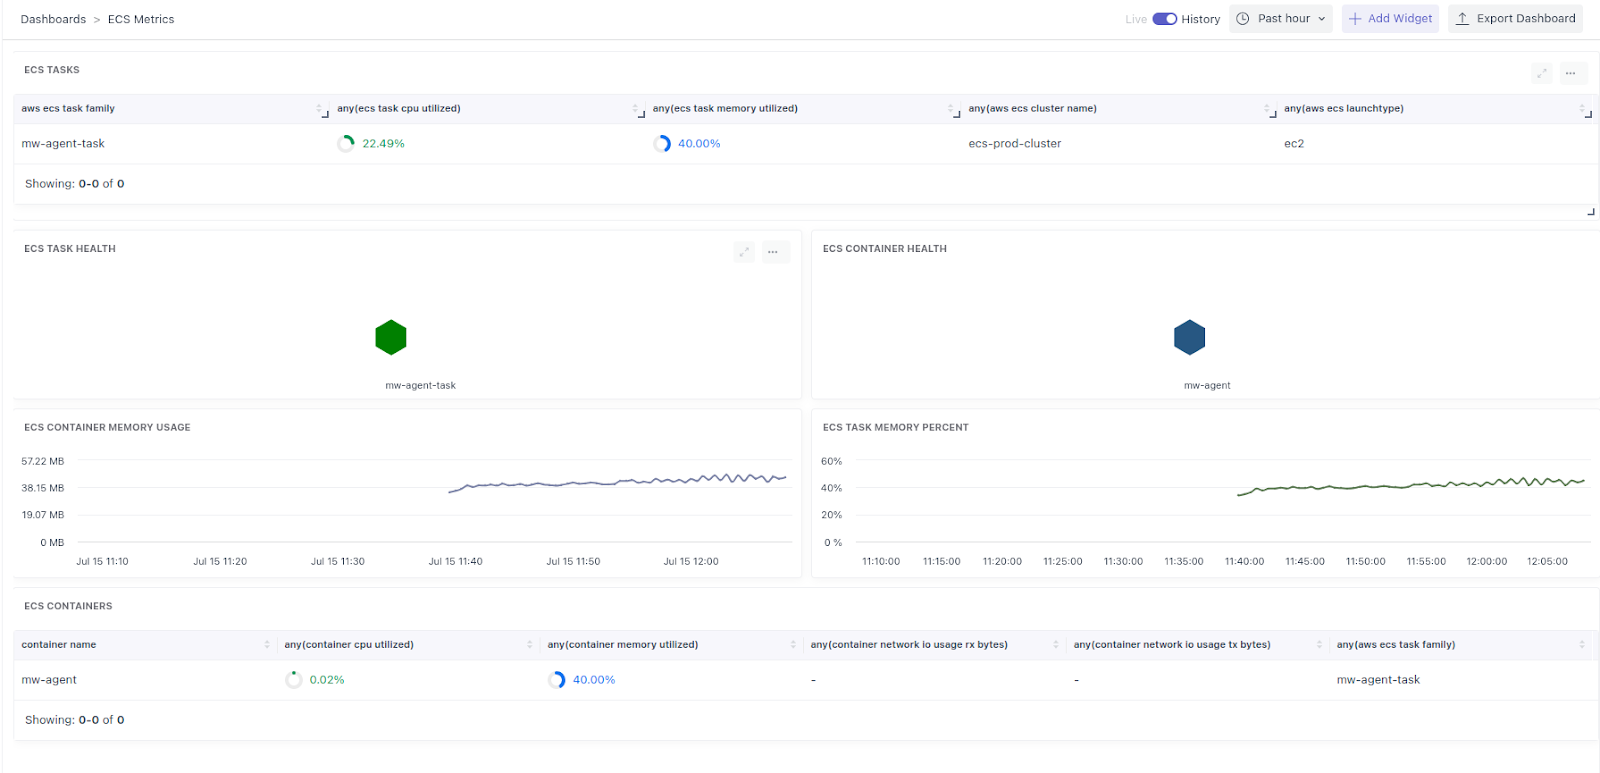
After successful integration, Middleware’s dashboard will automatically start pulling in metrics and log data from AWS CloudWatch and ECS. Some of the key metrics you can monitor include:
- Task health: Check the health status of your tasks to ensure they are running smoothly.
- Container health: Monitor the health of your containers to detect any potential issues early.
- Container memory usage: Keep track of the memory usage of your containers to optimize performance.
- Task memory percent: View the percentage of memory utilized by tasks to manage resources effectively.
Custom dashboard builder
To tailor the monitoring experience to your specific needs, you can create custom dashboards. Here’s a step-by-step guide:
- Enter custom dashboard builder: Navigate to the custom dashboard builder from the Middleware dashboard.
- Select widget type: Choose from various widget types such as Time Series, Bar, Heatmaps, and more.
- Choose data source and metrics: Select the appropriate data source (e.g., “cloud”) and metrics stream. Choose the specific metrics you want to monitor.
- Configure parameters: Set up additional parameters and filters to refine the data visualization according to your requirements.

You can always navigate back to the default dashboard under the AWS CloudWatch section in the left-hand menu of the Middleware platform.
Step 3: Visualize your metrics
Visualizing your metrics effectively is crucial for gaining insights into your AWS environment. Middleware offers two primary ways to visualize your data:
Middleware’s default AWS dashboards
Middleware provides pre-configured dashboards for popular AWS services. These dashboards come with a variety of graphs and visualizations representing key metrics for each service. For instance, an EC2 namespace dashboard might include metrics such as CPU utilization, network traffic, and disk I/O.
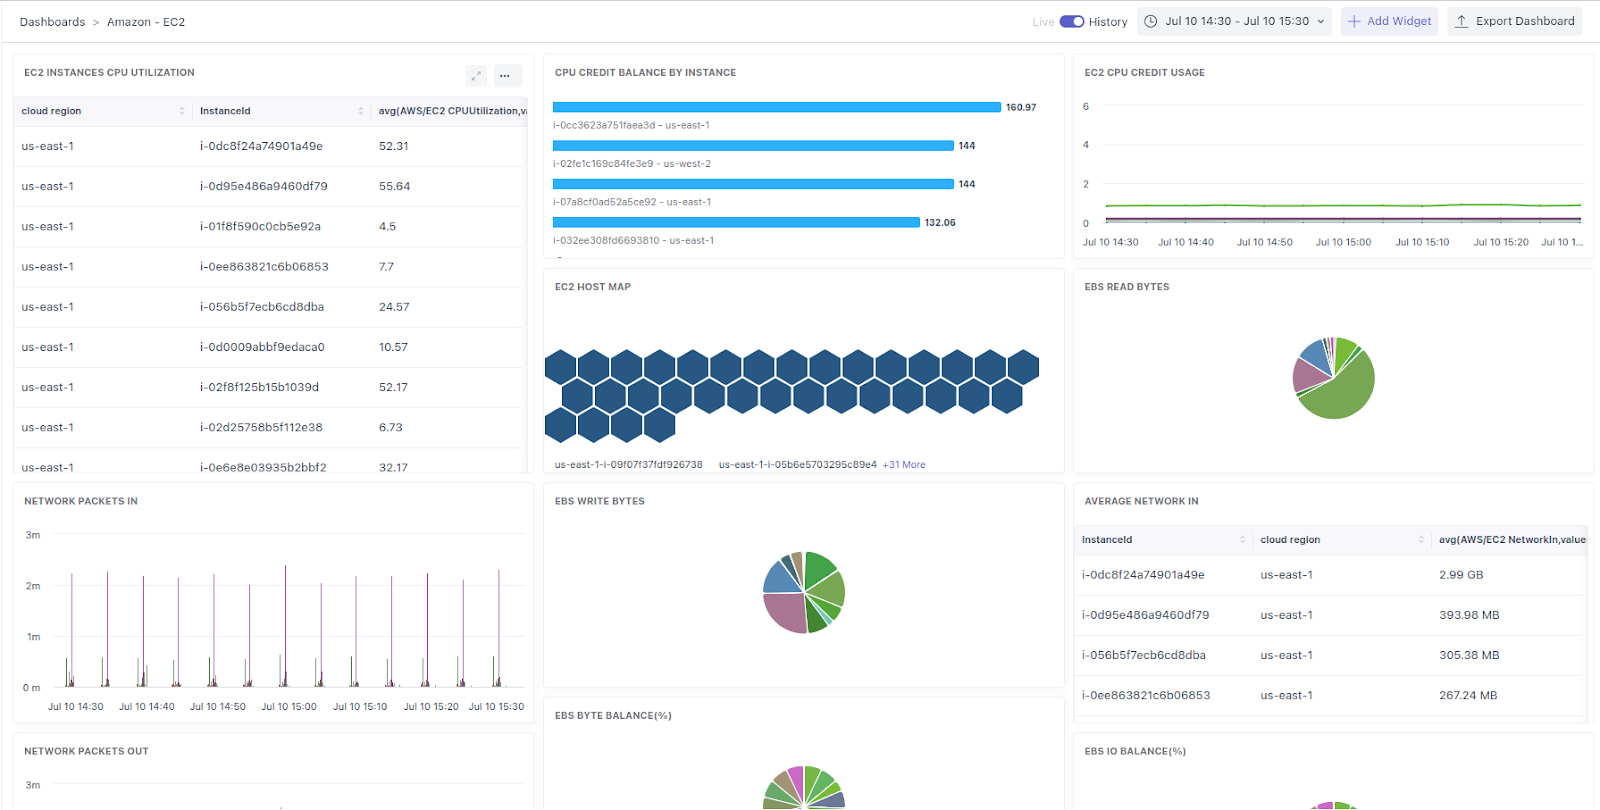
These default dashboards are designed to give you a comprehensive view of your AWS services’ performance and health. You can explore similar dashboards for other AWS services within Middleware’s default dashboard collection.
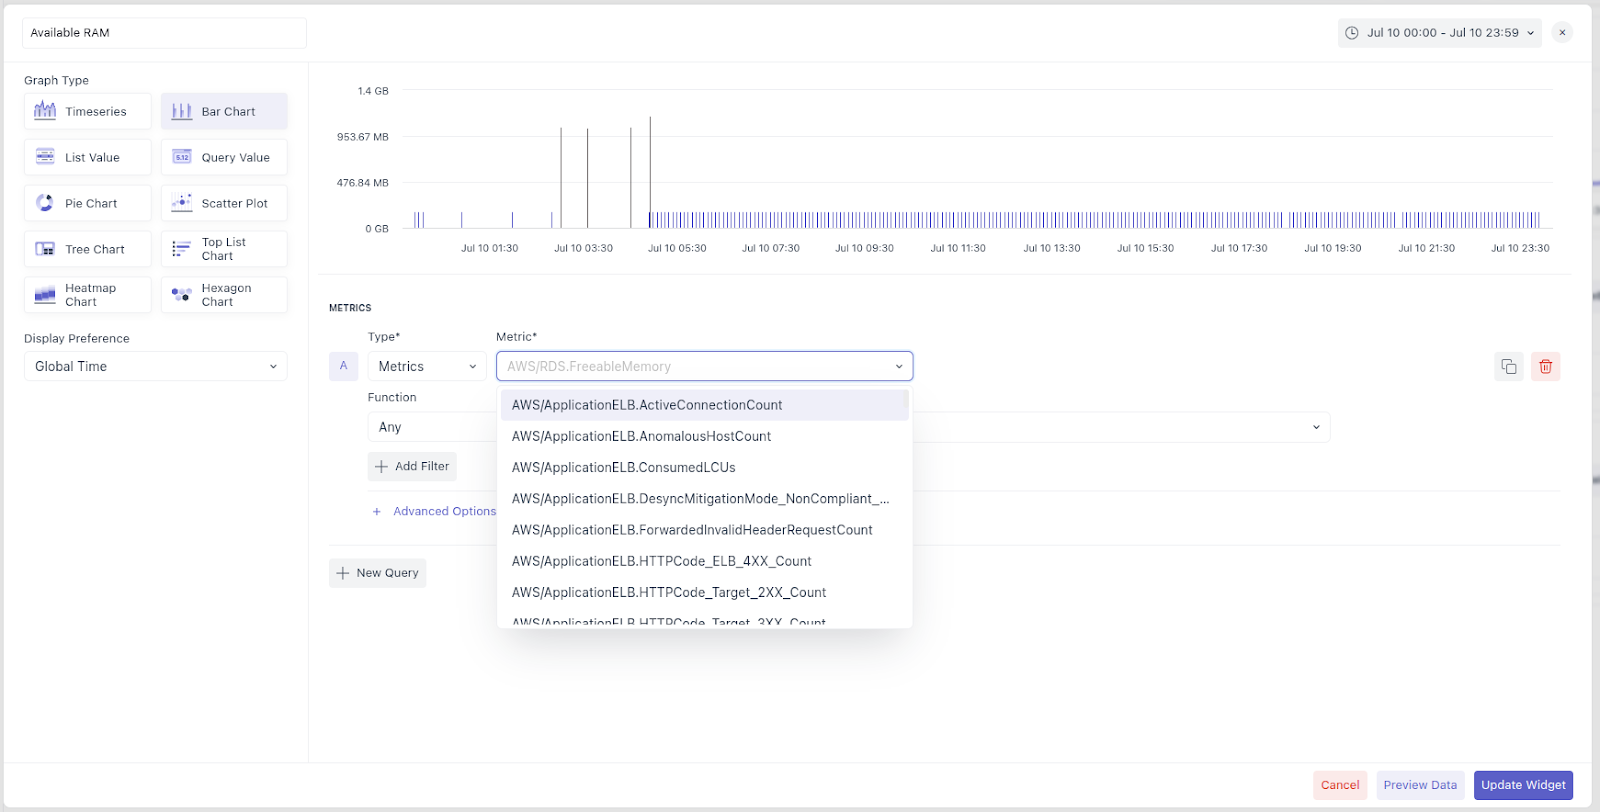
Build custom widgets using Middleware’s dashboard builder
If you need a more customized view, you can build your own dashboards from scratch. Here’s how:
- Add new widget: To any existing dashboard, add a new widget.
- Select AWS metrics: Choose from the list of available AWS metrics under the “cloud” data source.
- Widget types: Visualise your data using various widget types such as Time Series, Bar Chart, Pie Chart, etc.
- Customize data visualization: Tailor the widgets to display the metrics that are most important to you.
By customizing your dashboard, you can focus on the specific metrics and data points that matter most to your operations, providing a tailored monitoring experience.
How much does AWS CloudWatch Cost? You can read about AWS CloudWatch Pricing, or try out the AWS Cloudwatch Pricing Catalog to view direct, indirect, and hidden costs associated with using CloudWatch.
Conclusion
Integrating AWS CloudWatch with Middleware significantly enhances your ability to monitor and analyze your AWS environment.
By following the steps outlined in this guide, you can set up real-time streaming of metrics, customize your dashboards, and gain deep insights into your AWS resources.Whether you utilize default dashboards or build custom views, Middleware provides powerful tools to manage and optimize your AWS infrastructure effectively.


