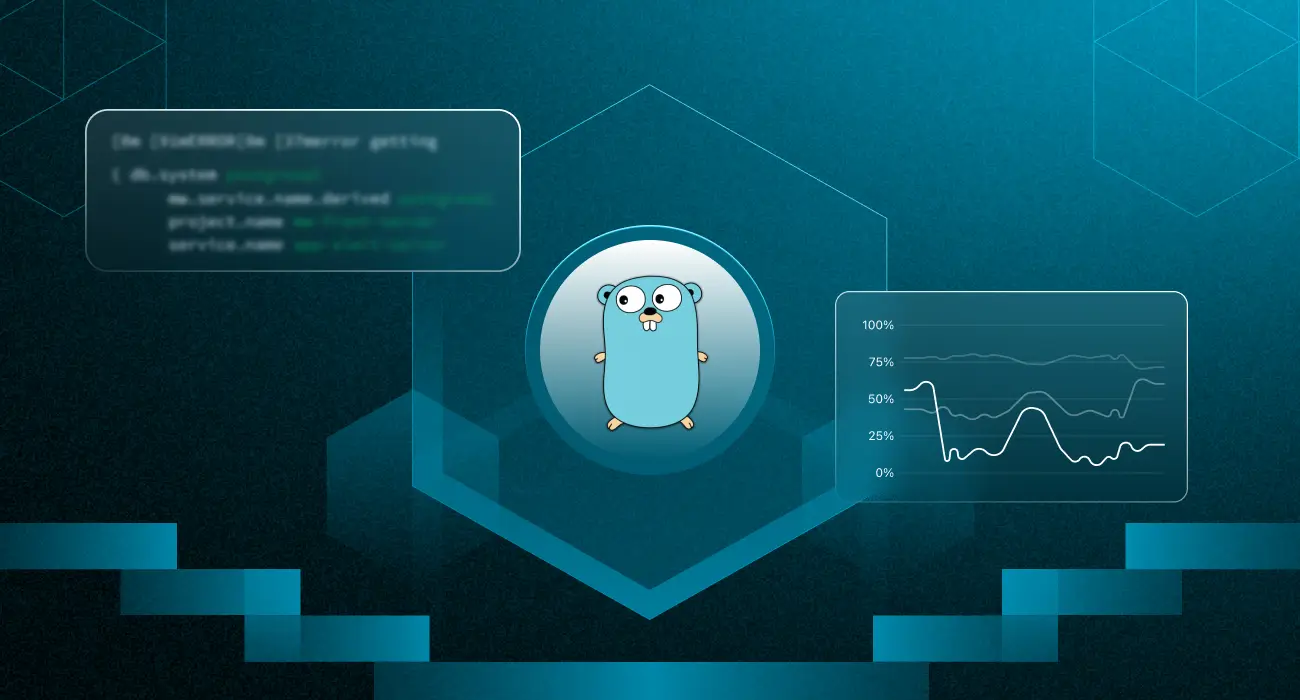
If you’re a developer utilizing Golang for its performance, versatility, and CSP-type concurrency, you’re already using one of the most efficient languages. And in programming, you want as much efficiency as possible. But if you do not have an effective logging strategy in place, you’re only getting half the efficiency from it. You will never be able to see into the way your application behaves.
With logging, you can:
- Record important events for future decision-making
- Track application execution step-by-step
- Debug issues quickly
- Monitor application performance in real-time.
- Record important events for future decision-making
Whether you’re using Go’s built-in logging or a third-party library, this guide covers everything you need to know, plus modern best practices and tools to keep your logs actionable and performance-friendly.
What is Golang logging?
In simple terms, logging in Go is about capturing key events and messages that happen while your application runs, anything from a debug message during development to a critical error in production.
Go includes a standard logging package that provides a simple way to log events without bringing in a new dependency.
It lets you:
- Automatically add a timestamp to every log message
- Log critical events (Fatal/Panic)
- Log informational (Print)
- Control the destination of the output (files, consoles, or custom writers)
By default, log writes to standard error (STDERR), which is fine for basic usage. But in real-world, production-grade systems, you’ll often need more:
- Structured logging for easier parsing in monitoring tools
- Different log levels for filtering noise vs. urgent alerts
- Centralized log storage for distributed apps
- JSON output for compatibility with log aggregators like Middleware, ELK, or Loki
Why is Golang Logging Important?
Golang logging keeps you informed about your application’s inner workings. This lets developers:
- Debug issues: Logs help you pinpoint the faulty code section, saving you hours of head-scratching.
- Monitor performance: Logs expose performance bottlenecks, revealing areas for optimization.
- Gain insights: Logs tell you how your app is used, informing future decisions.
How Does Golang Logging Work?
Golang logging can be done using the built-in log package or through third-party libraries. The standard log package gives you the essentials, letting you write messages to the console or a file, format them, and control their output level. Third-party tools build on this foundation, offering features like structured logging, JSON output, and better performance.
The built-in package comes with several functions for printing messages:
- Print(), Printf(), Println() → Used for informational logs (INFO level by default).
- Fatal(), Fatalf() → Log a message and then terminate the program (FATAL level).
Printf and Fatalf let you format messages with variables.
Println automatically adds a newline at the end.
You can also customize your logs by:
- Adding prefixes to each message.
- Including timestamps.
- Redirecting output to a file or another destination instead of just STDERR.
To use the logging package, you must first create a logged object with the function:
This function produces the output destination of the log messages and the prefix that will be added.
For example, to create a logger that writes to standard output (STDOUT) with the prefix INFO, you can run this function:
logger := log.New(os.Stdout, "INFO: ", log.Ldate|log.Ltime)
You can then use the logger to write log messages using the Print, Printf, and Println functions. Consider this PrintIn log message:
logger.Println("This is an info message.")
It will produce this output:
INFO:2023/02/17 14:30:15 This is an info message.
Golang’s log package provides many other features. Check the Golang documentation for more information.
How to Measure Golang Logs
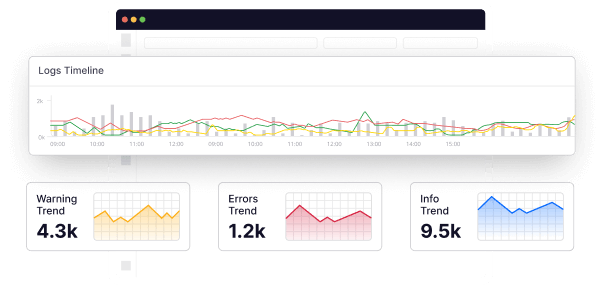
Measuring Golang logs means looking at the logs you’ve collected to understand how your application is running. By reviewing them, you can spot errors, find performance bottlenecks, and see usage patterns.
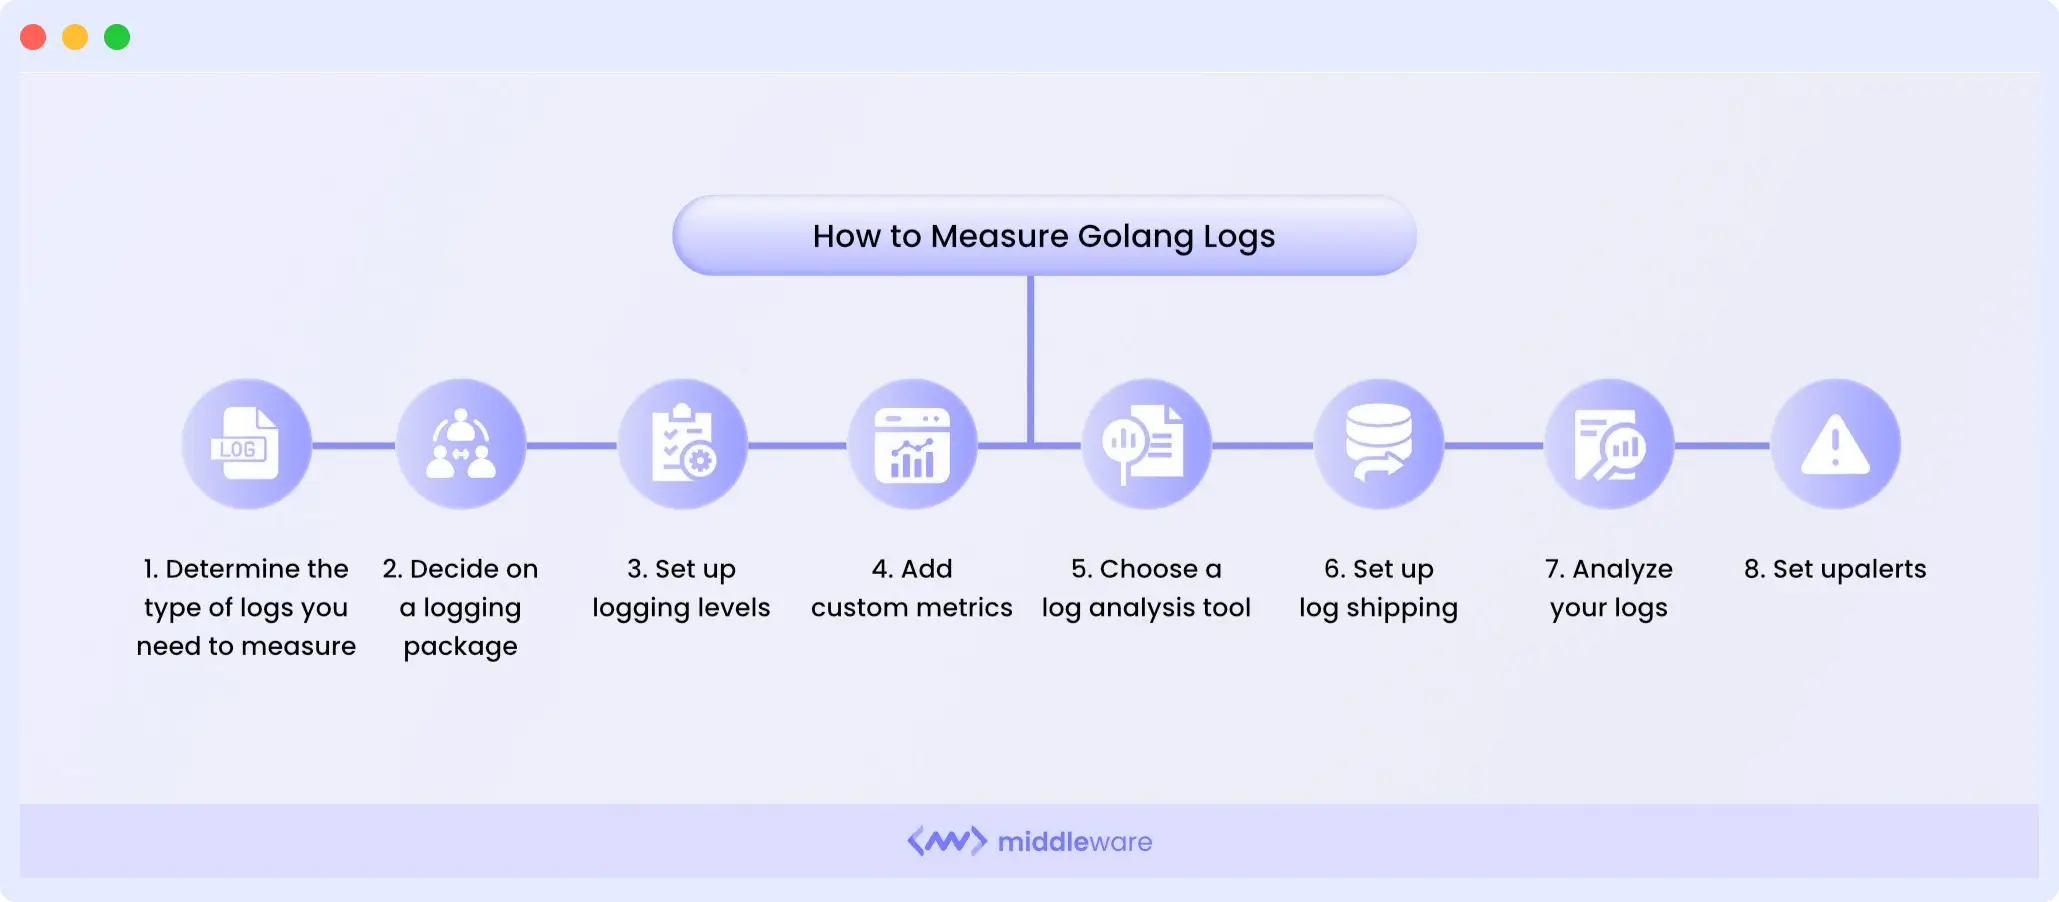
Follow these steps to measure your logs:
1. Identify The Type Of Logs You Need
Before you start measuring, decide what’s important to you. Are you tracking:
- Performance metrics: request/response times, CPU usage, memory usage
- Error tracking: error rates, failed requests
- Business or app-specific events: user actions, API calls, payment events
2. Pick A Logging Package
You can use Golang’s built-in log package, or go for third-party tools like logrus, zap, or zerolog if you need more features like structured JSON logging.
3. Set Up Logging Levels
This allows you to restrict the information to specific resources. Depending on your needs, you can use these levels to generate more or less detailed logs.
DEBUG: Detailed information for debugging
INFO: General application flow updates
WARN: Something unexpected, but app continues
ERROR: Something failed but app still runs
FATAL: Serious issue causing shutdown
Check out our detailed guide on Log Levels to understand when and how to use each effectively.
4. Add Custom Metrics
Sometimes standard logs aren’t enough you might want to track things like how many orders were placed in the last hour, how many failed logins happened today, or the average response time of a specific endpoint.
In Go, you can:
- Use a third-party solution like Middleware to capture structured, queryable metrics alongside your logs.
- Use the built-in expvar package to expose numeric metrics as HTTP endpoints.
5. Choose a Log Analysis Tool
Analysis tools help you aggregate, search, and analyze your logs. Many log analysis tools are available, such as Middleware, Splunk, Loggly, and many other tools that you can use to aggregate and analyze logs, generate reports, make dashboards, and visualize metrics.
6. Set Up Log Shipping
This enables you to send your logs to your chosen analysis tool. It involves configuring your logging package to write logs to a file or stream and then sending that file or stream to your log analysis tool.
7. Analyze your Logs
After capturing your logs and sending them to your analysis tool, look for log patterns and trends in the data, and use that information to optimize your application.
8. Set Up Alerts
You can also set up alerts based on specific events or metrics in your logs. For example, you might set up an alert to notify you if the error rate in your logs exceeds a certain threshold.
9. Audit and Optimize
Regularly review logs to refine what’s captured. Focus on relevant data to maintain performance and actionability.
Golang Logging Best Practices
Good logging isn’t just about printing messages; it’s about making logs easy to read, search, and act on. Here are some practical tips to improve your logging in Go.
1. Choose the Right Logging Framework
While Golang provides a built-in “log” package, the package has limited functionality. Consider using a third-party logging framework that is more feature-rich for more control over log output.
2. Use Structured Logging
Structured logging is a technique where log messages are formatted into machine-readable formats such as JSON. This makes it easier to search and analyze logs and extract valuable information. It is beneficial when dealing with large volumes of logs.
3. Log at the Right Level
Use the appropriate log level based on the severity of the event being logged. Streamlining your log to the appropriate level prevents overloading logs with too much or too little information.
Understand Golang Log Levels: Learn the purpose of DEBUG, INFO, WARN, ERROR, and FATAL logs to optimize monitoring and debugging.
4. Use Contextual Information
Contextual information makes logs more traceable, informative, and valuable. They are helpful during troubleshooting issues and debugging problems. This information includes timestamps, request IDs, user IDs, and other relevant data.
5. Limit Log Output
Avoid logging sensitive information and limit the amount of data output to reduce the risk of information leakage or performance degradation. Security teams often stumble upon sensitive information in log files when carrying out recovery tasks. Malicious insiders can readily exploit this information.
6. Centralize Logs
Collect logs from all your application instances in a centralized location to make searching and analyzing log data easier. A log management platform like Middleware is your best bet to ensure this.
7. Regularly Review Logs
Regular review of logs enables you to identify patterns, spot errors, optimize application performance, and prevent security risks.
Conclusion
Golang logging involves the collection and measurement of logs and aids the optimization of Golang applications. With its flexibility and high performance, Golang programming provides developers with an efficient logging package to facilitate logging activities.
This enables them to capture critical information in real-time and monitor the behavior of their application. Since third-party logging solutions are more robust, customizable, and provide more extensive visibility into your Golang logs, they are your best bet for effective Golang logging.
However, not all third-party logging solutions provide the requisite control over your logs or ratify the tooling-based best practices highlighted above. While some do not provide intelligent feedback on your logs, others do not provide a central location to store your logs.
Middleware satisfies all these conditions—log filtering and analysis, dashboard customization, seamless integration with existing infrastructure, and many other features that dignify it as your safest option for well-executed Golang logging. Start logging in for free today!
FAQs
What are logs in Golang?
Logs in Golang refer to the mechanism used for capturing and recording information about a program’s execution. It helps to track errors, monitor performance, and gain insights into the behavior of applications.
The log allows you to write your application status messages to files, databases, or other output streams. These messages contain information on which parts of your code have been executed and what problems may have arisen.
Why logging is important in Golang?
Logging in Golang is important because it helps you determine which section of your code is causing an issue. This essentially helps you debug your application by letting you track step by step execution of your application.
What are types of loggers and which one is best?
Logging classified logging messages to different logging levels. A logging level acts as a message filter.
This logging include Trace < Debug < Info < Warn < Error < Fatal, based on the priority order:
log.Trace("Something very low level.")log.Debug("Useful debugging information.")log.Info("Something noteworthy happened!")log.Warn("You should probably take a look at this.")log.Error("Something failed but I'm not quitting.")// Calls os.Exit(1) after logginglog.Fatal("Bye.")// Calls panic() after logginglog.Panic("I'm bailing.")
What is difference between stacktrace and logs?
A stack trace in Golang shows the sequence of function calls leading to an error or specific code point. It helps with debugging and issue diagnosis.
Logs, on the other hand, provide informational messages about the application’s behavior, including events, errors, and performance metrics.
Logs offer a broader view of the application’s runtime state and are useful for monitoring and analysis purposes.
Which library is best for logging Golang?
Popular logging libraries in Golang include logrus, zap, and go-kit/log. The choice depends on specific needs such as ease of use, performance, and integration capabilities. Evaluate them based on project requirements to determine the best fit.
According to the stats on GitHub, zap is the fastest logger available.
What is the fastest logging library for Go?
zap is widely regarded as the fastest logging library for Go, offering high-performance, structured logging.
How do I enable structured logging?
Use logging libraries like zap or logrus to format logs in structured formats such as JSON, which makes them machine-readable and easier to analyze.
How do I avoid logging sensitive data?
Always filter or mask sensitive information before logging. Avoid logging passwords, personal user data, or API keys, and use structured logging with selective fields to maintain security.


