Developers continue to seek faster production cycles and iterate with solutions that quicken the Software delivery lifecycle. They iterate with cloud service providers, container orchestration tools, and programming languages and leapfrog from tool to tool.
As an open-sourced, statically typed high-level programming language, Golang offers code efficiency for faster software delivery. Also known as Go, Google developed it in 2007 to outperform programming languages such as C, JavaScript, and Python in performance.
Although Golang bears syntactic similarity to C, it is simpler, with garbage collection, structural typing, and CSP-style concurrency. Go ranks among the top 3 languages for Kubernetes workloads, with 11% of developers planning to adopt it in the next 12 months (JetBrains State of Developer Ecosystem 2025).
However, given Golang’s vastness, it requires proper monitoring to ensure runtime efficiency. In this article, we deep-dive into Golang monitoring and its importance in the efficiency of Golang applications.
What is Golang Monitoring?
Golang monitoring is the practice of managing Golang infrastructures and observing the performance of its applications. It involves collecting and analyzing performance data and tracking applications’ availability to understand their behaviors and ensure proper service delivery.
Golang application monitoring enables developers to identify issues, optimize performance, and ensure that the application functions as intended. A glance at the overall Golang architecture reveals the health status of each application and enables quick problem discovery and troubleshooting.
It is a monitoring best practice to collect relevant metrics, such as memory usage, error rates, and latency, to achieve effective results. Setting up a notification feature for alerts is also vital, as is monitoring dependencies to understand how they affect your Golang application’s performance.
Monitoring is essential for distributed applications and microservices that run many small services across different virtual machines.
Identifying the root cause of performance issues or errors can be difficult without monitoring these environments.
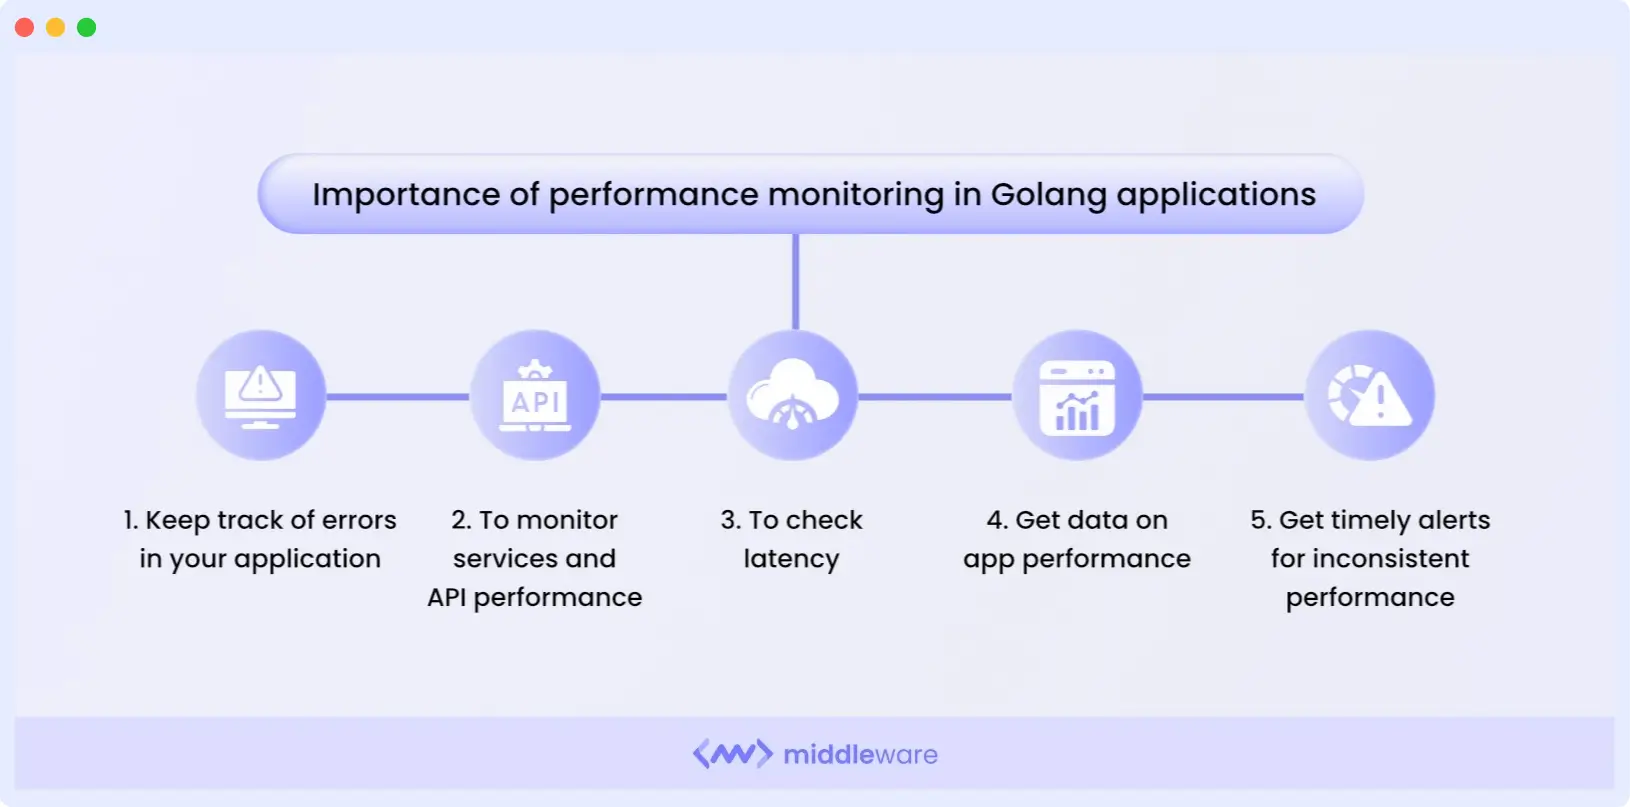
Importance of Performance Monitoring in Golang Applications
Golang application performance monitoring fosters the availability and scalability of Golang applications. Some of the key importance of Golang performance monitoring are:
1. Error Tracking
Golang performance monitoring helps you track application errors and respond quickly.
By keeping tabs on key metrics such as memory usage, CPU utilization, and network traffic, you can detect timely errors and fix them before they go out of hand. This helps enhance user experience.
⚡ See Who Broke What Instantly
Middleware links commits to errors so you can identify the responsible changes without sifting through logs. Explore Commit Ownership
2. Services and API Performance
Monitoring your Golang applications provides services and API performance metrics that are valuable for improving your applications.
These metrics may include the most frequently used endpoints, excessive resource consumption, and slow queries, and they help you maintain your software’s reliability.
3. Latency Checks
An application that takes longer than three seconds to load loses users and potential customers. Latency checks provide information about your Golang application’s performance, identify bottlenecks, and provide root-cause analysis to optimize software health.
4. Performance Feedback
Real-time, real-life data on application performance helps optimize Golang infrastructure. Monitoring provides intelligence-based data on application performance, which helps with troubleshooting. Monitoring tools sometimes display this data in charts and graphs.
5. Timely Alerts
Golang application monitoring also provides timely alerts for inconsistent performance or misbehavior, such as memory leaks, suspicious intrusions, or threshold exceedances.
You can configure this alert feature to send notifications on critical events to specific teams that will take action. This real-time error-detection feature helps minimize application downtime by enabling rapid troubleshooting and remediation.
| Benefit | Key Metrics Tracked | Impact on Golang Apps |
| Error Tracking | Frequent endpoints, resource consumption, and slow queries | Quick fixes enhance user experience. |
| Services & API Performance | Frequent endpoints, resource consumption, slow queries | Improves reliability and optimization |
| Latency Checks | Load times (>3s loses users) | Root cause analysis boosts speed |
| Performance Feedback | Real-time charts/graphs on infrastructure | Enables data-driven troubleshooting |
| Timely Alerts | Memory leaks, threshold breaches | Minimizes downtime via notifications |
Top 5 Golang Monitoring Best Practices
Following golang monitoring best practices goes beyond simply checking if your application is running. It empowers you to proactively identify potential issues, diagnose problems faster, and ensure optimal performance and user experience. Now, let’s dive into the top 5 golang monitoring best practices:
Instrument your code
Start by strategically adding small code snippets to collect data on the application’s internal workings. Use libraries such as OpenTracing or Prometheus to monitor relevant metrics, including request latency, memory usage, and database interaction times.
This approach will provide granular insights into application performance, which is useful for pinpointing bottlenecks and troubleshooting issues.
Implement effective logging
Though Golang’s standard library provides a log package, you can look into libraries like logrus or zap for better features. You can use different log levels, such as INFO, WARN, and ERROR, to prioritize events. To make the analysis clearer, include context information such as timestamps, user IDs, and request details.
This way, you can get a chronological record of events, which is again useful for debugging, tracing application flow, and understanding user behavior.
How to Choose the Right Monitoring Tool
This aspect is subjective as it depends on your requirements and budgets. Nonetheless, when choosing a monitoring tool, look for features such as custom dashboards, alerts, anomaly detection, and integrations with other tools.
If your budgets are too tight, you can even consider open-source options. Ultimately, you need a comprehensive monitoring tool that provides a centralized view of metrics, delivers notifications for critical events, and tracks application health over time.
Alerting on Key Metrics
It’s important to define thresholds for key metrics such as CPU usage, database errors, API response times, and others from the outset. After that, set up alerts that notify you when thresholds are breached and signal potential issues.
This enables proactive problem detection, allowing developers to address issues before they become major incidents.
Automate Monitoring
Automate monitoring tasks such as data collection, alert triggers, and incident workflows to boost your efficiency. Always integrate monitoring tools into continuous integration/continuous delivery (CI/CD) pipelines to enable proactive feedback.
This helps reduce manual work, ensures consistency, and enables faster feedback loops for continuous improvement.
How does Golang Application Monitoring Work?
Golang monitoring automatically maps application topology, detects interdependencies, and traces application behavior end to end. It provides end-to-end visibility into your Golang environment, including infrastructure, architecture, and applications.
It works by collecting and analyzing metrics, data points, and logs from a running Golang application, then displaying them on the dashboard for visibility or triggering alerts. Go monitoring often follows this sequence:
Step 1: Instrumentation
To collect the required monitoring metrics, instrument the Golang application by adding monitoring libraries that capture critical data, including CPU usage, memory consumption, error rates, network traffic, and request latency.
Step 2: Data Collection
Once you instrument the application, data collection begins. Monitoring tools gather relevant data from log files, system performance counters, and other available sources.
Step 3: Data Aggregation
Monitoring tools aggregate the collected data and store it in a centralized repository, such as a Golang database or a monitoring system, enabling easy metric analysis.
Step 4: Visualization
The data or metrics are then visualized in a comprehensive display. This could be in dashboards that provide end-to-end visibility into Golang applications, with charts and graphs showing event trends in real time. The insights gathered from the monitoring exercise can be used to improve Golang applications.
Golang monitoring enables you to proactively identify and resolve issues in your application, optimize performance, and ensure user availability. The monitoring exercise can be easily implemented with a comprehensive monitoring tool.
Step 5: Data Analysis
The collected and aggregated data are analyzed to identify patterns or anomalies that may indicate issues with the Golang application. For instance, you might examine CPU or memory usage trends over time, or correlations between request latency and error rates.
Step 6: Alerting
At this stage, alerts can be configured to notify you when specific events occur, such as high memory usage or rising error rates.
Monitoring Golang applications with Middleware
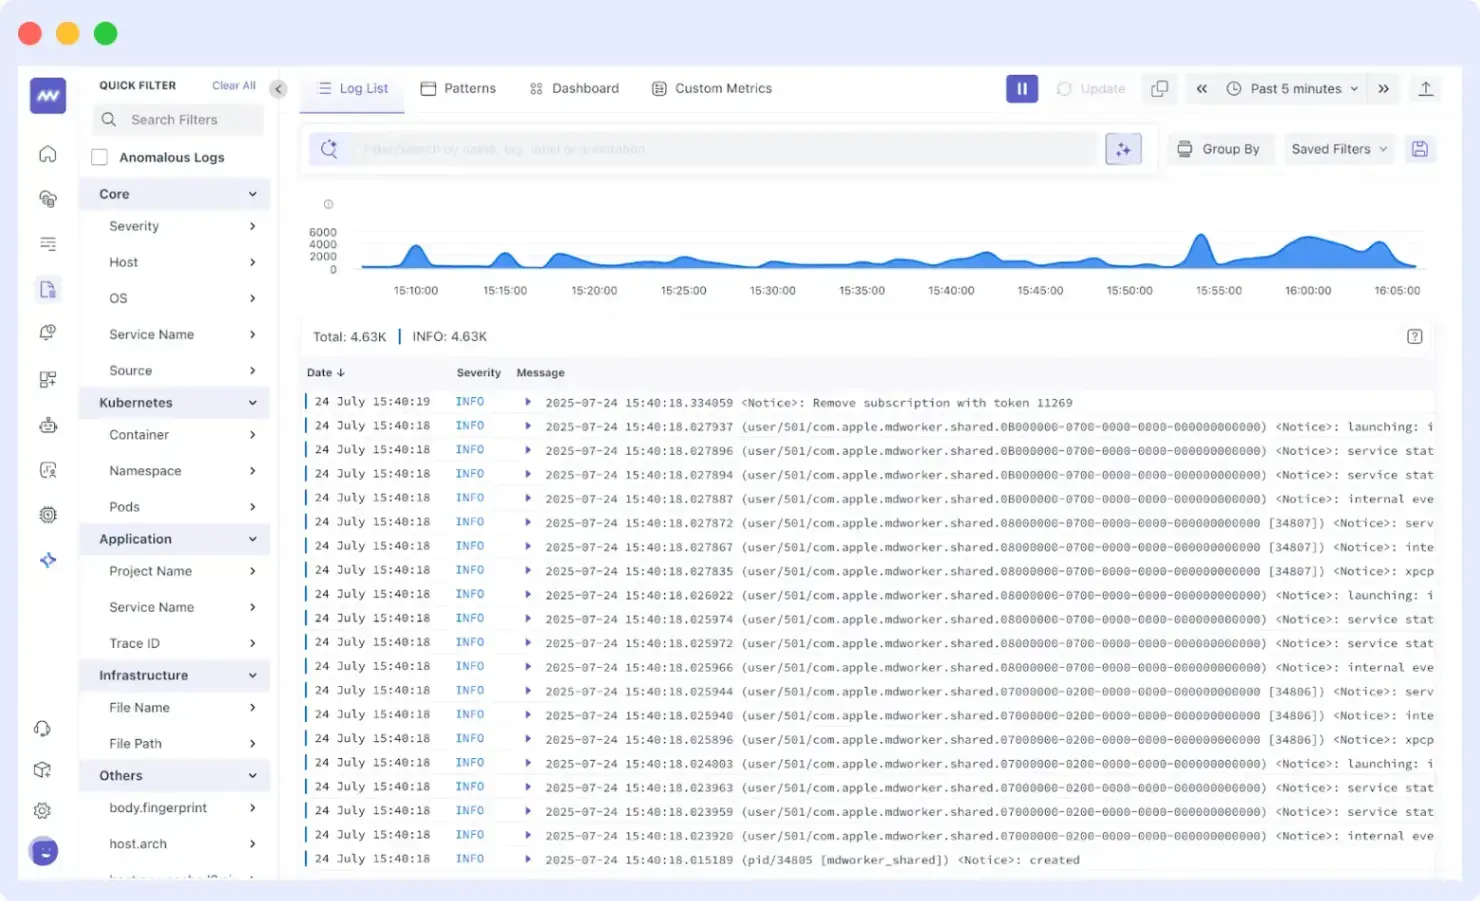
Middleware follows the six-tiered process of Golang monitoring highlighted above. After installing the Middleware agent, the agent instruments your application, collects data about your application and its dependencies, aggregates it, analyzes it, and presents it as logs and traces in a unified dashboard
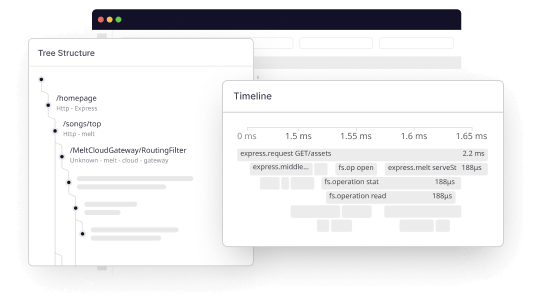
The dashboard displays the requisite information about your Golang application. To view errors and performance leaks in your Golang application, you can check the logs list, an example of which is graphically illustrated below:
Best Golang Monitoring Tools
Three of the best Golang Monitoring tools are:
Middleware
Middleware is a monitoring and alerting tool for managing Golang architecture at the application, endpoint, and customer levels. It gives end-to-end visibility into your Golang Infrastructures and provides root cause analysis of issues causing bottlenecks, thereby enhancing end-user experience.
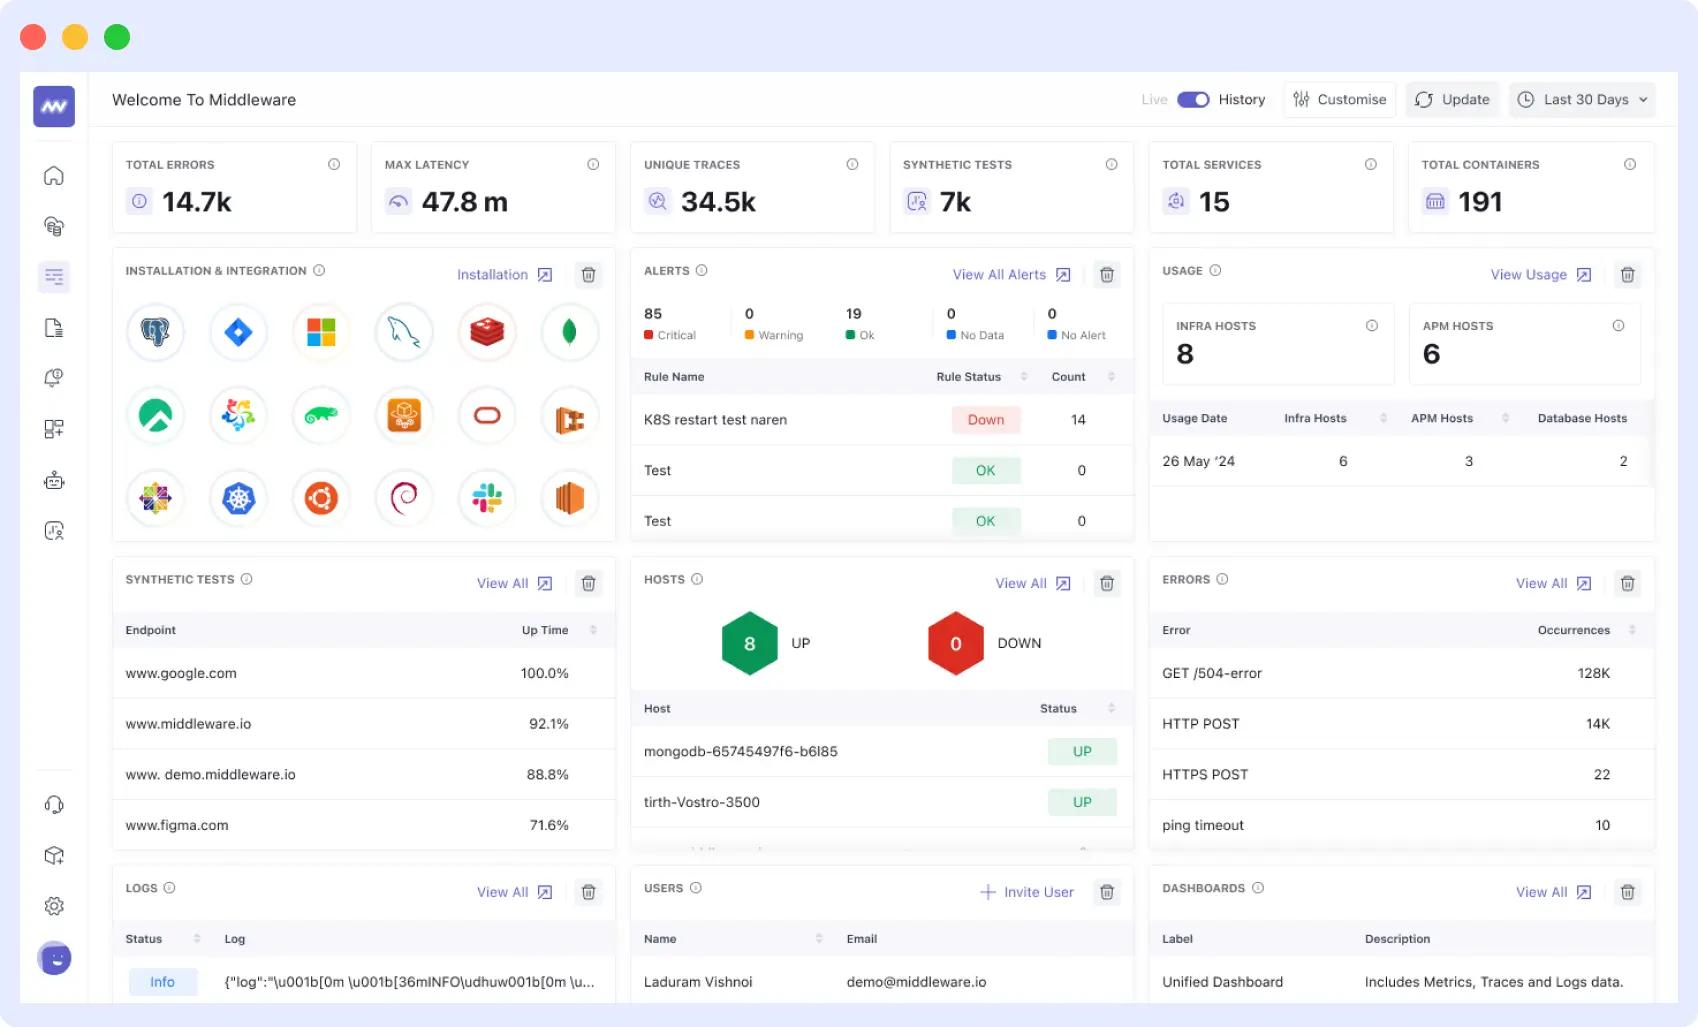
Middleware gathers all correlating metrics, logs, KPIs, traces, and data in real-time in one all-encompassing platform. Apart from simply detecting errors, this monitoring solution provides analysis that helps you properly troubleshoot and fix your applications. It is also an effective monitoring solution for Kubernetes and Node.js applications.
Key Features:
- eBPF-based tracing with zero code changes and 90% lower overhead
- AI-powered anomaly detection for proactive issue prediction
- Frontend-backend correlation capturing full request journeys
- Custom alerts with Slack/PagerDuty integration
Start Monitoring Go in Minutes
Skip long setup guides. Middleware’s Go APM SDK gets you running with traces, metrics, and profiling in just a few lines of code.
👉 See Go APM setup steps
Prometheus
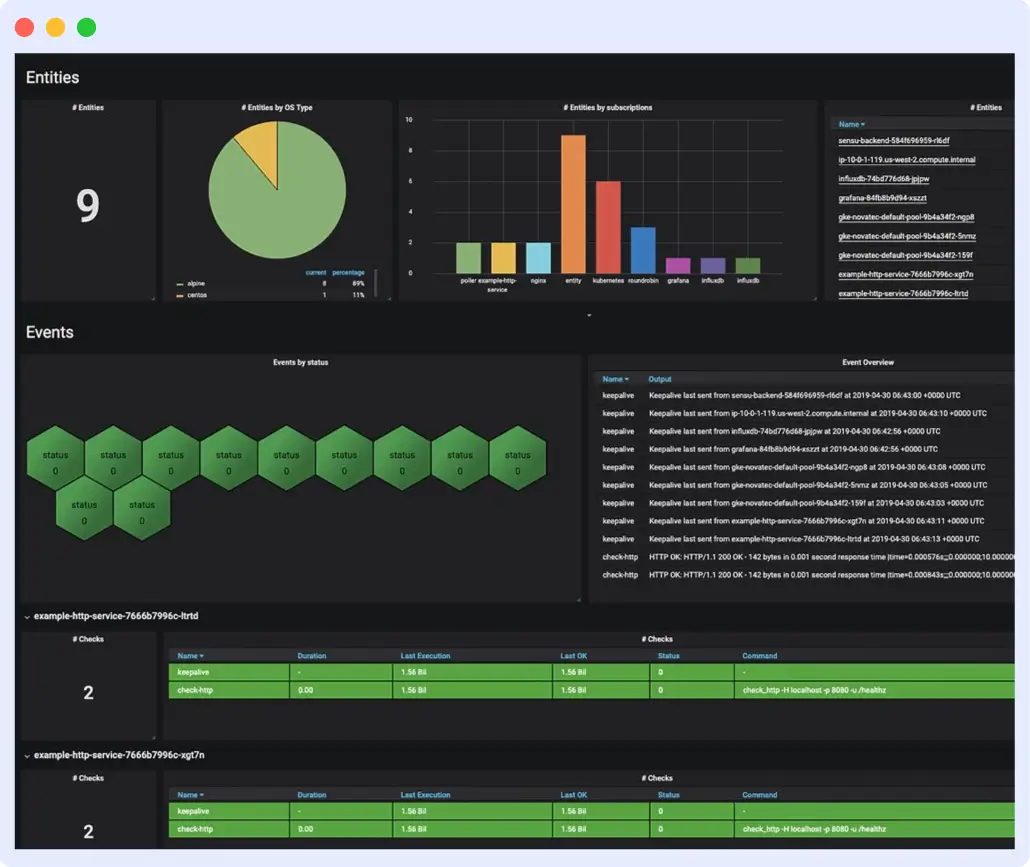
Prometheus is an open-source cloud monitoring tool built with a multi-dimensional data model that collects and stores time-series data and a flexible query language known as PromQL that helps in the real-time selection and aggregation of time-series data.
The tool effectively juxtaposes data from previous events with the system’s current situation. This helps you to understand the progress or otherwise of your Golang application’s performance. It also has a notification feature that sends alerts at important but critical events.
Key Features:
- Alertmanager for sophisticated notification rules
- PromQL querying for powerful time-series analysis
- Service discovery auto-detects Golang app endpoints
- Multi-dimensional metrics with labels for goroutines/CPU
Grafana
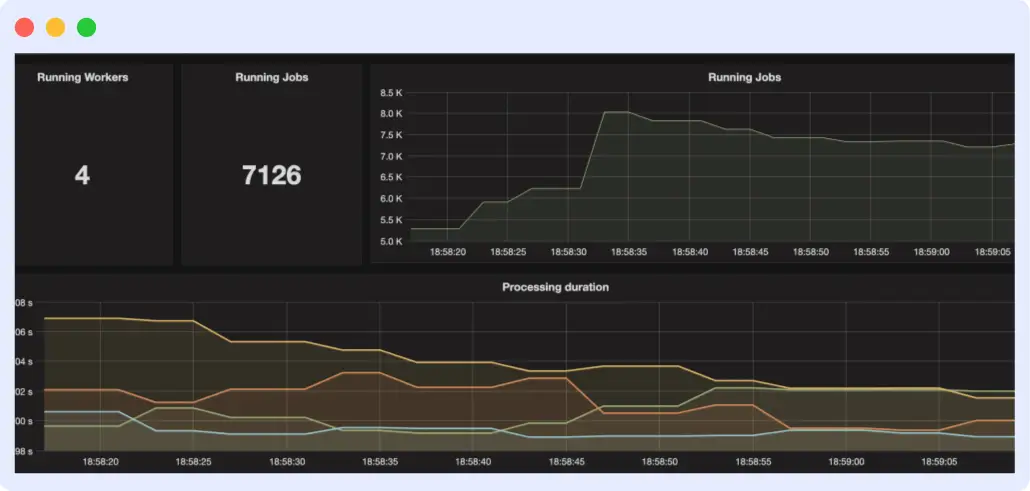
Grafana is a monitoring tool with great visualization and dashboarding features that display the performance or condition of your application in charts and graphs for easier interpretation and understanding. It runs data analytics on your Golang infrastructures and provides insight into the Golang environment and performance.
With Grafana, you can create visualizations, such as graphs, tables, and alerts, and organize them into dashboards to monitor and analyze real-time data. It also offers templating, annotations, and alerts to help users build complex, customized dashboards.
Key Features:
- Interactive dashboards with drag-and-drop panels
- Many data sources, including Prometheus for Golang
- Alerting engine with visual threshold rules
- Templating & annotations for dynamic Go metrics views
📊Compare Prometheus, Grafana & Middleware. See how Middleware complements open-source tools with AI-powered alerts, traces, and logs in one unified platform.
| Tool | Key Golang Features | Best For |
| Middleware | eBPF, time-series metrics, end-to-end traces, PromQL, alerts | Microservices |
| Prometheus | PromQL, time-series metrics | Open-source setups |
| Grafana | Dashboards, visualizations | Custom analytics |
Conclusion
For its speed, flexibility, and scalability, developers have migrated from other programming languages to Golang, an excellent language for building high-performance and scalable services. Although Golang provides various built-in tools and libraries for monitoring applications, such as profiling, tracing, and metrics collection, these tools do not possess end-to-end visibility features.
The monitoring ecosystem in Golang is continually evolving and expanding, with numerous open-source libraries and tools available to developers. Golang’s simplicity, concurrency support, and built-in garbage collector make it an excellent language for building microservices, which can be monitored and managed effectively using these monitoring tools.
Monitoring is essential to ensuring that Golang applications perform optimally and reliably. By leveraging the correct monitoring tools like Middleware, developers can gain insight into their applications’ behavior and quickly diagnose and resolve issues, improving their reliability and uptime.
Middleware provides detailed performance data through graphical, end-to-end visibility that helps you discover faults and provides information on what needs to be improved.
Ready to Monitor Go in Production?
Follow the official guide and instrument your Go services for real‑time insights.
👉 Configure Go APM
What are the key metrics to monitor in Golang applications?
Track CPU usage, memory allocation, goroutine count, request latency, error rates, and network I/O. These reveal bottlenecks, such as leaks or slow endpoints.
How do I instrument a Golang app for monitoring?
Use Prometheus client_golang for metrics export or OpenTelemetry for traces. Add import _ “net/http/pprof” for built-in profiling, then expose /metrics endpoint.
What's the difference between Prometheus and Middleware for Golang?
Prometheus excels at open-source metrics scraping, while Middleware adds eBPF-based APM, tracing, and alerts for end-to-end visibility without code changes.
Does Golang monitoring impact app performance?
Minimal overhead (1-5%) with optimized tools like eBPF. Prometheus adds ~2% CPU usage; auto-instrumentation keeps it under 1% in production.
How to set up alerting for Golang memory leaks?
Define thresholds in Prometheus Alertmanager (e.g., heap > 80%) or in Middleware dashboards. Integrate Slack/PagerDuty for instant notifications on goroutine spikes.