When it comes to cloud monitoring, Amazon CloudWatch has long been the primary tool for AWS users. However, users have consistently pointed out critical limitations, including fragmented log aggregation, static alerting thresholds, and restricted dashboard customization.
Real-world experiences highlight these challenges on forums and communities like Reddit. During a critical downtime event, one user found CloudWatch’s log views hindered root cause analysis. Another noted the platform’s inadequate graph templates and the necessity of external tools for multi-cloud environments.
These issues expose significant gaps in AWS CloudWatch’s capabilities, particularly for organizations managing hybrid and multi-cloud infrastructures. A more comprehensive solution offers unified observability, dynamic alerting, and advanced analytics.
This blog explores how an alternative approach can overcome CloudWatch’s limitations, empowering enterprises to navigate complex, distributed architectures more effectively.
Understanding AWS CloudWatch
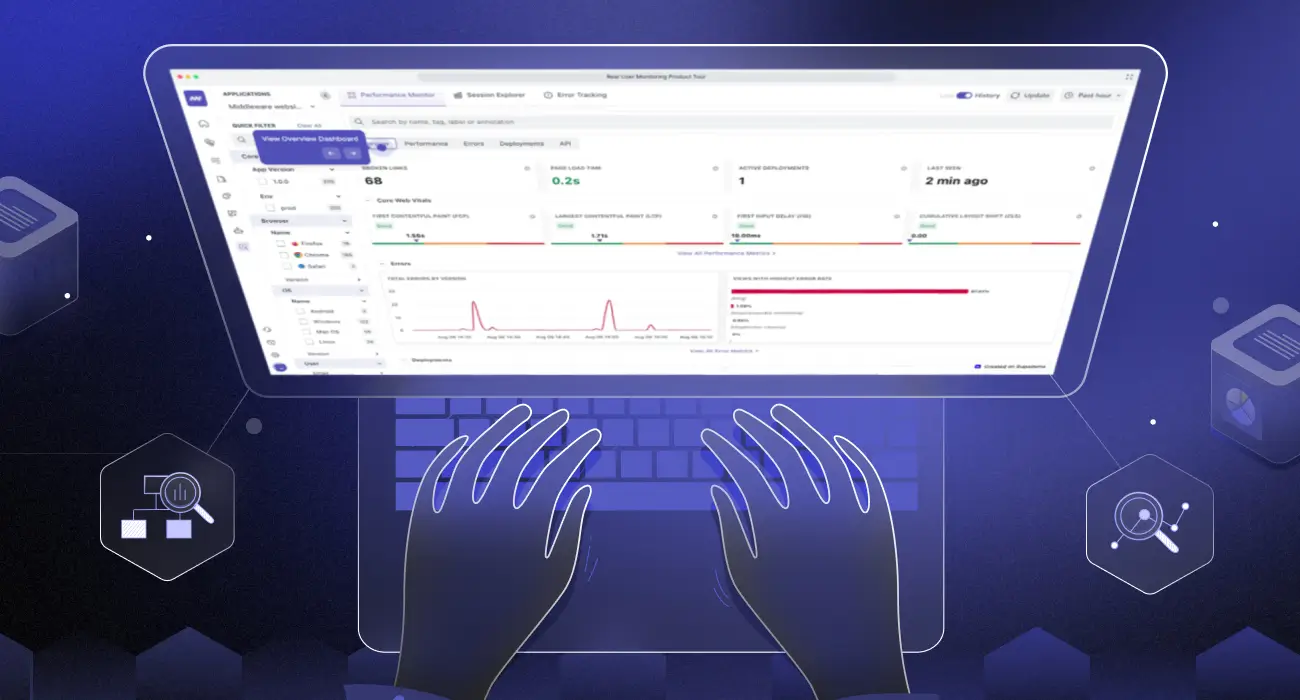
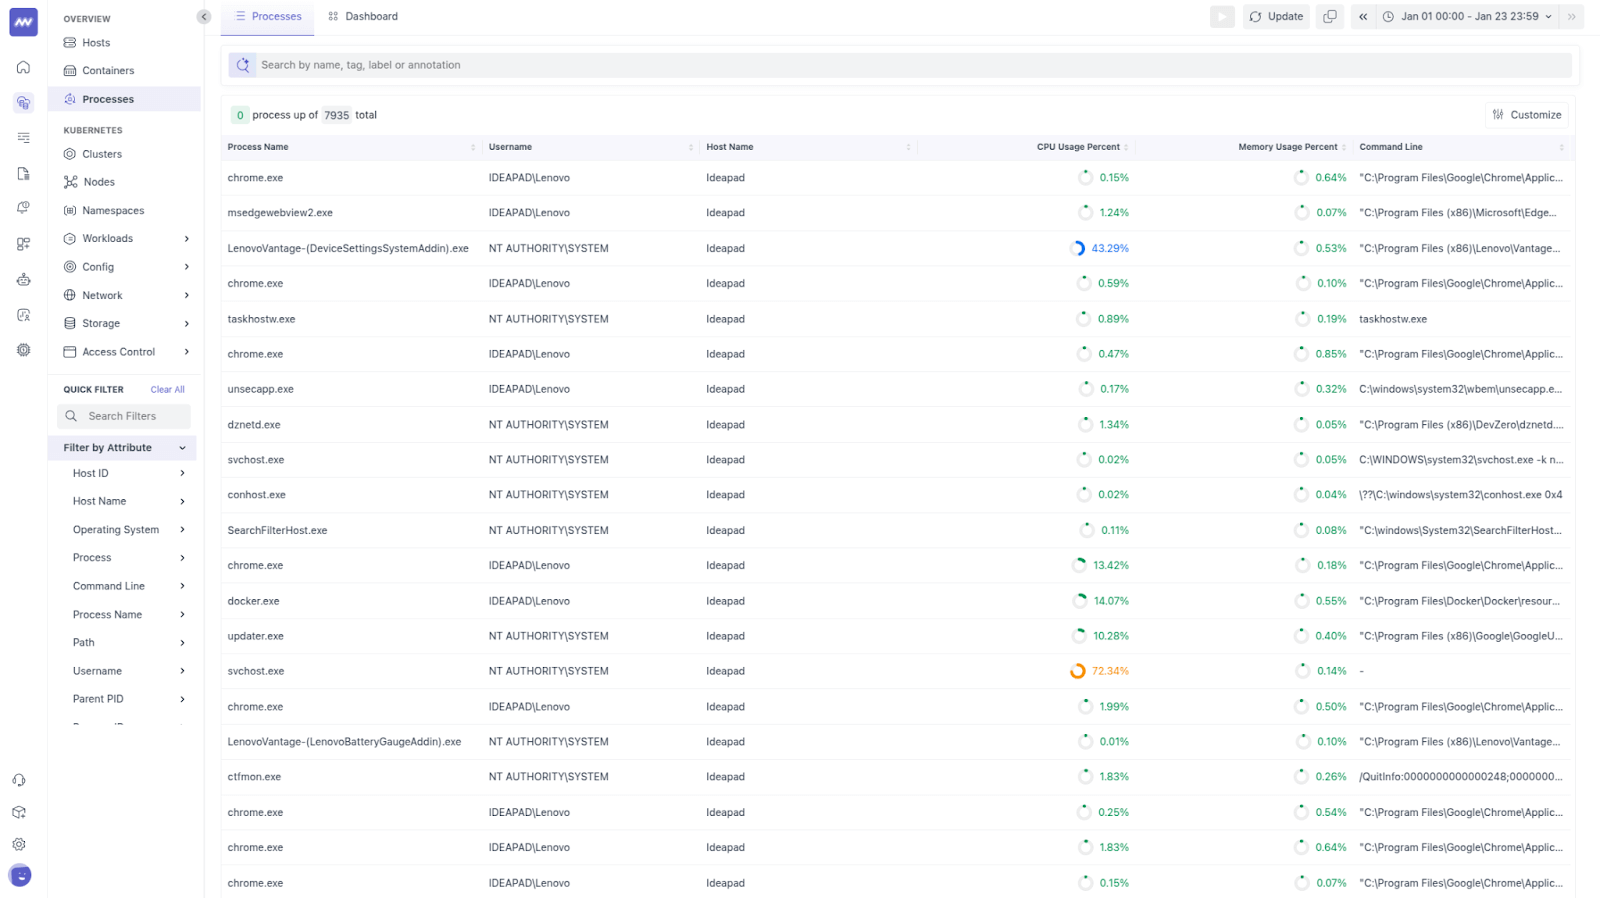
AWS CloudWatch is a monitoring and logging service for AWS resources and applications that provides real-time visibility into performance, infrastructure health, operations, and other systems.
Some of the benefits of using CloudWatch include:
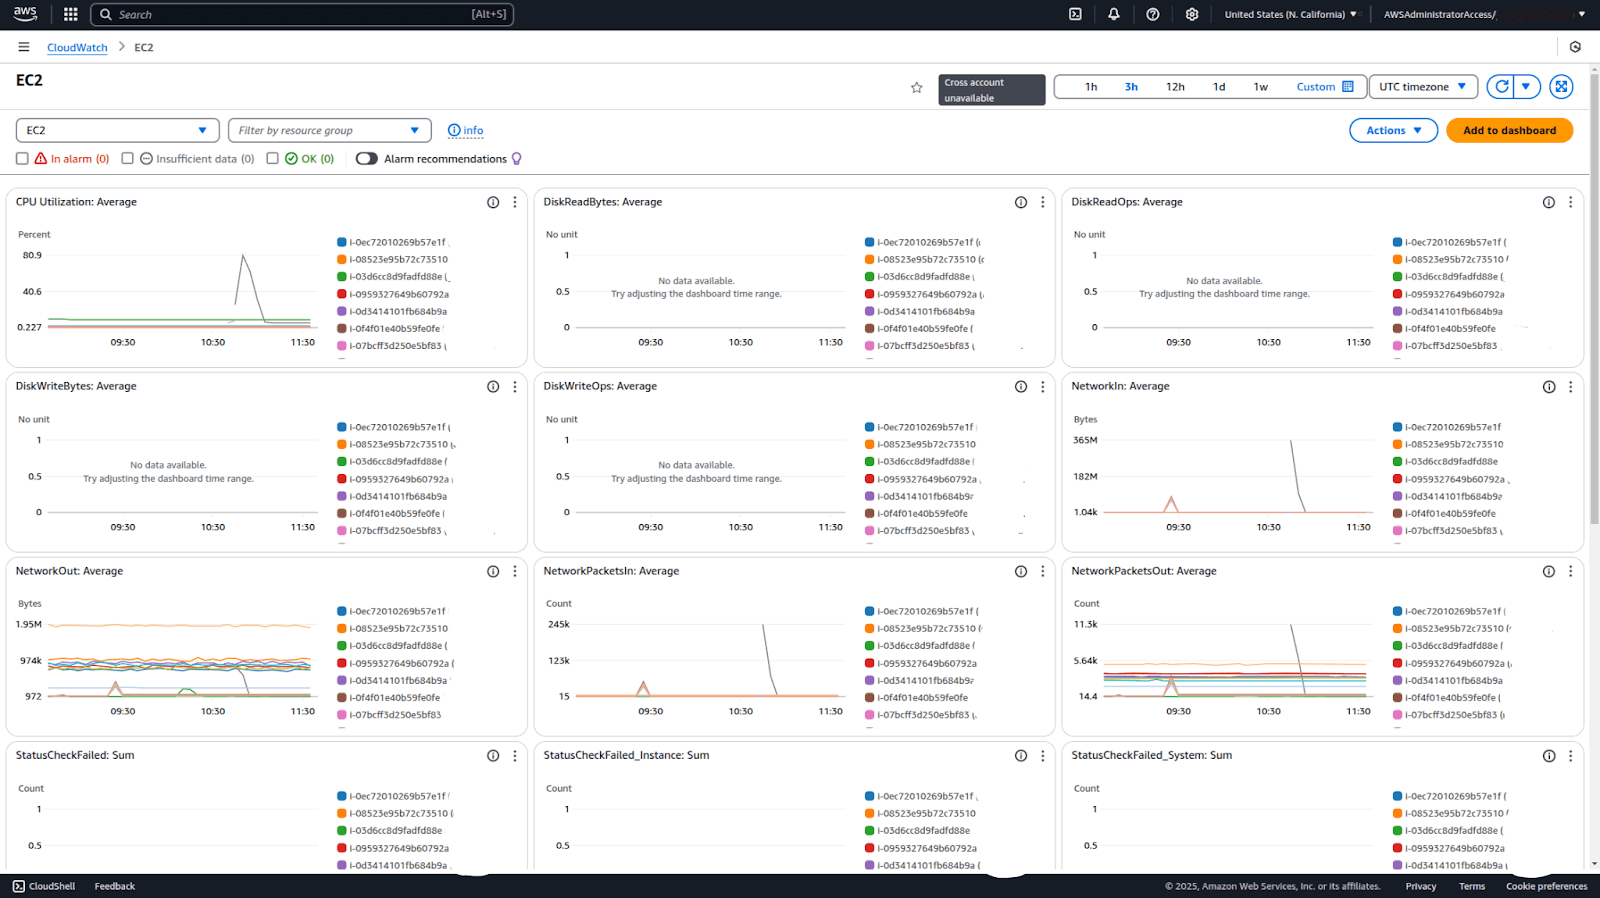
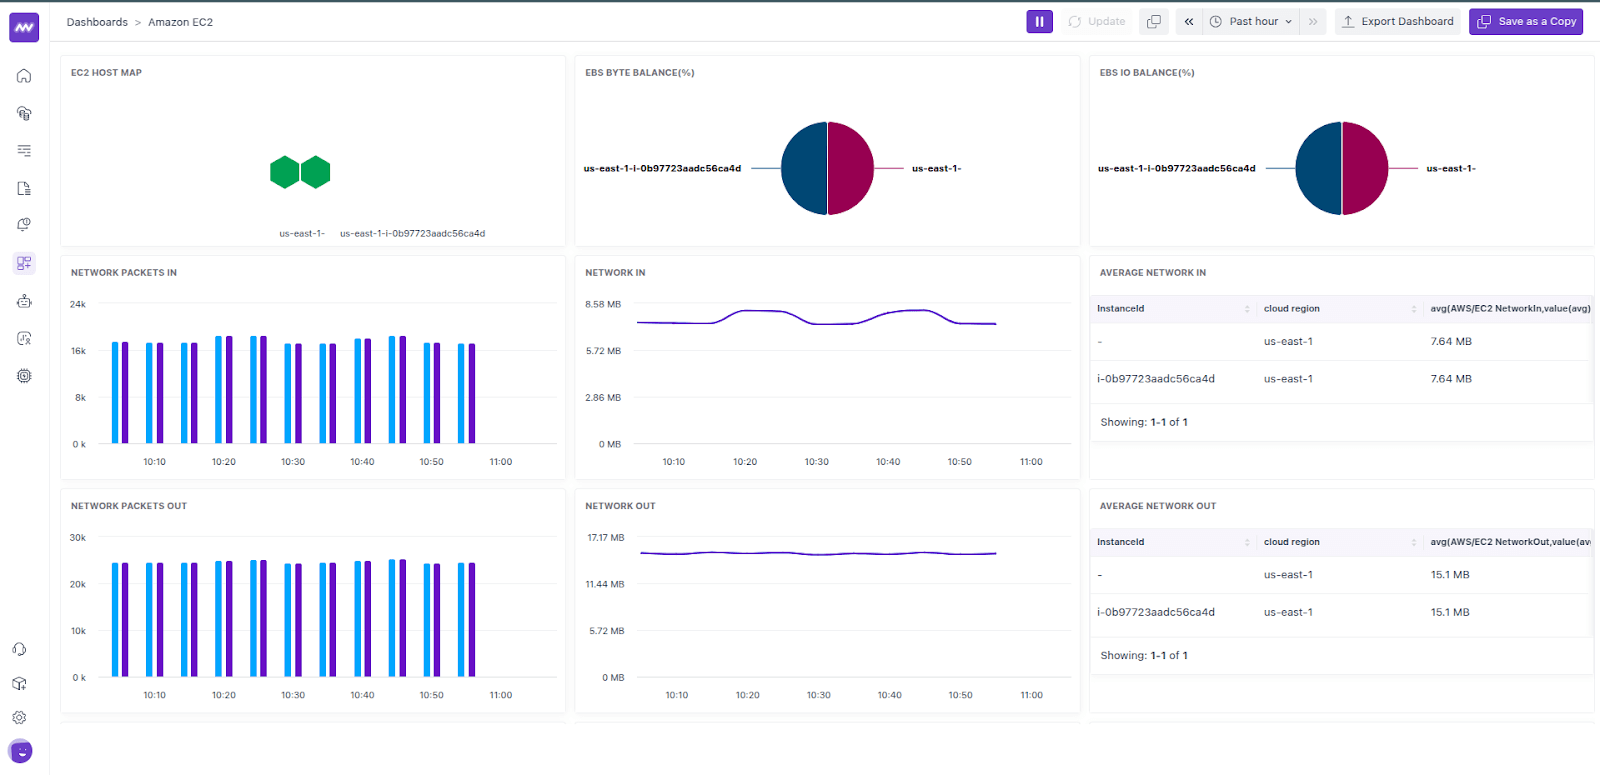
- Comprehensive monitoring: CloudWatch tracks everything happening in your AWS setup, from EC2 servers spinning up and down to database performance, S3 storage loads, and Lambda function triggers. It’s like having a mission control dashboard that gives teams real-time visibility into how the entire cloud ecosystem is breathing and moving.
- Event-driven automation: Integrates with AWS Lambda for automated responses to operational events, such as triggering remediation functions when alarms are raised.
- Custom metrics: Supports user-defined metrics for monitoring and alerting.
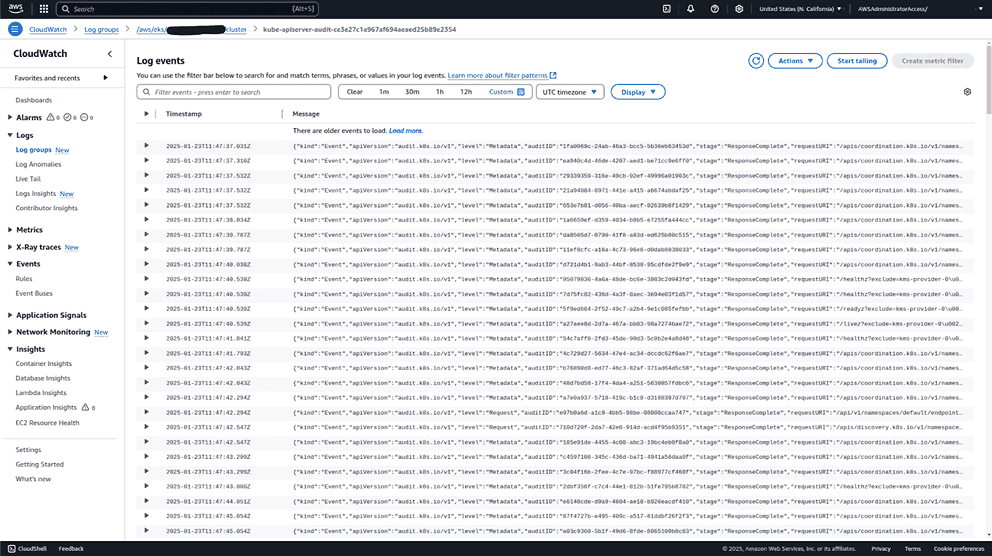
- Log Insights: Facilitates real-time log querying and analysis for troubleshooting.
- Dashboards and alerts: Provides tools to create detailed dashboards and set up alerts to track system health and usage patterns.
- Auto-scaling support: Dynamically adjusts resource allocation based on usage metrics to handle fluctuating workloads.
- Integration with AWS X-Ray: Works with AWS X-Ray for debugging and visualizing application request flows.
Despite its comprehensive feature set, CloudWatch has limitations in complex or multi-cloud setups:
- Static threshold alerts: Manually configured thresholds can miss anomalies or generate false positives in dynamic environments.
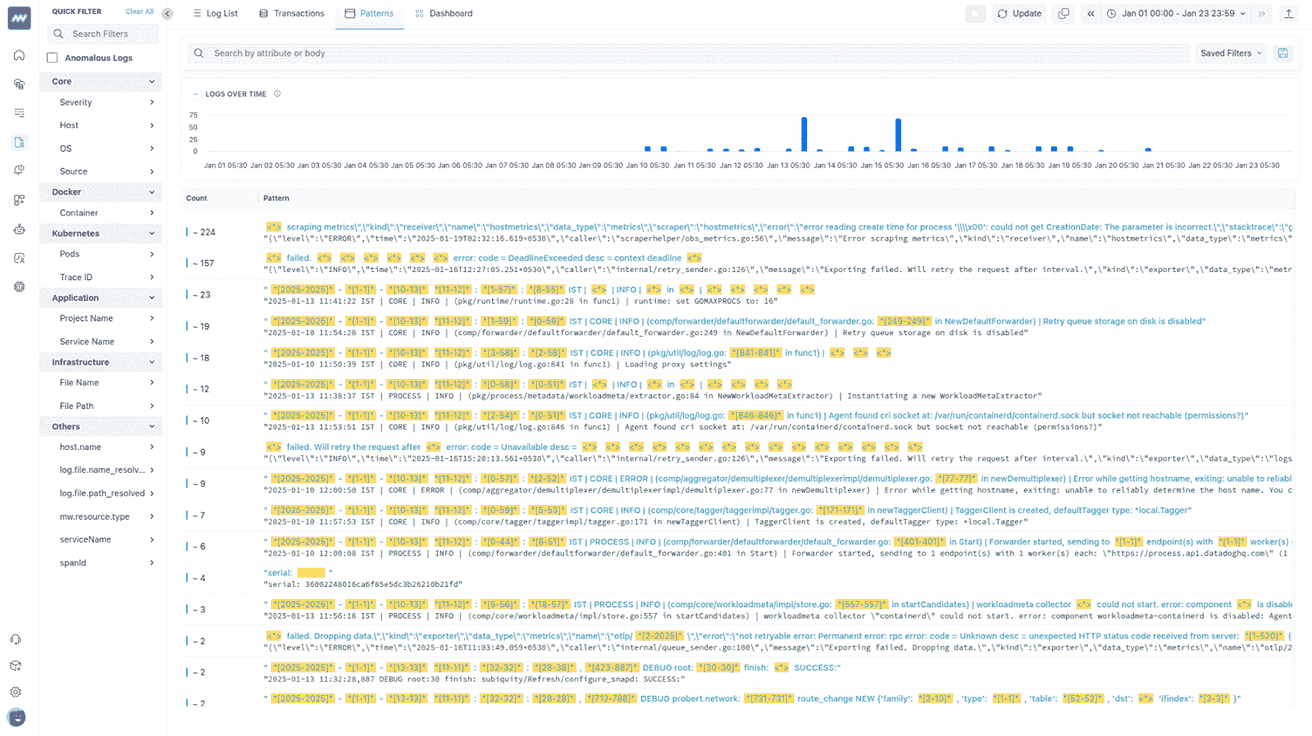
- Fragmented logging: Logs are scattered across views, requiring manual correlation, which slows root cause analysis.
- AWS-centric design: Lacks native support for multi-cloud or hybrid environments, making it less versatile for diverse platforms.
- Limited visualization: Dashboards are functional but lack flexibility compared to specialized tools.
- Cost challenges: Analyzing extensive log data can be expensive, especially for large-scale deployments.
While necessary for AWS monitoring, CloudWatch’s constraints underscore the need for more versatile multi-cloud and hybrid environment solutions.
Why Middleware outperforms CloudWatch
Middleware addresses the limitations of AWS CloudWatch and offers advanced capabilities that make monitoring more efficient, especially in multi-cloud and hybrid environments. Key features include:
1. Cross-platform monitoring
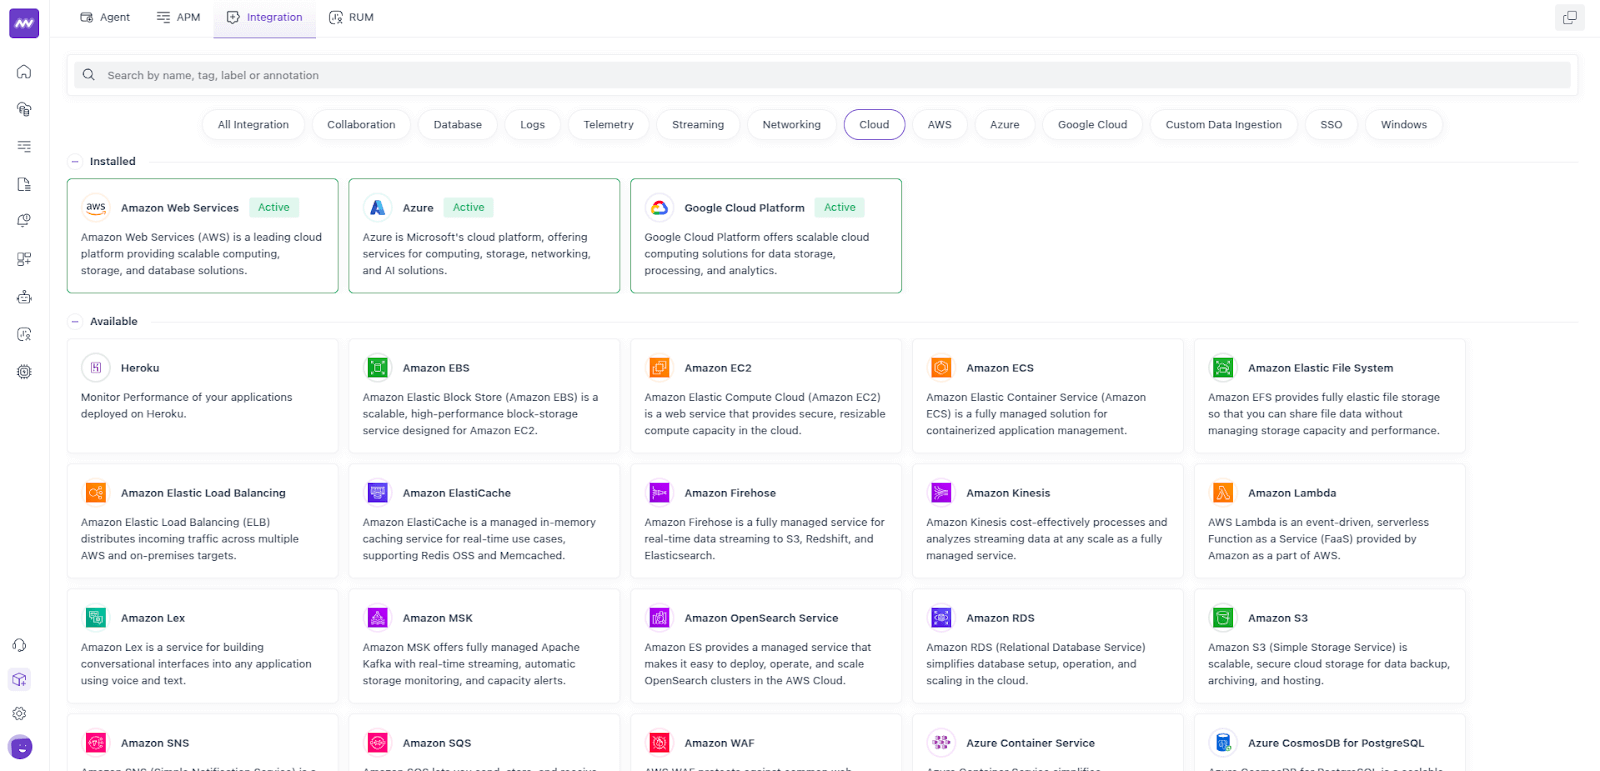
Middleware provides observability across AWS, Azure, GCP, and on-prem systems, eliminating the silos present in CloudWatch, which is limited to AWS environments.
It enables easy tracking of workloads across AWS Lambda, Google Cloud Functions, and on-prem Kubernetes clusters, offering a single-pane-of-glass view for all CloudWatch metrics.
2. Dynamic alerts with predictive analytics
Unlike CloudWatch’s static thresholds, Middleware’s AI-driven alerts adapt to changing trends, reducing false positives and providing more accurate notifications.
As per the Middleware Generation e-sports; it detected a sharp increase in latency during a gaming event, prompting proactive scaling and preventing server crashes, ensuring an easy user experience.
3. Advanced logs and traces
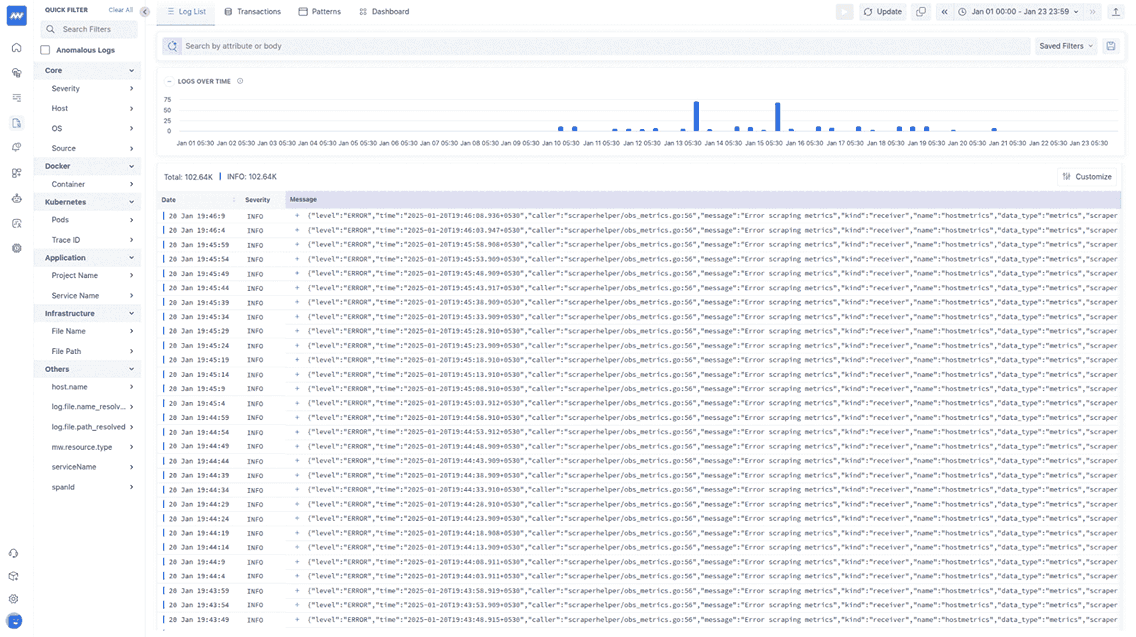
By combining logs, metrics, and traces in a single view, Middleware accelerates root cause analysis and troubleshooting across distributed systems.
Middleware pinpointed a bottleneck in Kubernetes workloads where a misconfigured pod disrupted service communication. By correlating logs and traces in real time, the issue was resolved within minutes.
4. Customizable dashboards
Middleware offers tailored dashboards that allow teams to monitor specific metrics, like database health and service dependencies, without the rigidity of CloudWatch’s predefined templates.
5. Proactive scaling and resource optimization
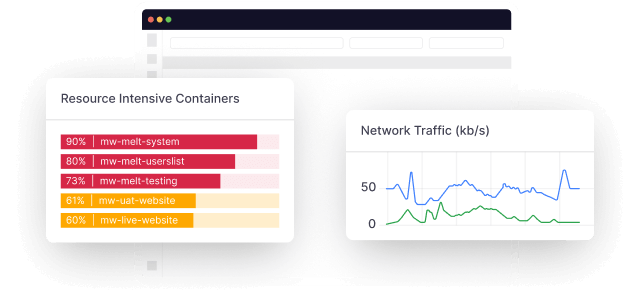
Middleware analyzes usage patterns and recommends scaling adjustments, optimizing resource allocation based on demand fluctuations.
Middleware and AWS CloudWatch integration
Middleware expands CloudWatch’s capabilities by addressing its limitations and enabling advanced observability for multi-cloud and hybrid environments. With AWS CloudWatch integration, it enhances its functionality.
Key integrations include:
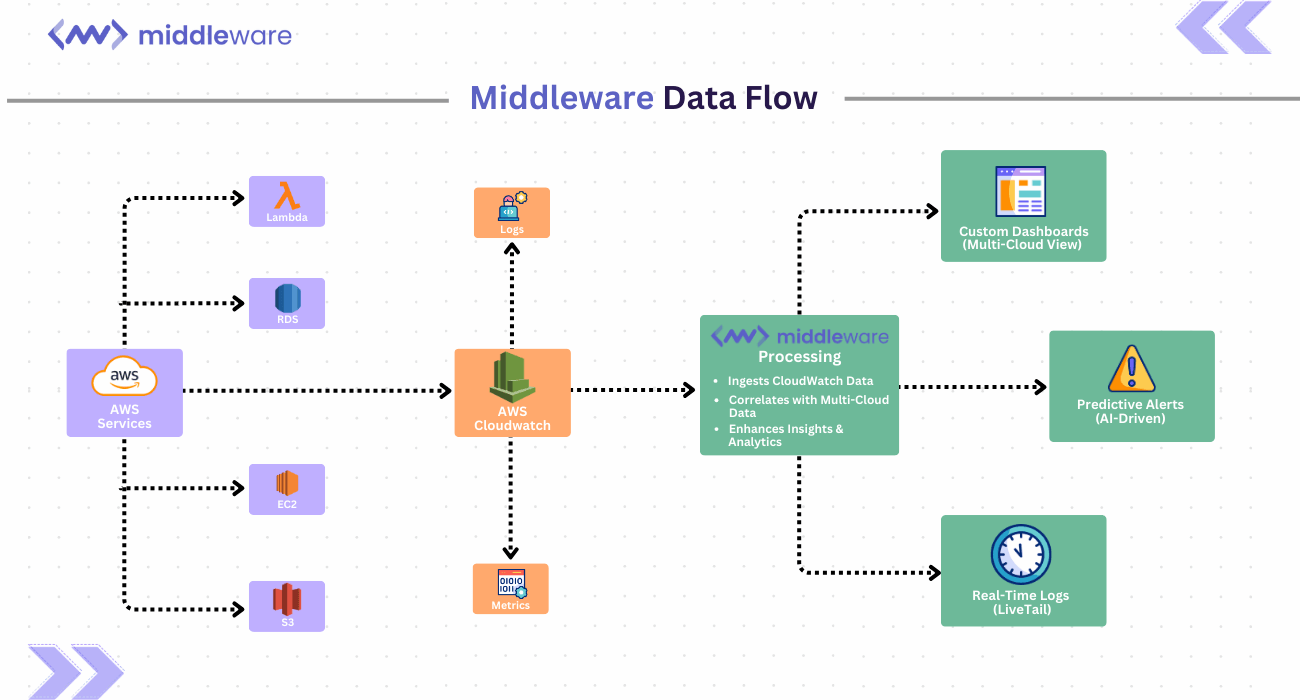
- Unified analytics: Metrics from CloudWatch are combined with data from Azure, GCP, and on-prem systems, offering a single, comprehensive view of performance across platforms.
- Cross-platform correlation: Bridges data from AWS CloudWatch and other sources, enabling developer teams to identify dependencies and resolve issues that span multiple services and architectures.
- Real-time log management: LiveTail provides real-time log streaming, filtering, and correlation, accelerating root cause analysis and reducing downtime during incidents.
This integration allows developers to continue using CloudWatch’s native metrics while gaining advanced features like predictive analytics and unified monitoring. By improving efficiency and reducing operational costs, it simplifies the management of complex, distributed systems.
How to make CloudWatch logs better
Enhancing AWS CloudWatch logs involves implementing best practices to improve log management, analysis, and monitoring. Here are some strategies to optimize your CloudWatch logs:
- Implement structured logging
Use consistent log formats (e.g., JSON) to facilitate easier parsing and analysis.
- Set appropriate log levels
Combines logs from CloudWatch and other sources, providing a full-stack view that connects application errors to infrastructure changes.
- Define log retention policies
Establish clear retention policies to manage storage costs and comply with data governance requirements.
- Implement security measures
Apply appropriate access controls and encryption to protect sensitive log data.
- Create Log Hierarchies
Organize logs into hierarchies or groups based on the AWS service, application, or resource generating the logs to simplify management.
- Monitor and Alert on Logs
Use CloudWatch Alarms to monitor log data for specific events or patterns and configure alarms to trigger notifications when predefined conditions are met.
- Regularly Review and Analyze Logs
Frequently review log data to identify anomalies, errors, and potential security threats.
By integrating with AWS CloudWatch unlocks advanced capabilities such as real-time monitoring, better root cause analysis, and enhanced visibility across distributed systems, making AWS CloudWatch far more effective for modern environments.
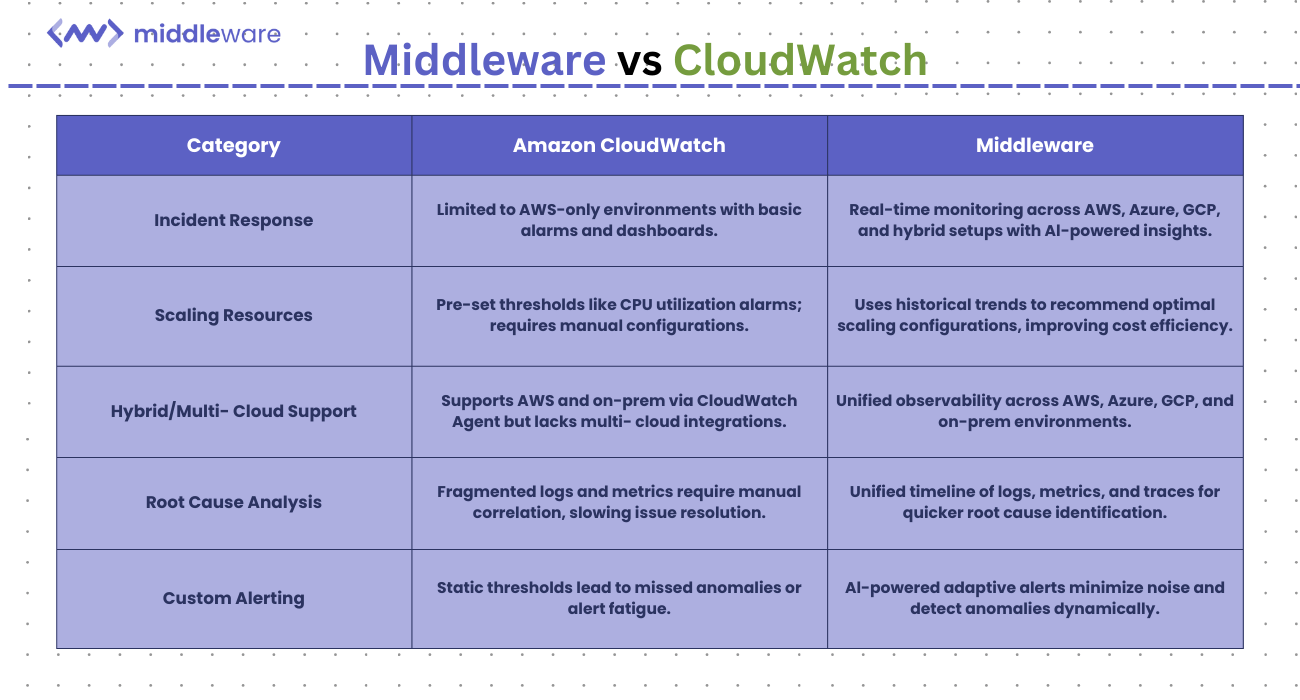
Middleware vs. CloudWatch
- Incident response
- Amazon CloudWatch: Focuses on AWS alarms and dashboards, limiting visibility to AWS-only environments. This solution delivers operational insights about application and resource health to optimize system performance together with resource utilization.
- Middleware: AI-tech capabilities deliver automated insights during real-time monitoring which helps identify and solve issues more rapidly across AWS, Azure, GCP and hybrid platforms.
- Scaling resources
- Amazon CloudWatch: Monitors metrics and triggers auto-scaling actions based on pre-set thresholds, including CPU utilization. Setting alarms that trigger notifications when CPU utilization exceeds specified thresholds, such as 80%, is necessary for efficient resource management.
- Middleware: Recommends optimal scaling configurations based on historical workload trends, improving efficiency and cost management across cloud platforms.
- Hybrid and multi-cloud monitoring
- Amazon CloudWatch: Supports AWS and on-prem monitoring through the CloudWatch Agent but lacks effective multi-cloud integrations.
- Middleware: Offers unified observability across AWS, Azure, GCP, and on-prem environments, enabling consistent monitoring in complex architectures.
- Root cause analysis
- Amazon CloudWatch: Fragmented logs and metrics make correlation between services manual and time-consuming.
- Middleware: Aggregates system events, performance metrics, and telemetry into a unified timeline, enabling faster root cause analysis and quicker issue resolution.
- Custom alerting
- Amazon CloudWatch: Static thresholds often result in missed anomalies or excessive false positives, leading to inefficiencies and alert fatigue.
- Middleware: AI-driven adaptive alerts dynamically adjust based on usage patterns, minimizing noise and improving response times.
Best practices for monitoring with Middleware
To maximize the benefits of Middleware’s advanced monitoring capabilities, developers should adopt these AWS best practices:
- Define Clear Monitoring Objectives –Establish specific goals for your monitoring efforts to ensure alignment with organizational objectives and to focus on critical performance indicators.
- Select Appropriate Monitoring Tools – Choose tools that integrate seamlessly with your existing infrastructure and provide the necessary features to meet your monitoring needs.
- Regular Performance Reviews – Optimize resource utilization and system health by analyzing historical data trends. Quarterly reviews help refine scaling strategies and improve efficiency.
- Implement Distributed Tracing – Utilize distributed tracing to track requests across multiple services, facilitating end-to-end visibility and simplifying root cause analysis.
- Monitor End-to-End – Ensure comprehensive monitoring from infrastructure to applications and user behaviors to gain a holistic view of system performance.
- Adopt Continuous Optimization – Regularly review and refine your monitoring strategy to adapt to evolving systems and requirements, ensuring sustained effectiveness.
- Automate Monitoring Tasks – Leverage automation to streamline monitoring processes, reduce manual errors, and improve response times to incidents.
Conclusion
CloudWatch is effective for AWS-centric workloads but lacks capabilities like multi-cloud visibility and adaptive alerting. Middleware bridges these gaps with features like predictive analytics, cross-platform monitoring, and custom dashboards, enabling teams to resolve incidents faster and optimize resource usage across hybrid environments.
Adopting a more powerful and multi-cloud observability platform ensures your monitoring strategy is ready for evolving cloud challenges, providing enhanced reliability and performance.
Ready to elevate your cloud monitoring strategy? Explore Middleware’s features and see how it can transform your monitoring approach for modern cloud ecosystems.
FAQ
How does Middleware improve CloudWatch monitoring for multi-cloud environments?
Middleware integrates AWS CloudWatch metrics with platforms like GCP and Azure, providing unified observability for hybrid and multi-cloud environments to detect and resolve issues efficiently.
What is CloudWatch vs CloudTrail?
Amazon CloudWatch and AWS CloudTrail serve different purposes:
- AWS CloudWatch: The system collects real-time metrics and events from AWS resources along with generating logs. The platform supports both performance monitoring and warning alert generation through its alarm system and provides resource utilization tracking capabilities.
When EC2 CPU usage reaches predetermined thresholds the system will issue warning alerts through alarms. - CloudTrail: AWS CloudTrail Logs tracks and logs API activity for auditing and compliance. It provides visibility into changes made to AWS resources.
Record when a policy change is made to an S3 bucket, logging the user, API call, and time.
In short, CloudWatch manages performance and metrics, while CloudTrail handles logging and governance.
How does Middleware compare to AWS CloudWatch for multi-cloud monitoring?
CloudWatch monitors AWS-native services but lacks multi-cloud support. Middleware integrates data from multiple platforms, correlating metrics and logs across environments with advanced AI-driven insights.
What are the limitations of CloudWatch compared to Middleware?
AWS CloudWatch lacks predictive analytics, dynamic alerting, and multi-platform visibility. Middleware fills these gaps with AI-powered insights, advanced dashboards, and unified observability.
Can Middleware enhance database monitoring beyond CloudWatch's capabilities?
Yes, Middleware provides deeper insights for databases like RDS and MySQL, including query performance, connection health, and resource utilization, exceeding AWS CloudWatch’s capabilities.