
A strong business is built on a solid foundation, and that starts with Infrastructure. Unexpected outages can lead to major losses, but proactive Infrastructure Health Monitoring helps detect and fix issues before they impact users.
Recent data shows that the average cost of a single hour of downtime now exceeds $300,000 for over 90% of mid-size and large enterprises. Some companies in the Global 2000 incur annual total downtime costs of up to $400B.
But what if you could detect and resolve issues before they become problems? You don’t have to wait for systems to break; this approach focuses on identifying early warning signs and addressing them before they escalate into outages.
This post shows how Middleware’s unified observability platform helps you build a proactive monitoring strategy that keeps systems running smoothly.
📊For a detailed explanation of monitoring concepts and why they matter, check out What is Infrastructure Monitoring?
Understanding Proactive Infrastructure Health Monitoring
For years, most IT and DevOps teams operated under a reactive “break-fix” approach, basically waiting for things to break before jumping into action. Sure, this method solved immediate problems, but it often meant dealing with more extended periods of downtime and the issues that come with them.
⚡To understand how a proactive approach prevents downtime and improves user experience, see Why Businesses Need Proactive Monitoring.
Now, with proactive infrastructure health monitoring, you can continuously collect and analyze system data to detect early warning signals and take action before they affect your users, rather than when the system goes down.
This includes monitoring:
- Metrics: CPU, memory, network, throughput and latency.
- Logs: System and application logs that reveal surface errors or abnormal activity.
- Traces: Request flow through services.
- Anomalies: Data patterns signaling potential issues.
- Alerts: Smart notifications based on thresholds or detected anomalies.
- Availability & Performance: Synthetic tests that mimic real user behavior.
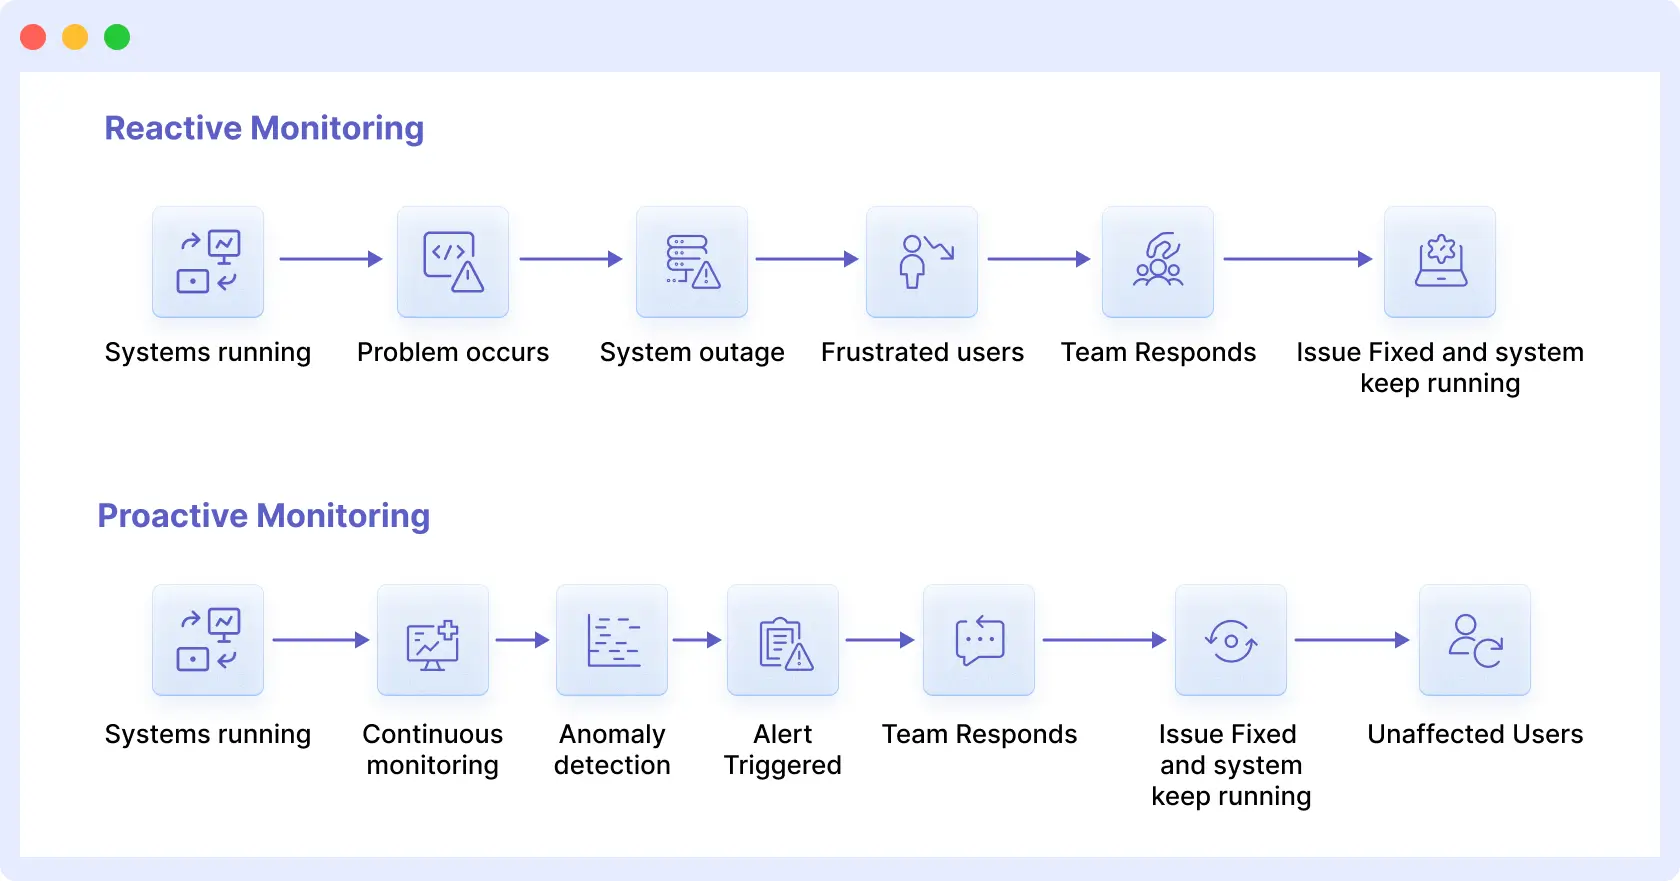
By combining these signals, proactive monitoring would provide teams with complete visibility into the system’s health. You can now respond to an outage rather than plan for it, addressing and fixing weak points early and quickly, and keeping your infrastructure ready.
Setting Up Middleware for Proactive Infrastructure Health Monitoring
Setting up Middleware is pretty straightforward, and you’ll start seeing insights into your environment almost immediately. The setup involves several key actions that’ll get you from zero to full monitoring coverage.
1. Create Your Account and Configure the Basics
Sign up for a Middleware account and handle the initial setup. Set your organizational preferences, create your teams, and ensure role-based access is configured correctly so the right people see the right insights.
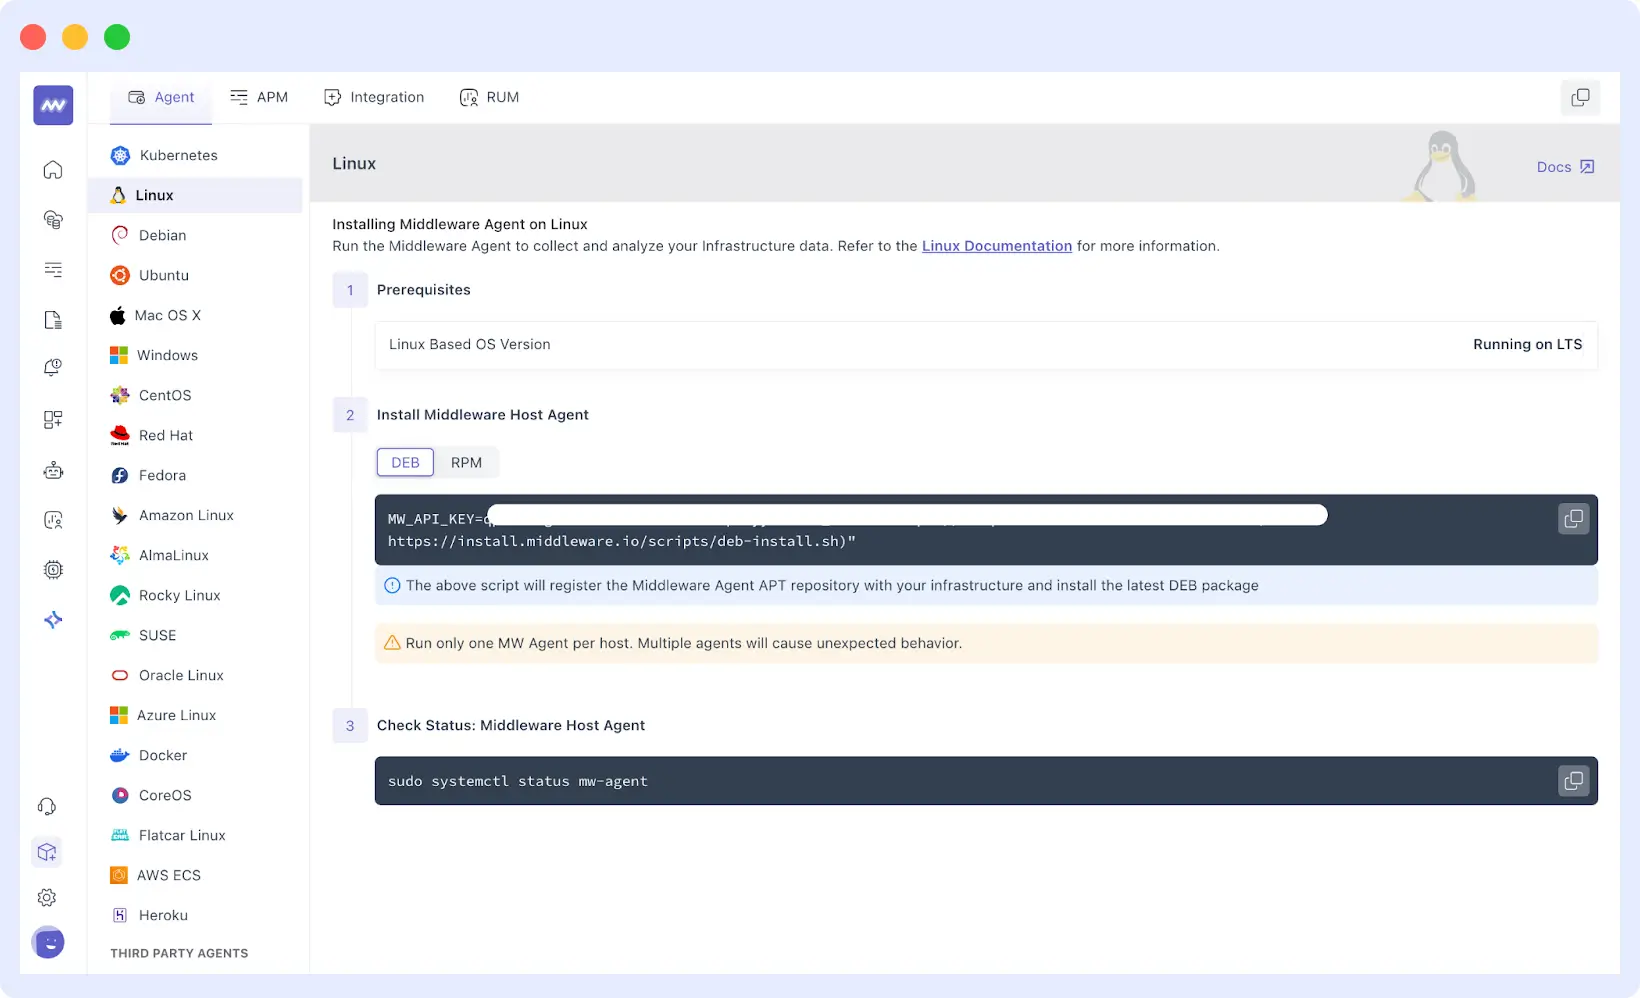
2. Installing the Middleware Agent
The first step in using Middleware for infrastructure health monitoring is installing its lightweight Infra Agent. The agent runs in the background, collecting host-level metrics and forwarding them to the Middleware backend for analysis and visualization.
🛠️ Consolidate metrics, logs, and traces in one view to simplify monitoring and troubleshoot faster: Why Teams are Replacing Multiple Tools
2.1 Linux and Windows Hosts
You’ll start by generating an installation command right from the Middleware dashboard. The platform is intuitive about this. It’ll provide you with scripts explicitly tailored to the operating system you’re working with.
If you’re running Linux or any of its distributions, such as Debian, Ubuntu, Red Hat, or Fedora, you’re provided with a single-line script that handles everything. It registers your host with your account and sets up the agent to run as a service without manual configuration.
Windows is also compatible, and it has an installer compatible with Windows 10, Windows 11, and Windows Server editions. The agent can be installed using a basic setup wizard or PowerShell. It runs in the background and starts recording host-level metrics, such as Linux.
2.2 Kubernetes Clusters
For Kubernetes setups, the agent can be deployed using either a Helm chart or a Bash script, depending on your workflow. The agent runs as a DaemonSet, which is helpful because it automatically ensures every node in your cluster gets covered.
This groundwork sets you up perfectly to start collecting metrics across your entire cluster once monitoring kicks in.
2.3 Verifying Installation
Once the systems are installed, you can verify that they are reporting data by visiting the Infrastructure tab of the Middleware dashboard. All registered hosts or nodes are displayed, along with their initial set of metrics.
3. Connecting Infrastructure and Services
After you’ve installed the agent, you’ll integrate your entire infrastructure and services with Middleware. Then it takes it a step further by providing monitoring for all your hosts, allowing you to view the health of your cloud resources, databases, load balancers, and other managed services alongside your server metrics.
🔍 Get full visibility into server metrics and troubleshoot faster using Server Health Monitoring.
In Integrations from the Middleware, there are methods for linking environments such as AWS, Azure, and the Google Cloud Platform. These are done with secured access to the API.
Indicatively, linking an AWS account can enable Middleware to automatically pull measurements for services such as EC2, RDS, EKS, and Elastic Load Balancers. Similarly, joining Azure or GCP accounts enables pulling telemetry from virtual machines, databases, and container services deployed in those environments.
Hybrid infrastructures are also managed. You are provided with a single view of the physical and on-site virtual machines, as well as the cloud’s resources, and receive a summary of the entire infrastructure’s performance. With this, you can monitor issues across multiple infrastructures without switching between monitoring utilities.
When you network services together, their information feeds into the platform, along with the metrics your agents are gathering. There’s a list of your machines, clusters, and services under Infrastructure, where you can browse and view their performance in real-time.
4. Real-Time Infrastructure Visibility
After installing agents and integrations, Middleware starts sending real-time performance data of your infrastructure. The most essential system resources —CPU usage, memory consumption, disk I/O, and network throughput —are continuously measured and sampled.
These form your baseline metrics, based on which you measure the performance of your infrastructure under average and peak conditions.
In the Infrastructure view, hosts or nodes are displayed with real-time utilization and health. Middleware continuously updates this data, allowing you to identify performance bottlenecks as they develop.
For example, a persistent disk latency problem on a host or database node becomes evident within seconds.
Because the data originates from sources surveyed by the agents themselves, there is no latency between the system’s state and what’s displayed on the dashboard.
With this real-time perspective, teams can immediately respond by increasing resources, restarting the service, or gaining insight into the nature of network congestion.
5. Container and Kubernetes Monitoring
When you install the Infra Agent, Middleware also covers physical and virtual hosts, as well as containerized workloads. In Docker setups, the agent automatically detects active and running containers and begins capturing metrics such as memory and CPU usage, as well as network traffic, at both the host and container levels, giving you deep insights into container performance (learn more about Container Monitoring)
This provides a great insight into how individual containers are performing and their impact on the underlying system.
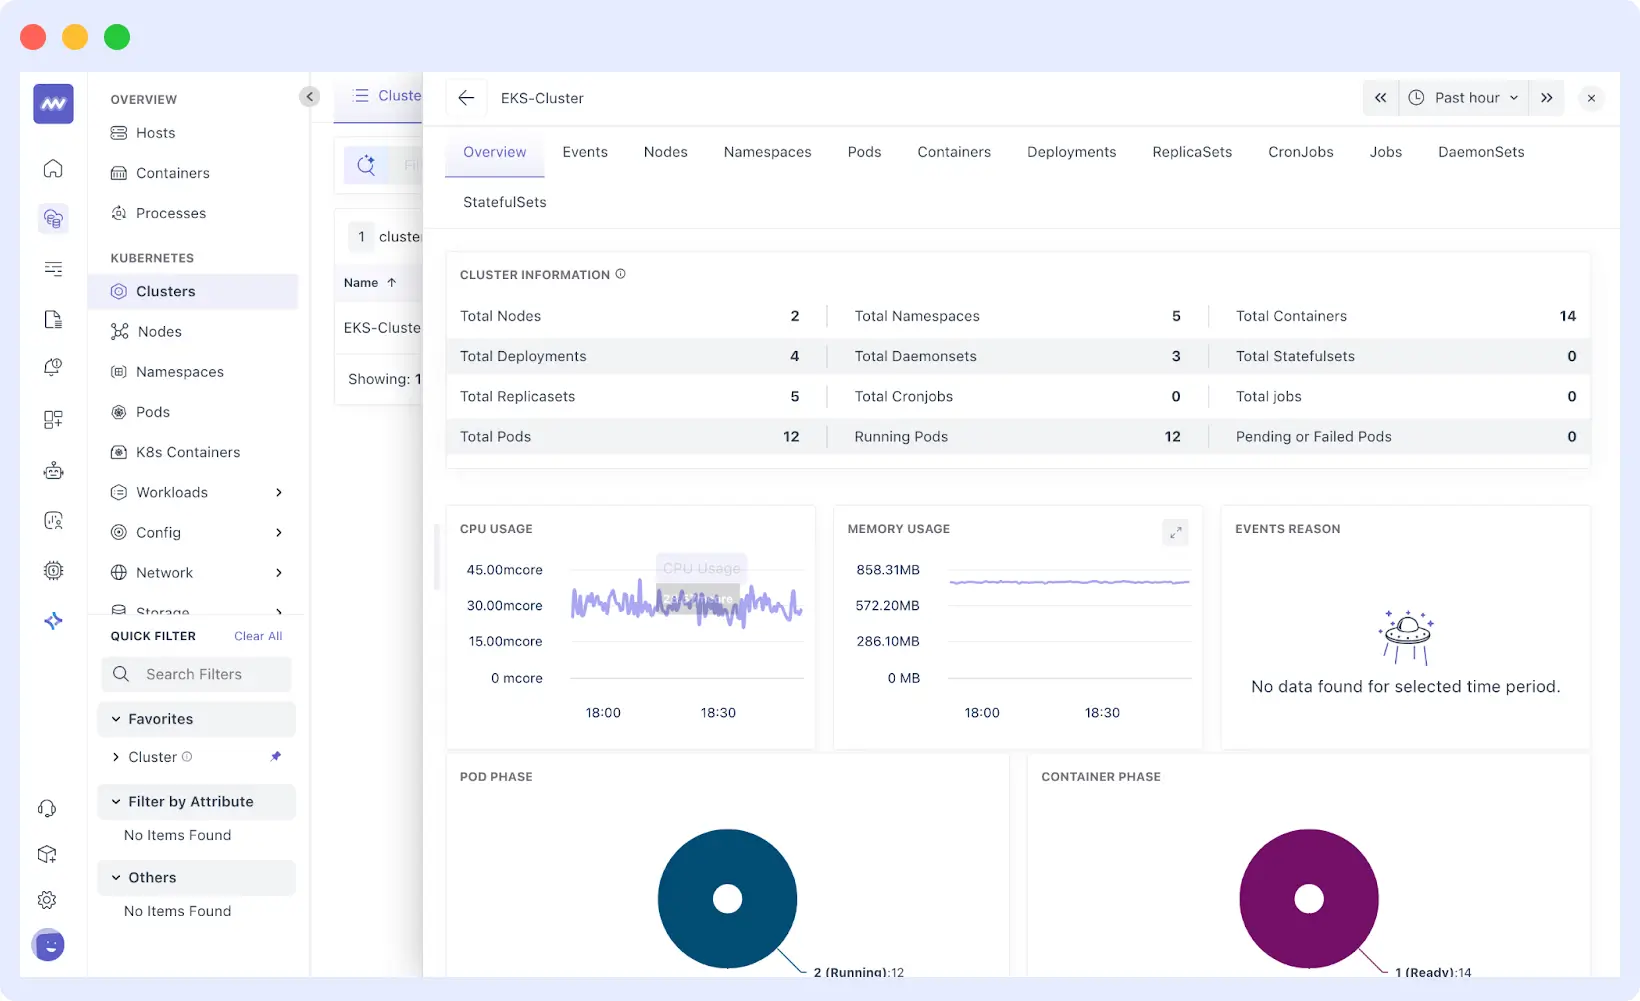
In Kubernetes, Middleware provides cluster-wide visibility. Since the agent runs as a DaemonSet across all nodes, it can continuously monitor metrics across the entire cluster, including node health, pod-level resource usage, and workload performance.
- Node monitoring: health and performance of each node in the cluster.
- Pod-level information: resource usage, restarts, and pod lifecycle.
- Workload visibility: deployments, services, and cluster health status.
The Middleware dashboard consolidates these details into a single page from which you can instantly backtrace problems from a recalcitrant pod back through the node it resides on, or from cluster-wide oddities down through a single container.
🔗 Related Reads:
Monitoring Kubernetes Applications – Best practices for app-level monitoring
Common Kubernetes Errors – Troubleshoot your clusters efficiently
6. Customizable Dashboards with Filtering and Drill-Downs
Once your agents are in place and they start gathering information, one of the priorities is to create useful dashboards. The middleware dashboard builder enables you to create your own visualizations using a variety of visual elements, each of which can display multiple metrics across various graph types.
You can use your dashboard to build just by clicking on the Dashboard Builder and assigning a name and description to your first report. Arranging information in a logical manner is key to the process and to answering your team’s most urgent questions.
Each and every widget can be customized; it can be resized, dragged, and moved around. Hovering over a widget displays edit options, allowing you to make simple changes without recreating the entire dashboard.
Middleware offers a wide range of visualization capabilities to meet various analytical requirements.
- Time series for tracking trends over time.
- Bar charts for easy comparisons.
- List views for tabular data.
- Count widgets for displaying resource totals.
- Pie charts for percentage breakdowns.
You can apply multiple filters to create precise data views, allowing you to focus on specific resources, such as hosts, namespaces, or nodes.
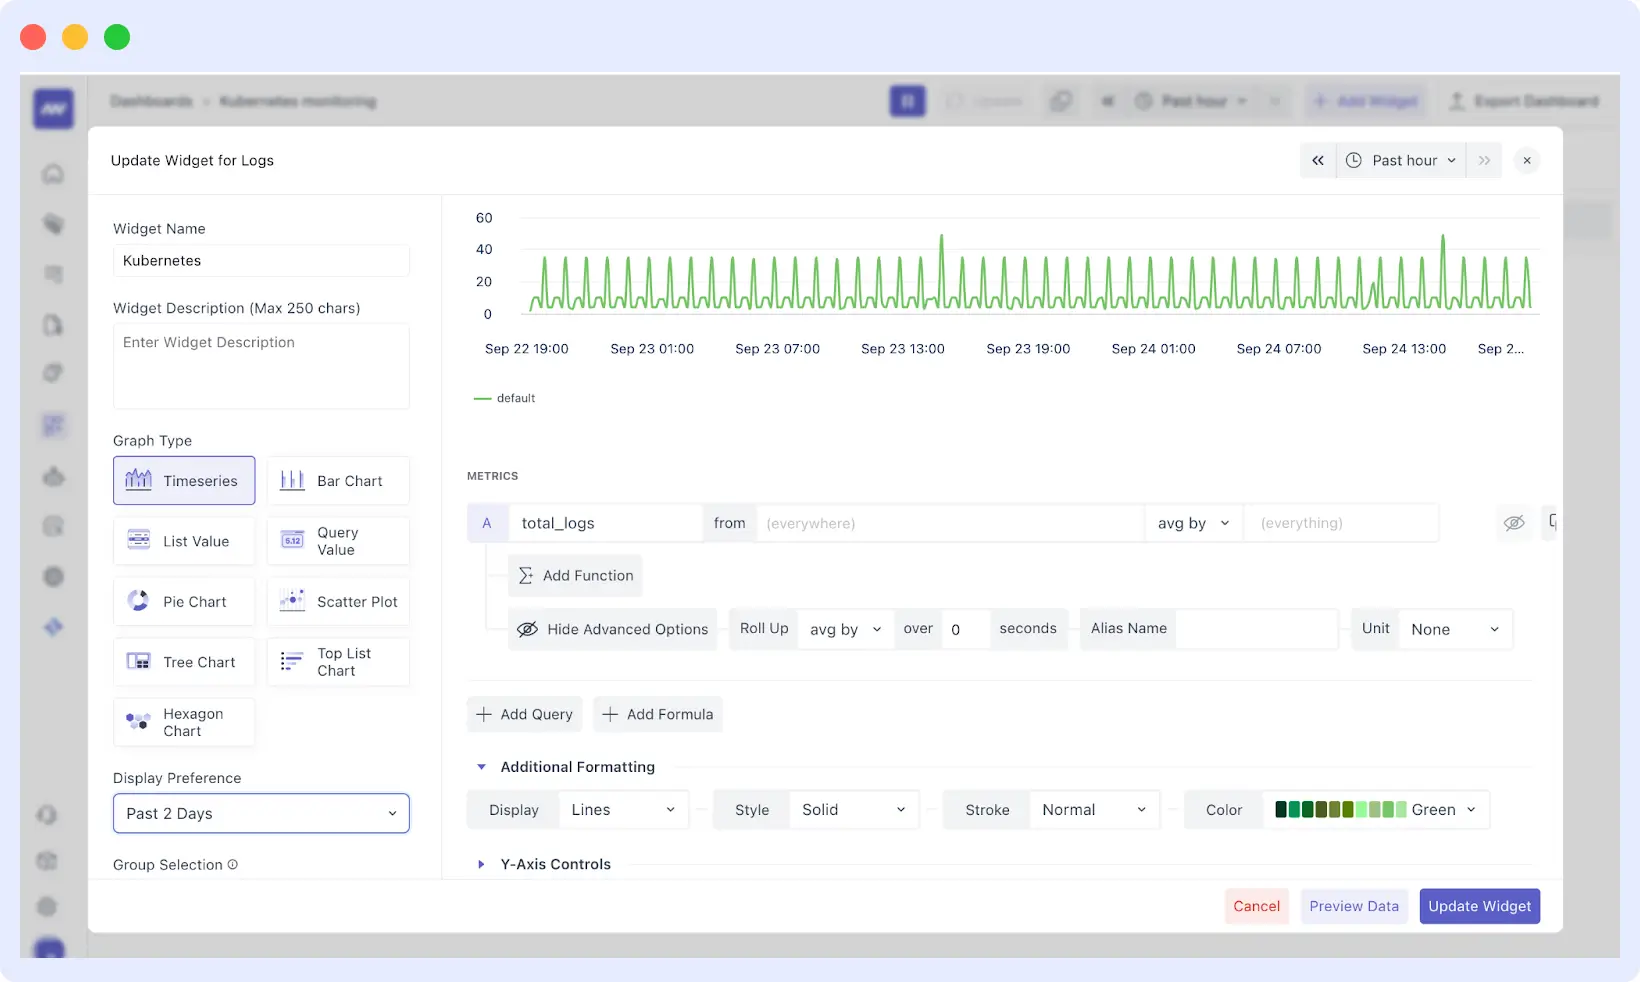
The platform auto-detects data sources based on your agents. For example, installing a Kubernetes agent automatically provides options for building dashboards from data in pods, deployments, and services, ensuring your visualizations accurately reflect your infrastructure.
7. Threshold-Based and Anomaly-Based Alerting
Middleware provides two types of alerting to address both predictable and unexpected problems: threshold-based and anomaly-based alerts. This dual approach helps your team detect and address issues before they impact users.
7.1 Threshold-Based Alerts
These are rule-based and simple alarms. You define a specific condition, e.g., “alarm should trigger if CPU usage crosses 85%” or “notification should be raised if disk space with available capacity goes less than 10%.” Threshold-based alarms are ideal with familiar conditions and are best with predictable metrics such as request latency, disk space, and memory.
7.2 Anomaly-Based Alerts
Middleware’s OpsAI agent triggers anomaly alarms and learn what “normal” looks like in your universe. Instead of hardcoded thresholds, they alert you to unusual patterns in your metrics, such as bursty network traffic or an unexpected spike in error rate. These alarms detect issues you may not anticipate before they hurt your users.
By using both types of alerts, you can apply threshold alerts to well-known problems and anomaly alerts to proactively address unknown ones. These enable you to reduce your average time to identify (MTTD) drastically and average time to reply (MTTR).
Learn more: MTTR vs MTTD
When an alert is triggered, you can set up notification systems (email, Slack, or PagerDuty) to ensure your team is notified immediately.
8. Historical Data Retention & Trend Analysis
Middleware provides excellent storage for historical data, which is critical for long-term analysis of performance trends and capacity planning. The platform archives your metrics, logs, and traces so you can analyze past events and compare current performance against previously set benchmarks.
- Free-tier customers have a 14-day retention period.
- Paid users are granted 30 days of retention.
- For enterprise clients, Middleware offers tailored data retention options that can be scaled to meet specific compliance or analysis requirements.
The dashboard enables you to thoroughly search and access this historical data, helping you understand recurring problems and optimize your infrastructure to drive future growth.
💰 Choose the Middleware plan that fits your infrastructure needs whether you’re a free-tier user, a paid subscriber, or an enterprise client. Scale retention, features, and alerts to match your requirements.
View Pricing & Plans
9. Correlation of Logs, Metrics & Traces for Faster Troubleshooting
Middleware is designed to help teams save time by aggregating logs, metrics, and traces into a single location. Instead of having to switch between distinct dashboards, the platform automatically correlates these data types and offers full context around any performance issue.
👉 Learn more about Log Monitoring and Analysis to see how logs play a key role in faster troubleshooting.
As an example, you can immediately view related traces when an application latency spike has been pinpointed to help you recognize the service that introduced the delay. Meanwhile, you may view logs of the same time to identify the root cause. This end-to-end perspective eliminates the guesswork, allowing teams to address incidents significantly faster.
Proactive monitoring can also be achieved through correlation. Understanding the interactions among logs, metrics, and traces enables you to identify early indicators of problems, reveal bottlenecks, and prevent minor issues from escalating into a complete outage.
10. Data Ingestion Controls
To help manage data costs and volume, Middleware gives you fine-grained control over which telemetry is ingested. This can be done in two ways: via agent configuration or via dedicated APIs.
10.1 Agent Configuration
The agent’s configuration also allows you to select which telemetry data to collect and send to the platform. This will allow you to switch data types on or off and use filters. In one example, you can enable or disable metrics, logs, or traces using a flag in the agent’s configuration file. It is also possible to block out specific metrics or logs so that only the necessary information gets stored.
10.2 Ingestion APIs
For custom or third-party data sources, Middleware offers Data Ingestion APIs. These let you send metrics and logs directly into the platform, giving you complete control over what data is sent from your applications and external tools.
📅Start immediately by creating a free account, or book a personalized demo to see how it works in your environment.
Getting Started with Proactive Infrastructure Health Monitoring
The cost of downtime continues to rise, but you don’t have to wait for the next outage to take action. Middleware’s unified observability platform provides everything you need to transition from reactive monitoring to proactive infrastructure health management.
Ready to see how proactive monitoring works in your environment? Start with a free Middleware account and get your first agents deployed in minutes.