
Imagine working on an important project and experiencing downtime or a slowdown at the last crucial moments. Worse yet, if it leads to data loss, you may have to start over.
As per Data Protection Trends 2022, organizations reported a downtime tolerance of “an hour or less” for 56% of their high-priority applications and 49% of their normal applications. It also finds that downtime or outages are frequent, with 40% or 2 out of 5 servers experiencing one or more outages in the past 12 months.
These issues occur for various reasons, and a traditional or reactive approach often leads to the issue taking a toll on the entire system. If this issue had been anticipated or identified early on, the chances of it leading to any impact on the system could have been minimized.
This is where proactive monitoring plays a crucial role. Proactive monitoring and alert management form a major part of DevOps roadmaps.
In this article, we delve into the core of proactive monitoring, unraveling its significance and exploring the top proactive monitoring tools that you can use to implement this approach.
What is Proactive Monitoring?
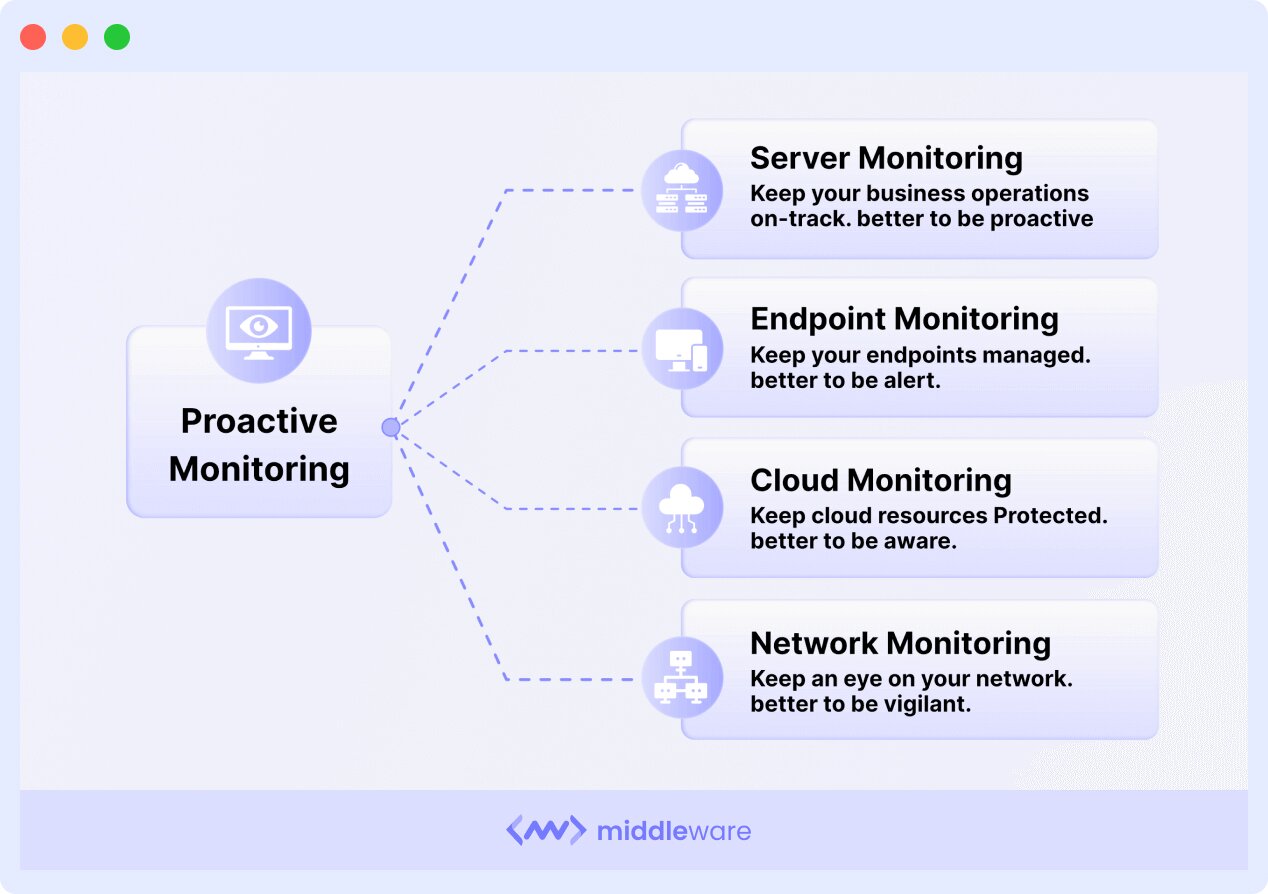
Proactive monitoring is a comprehensive approach to IT system management that involves actively anticipating and addressing potential issues before they impact performance or cause disruptions.
In this monitoring process, observability data from your whole infrastructure is collected, analyzed, and presented in a manner that helps data analysts and DevOps engineers improve decision-making.
Proactive Vs Reactive Monitoring
The proactive monitoring approach leverages real-time observability and alerts to ensure that problems or deviations in predicted patterns are detected in real-time. This helps DevOps teams and Data analysts predict emerging issues and nip them in the bud.
| Proactive Monitoring | Reactive Monitoring |
| It anticipates issues before they escalate into critical incidents. | It is incident-driven, where action is triggered by incidents or disruptions. |
| Systems are continuously monitored for performance metrics, anomalies, and early warning signs. | Systems monitoring can happen as per scheduled maintenance protocols. |
| Proactive monitoring enhances the overall reliability of IT systems, reducing downtime and improving user experience. | The reactive model increases the risk of extended downtimes, affecting business operations and user satisfaction. |
| Proactive measures are taken to optimize system performance, reducing the need for reactive firefighting. | Teams spend valuable time troubleshooting and resolving issues that may have been prevented using a proactive approach. |
Why is Proactive Monitoring Important?
Proactive monitoring helps to enhance service uptime and overall performance since it continuously monitors the systems for any potential issues. This approach has a number of benefits, such as:
Helps in Preventing Downtime
Proactive monitoring allows organizations to identify and resolve potential issues before they can cause any disruptions or impact the system. This not only minimizes system downtime but also ensures that critical business processes continue without interruptions and at optimal performance.
Optimizing Performance
By constantly monitoring system components, organizations can identify bottlenecks, inefficiencies, or potential areas for improvement. This proactive approach enables them to optimize the overall performance of their IT infrastructure.
There are several cloud monitoring tools and services available that can help businesses gain complete visibility into their cloud-based infrastructure and services, providing alerts whenever there are issues that can impact overall system performance.
Middleware provides a dedicated observability solution designed to monitor and manage your cloud-based infrastructure. It offers a holistic view of your infrastructure, applications, and services, enabling proactive monitoring at every level.
Cost Efficiency
Addressing issues before they become critical can significantly reduce the costs associated with downtime and emergency fixes. Proactive monitoring helps in controlling expenses by preventing major system failures and their subsequent financial implications.
Enhancing Security
Anticipating and mitigating security threats is an integral part of any proactive monitoring or alert management system. This approach safeguards sensitive data and ensures that any breach or suspicious activity is flagged as soon as it happens, improving response time and lowering cybersecurity risks.
Strategic Planning
Proactive monitoring provides valuable insights into system trends and usage patterns. This data can be leveraged for strategic planning, capacity management, and making informed decisions about the future scalability of solutions.
How Proactive Monitoring Works
In many ways, proactive monitoring helps organizations operate more efficiently and minimize risks. For this reason, it is only natural for organizations to utilize this approach for their DevOps processes.
With advanced observability and visibility into the system, DevOps teams can create efficient system processes. Let us explore how it unfolds in the four stages of proactive monitoring:
Monitoring
The first stage for any monitoring platform is to set up the tools and processes that will be used for active monitoring. This includes installing the software, setting up the dashboards, and defining alerts or monitoring protocols for the system.
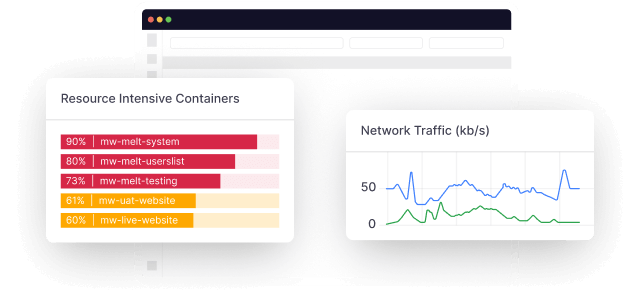
Developers and DevOps teams use this to monitor critical metrics, such as API response times, service health, and data throughput. Developers access real-time dashboards to monitor the performance of their microservices. They can instantly identify fluctuations in response times or unexpected variations in API behavior, allowing for swift interventions and optimizations.
Event Logging
Event logging is the next layer, capturing critical events and activities within the system architecture. Tools like Middleware logs events like service deployments, API requests, and data transactions.
DevOps engineers can use these event logs to understand the timeline of activities and notice any unusual patterns instantly. This allows them to trace the root cause of the event, facilitating quick diagnosis and resolution.
Tracing
Tracing involves capturing the journey of an activity as it is happening. DevOps teams usually use ingest and analyze logs to help trace anomalies and understand any patterns in the system performance that could be prone to risks.
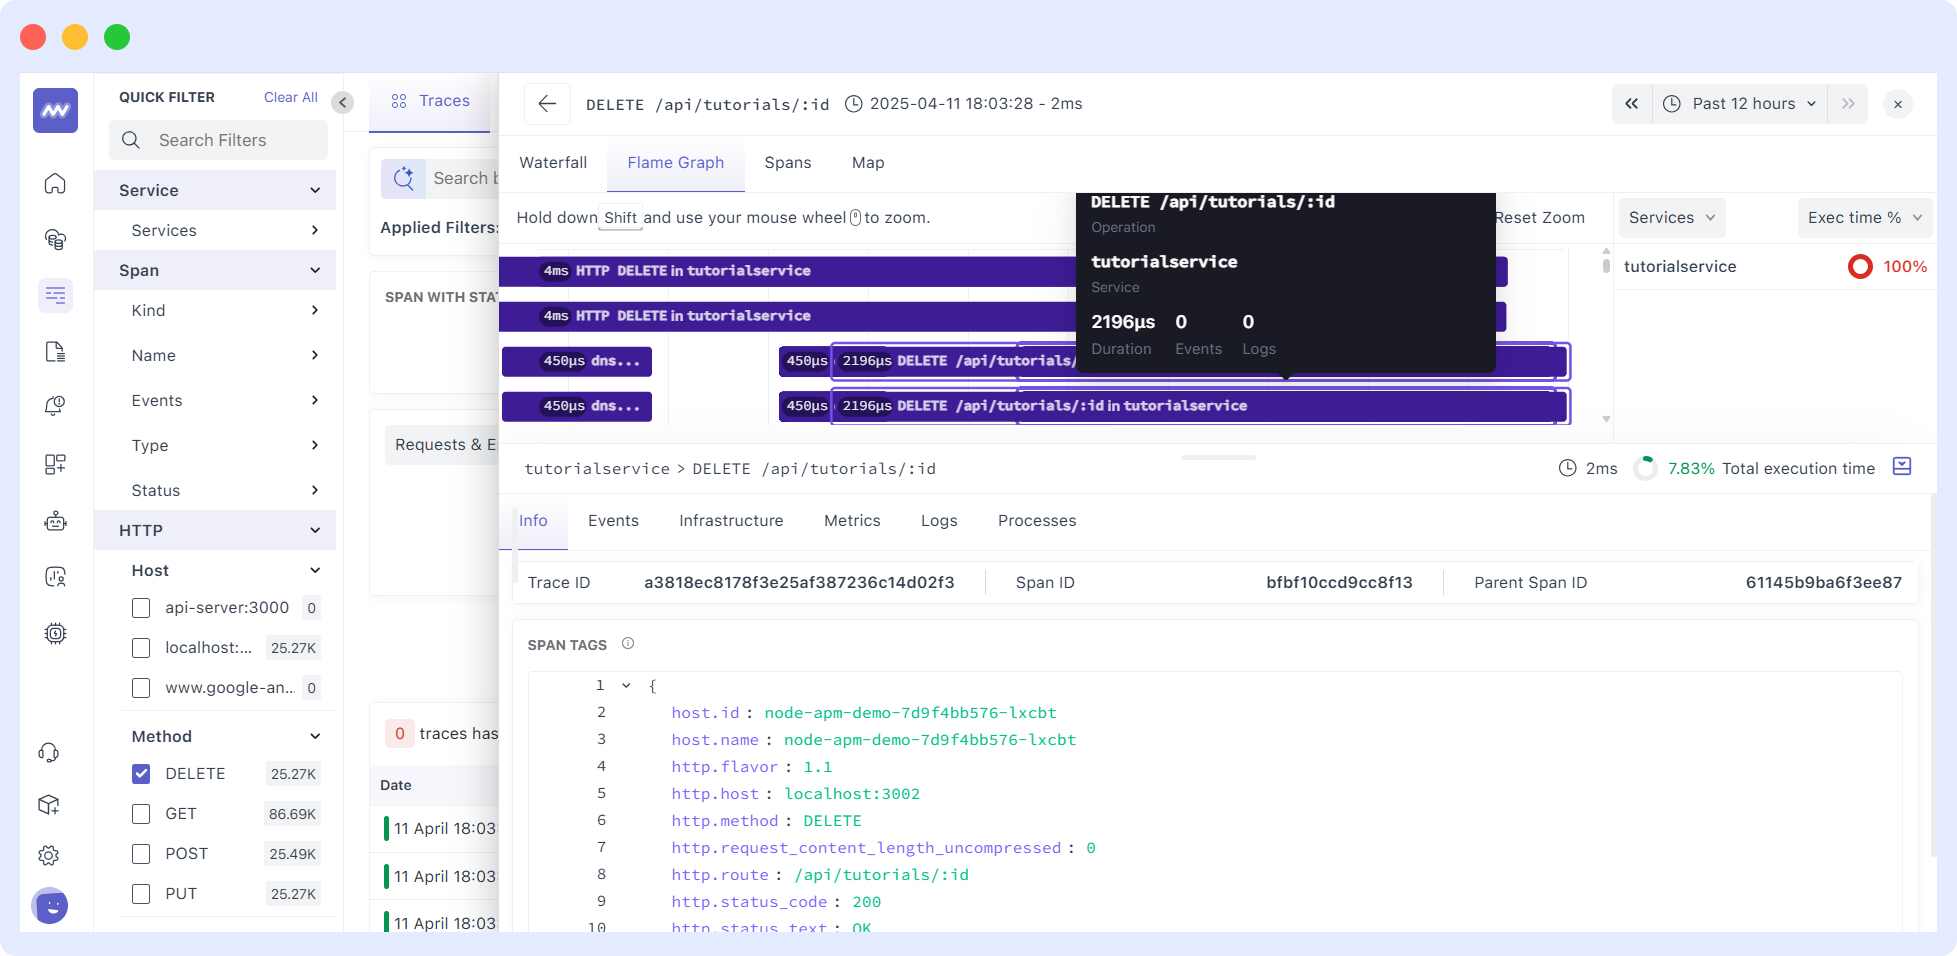
For example, if a certain process takes up too many requests or resources, it can slow down the overall system and even lead to downtime. Tracing allows DevOps engineers to follow the path of a specific API request.
If latency issues arise, they can pinpoint the exact microservices causing the delay. This level of granularity aids DevOps teams in optimizing processes and enhancing the overall performance of the database.
Real-time Alerting
For most DevOps teams, the general approach is to periodically analyze and monitor events. This approach helps to understand system processes and fine-tune them for the future, but when anomalies are detected, the system needs to notify DevOps engineers to react in time. This is where real-time alerts play a crucial role.
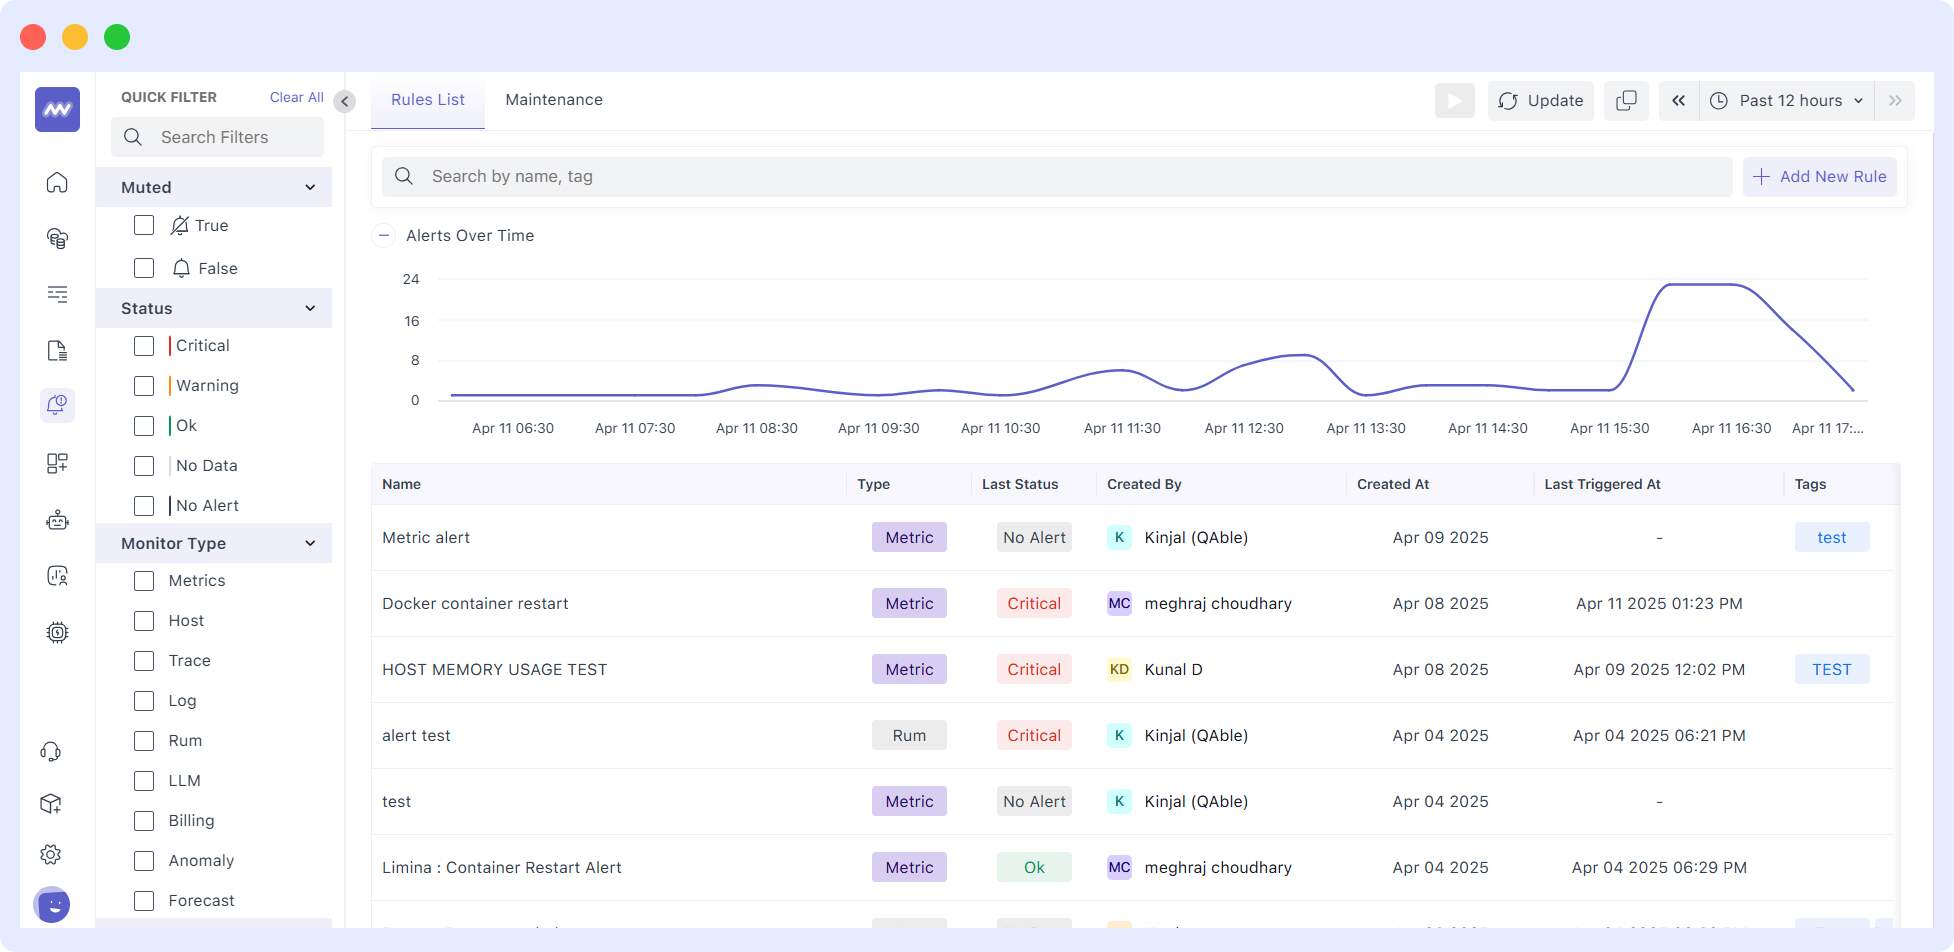
For example, if the error rate of an API surpasses the set threshold or detects patterns that are suspicious, it can raise alerts well within time. This proactive notification empowers DevOps teams to respond swiftly, ensuring the reliability and availability of system resources.
Proactive Monitoring Best Practices
Now that we understand how proactive monitoring works, let us understand the best practices for implementing it.
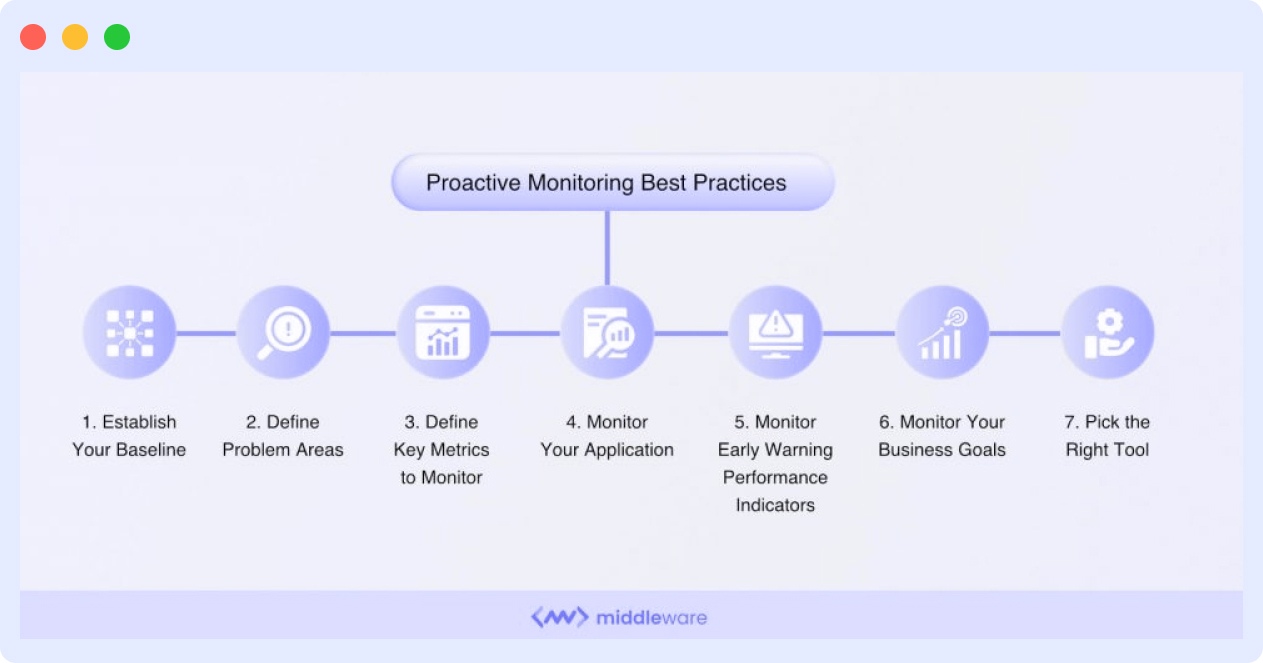
1. Establish Your Baseline
Establishing a healthy baseline means knowing what is healthy behaviour for your system. Before implementing proactive monitoring, establish a baseline for normal system behavior.
For this, you need to implement observability practices in your system and allow it to function normally for a particular time period. During this time, note the fluctuations that arise, and note the reasons for these if there are issues or anomalies taking place, and note which patterns occur when these incidents happen.
This data will help you establish a healthy baseline, and it will serve as a reference point for identifying anomalies and potential issues.
2. Define Problem Areas
Next, define the problem areas or components within your architecture that need to be flagged. Work closely with development, operations, and business teams to pinpoint areas that are prone to performance challenges or have a significant impact on overall system functionality.
3. Define Key Metrics to Monitor
Once you have defined the problem areas, you also need to provide key performance indicators (KPIs) that align with your overall goals. Whether it’s response times, error rates, or resource utilization, selecting relevant metrics is crucial.
Depending on the metric that you choose, the monitoring strategy will adapt and focus on the metric directly. These KPIs will define exactly how well your system’s performance and reliability actually are, making it a crucial decision.
4. Monitor Your Infrastructure
Include infrastructure monitoring as part of your proactive strategy. This includes implementing Observability best practices that provide a set of guidelines for the system to be compliant with standards and expected behavior.
Keep an eye on server health, network performance, and other infrastructure components that support your system. This ensures that issues originating from the underlying infrastructure are identified and addressed promptly.
5. Monitor Your Application
Beyond the infrastructure-level monitoring, you also need to monitor the health of apps and services that are running on this system. Track the behavior of any application, API, or relevant service that runs on the system. This includes monitoring code execution, database queries, and external service integrations.
If any component or app is missed, there can be anomalies that the monitoring tool will not be able to flag, leading to issues.
6. Monitor Early Warning Performance Indicators
Once you have defined a healthy baseline, implement early warning systems that monitor the defined metrics and raise alerts whenever any anomaly is detected. This proactive approach enables timely intervention and prevents minor issues from turning into major disruptions.
7. Monitor Your Business Goals
Finally, monitoring KPIs are not just a baseline for system health and performance. It also helps you to monitor your business goals and understand how well your system is performing. Monitoring should not only focus on technical metrics but also on the direct correlation between system performance and achieving business objectives.
8. Pick the Right Tool
Implementing these proactive monitoring best practices empowers organizations to stay ahead of potential issues, optimize system performance, and align IT efforts with broader business objectives. But the crucial element to it all is to pick a monitoring tool that aligns with your business requirements and technology.
Whether it’s open-source solutions, commercial tools, or a combination, ensure that the chosen tool provides the flexibility and scalability needed to accommodate the complexity of your infrastructure.
Top 3 Proactive Monitoring Tools
There are several tools available in the market that can help you implement proactive monitoring in your infrastructure. To help you make an informed decision, here are the top three monitoring tools that we highly recommend:
Middleware
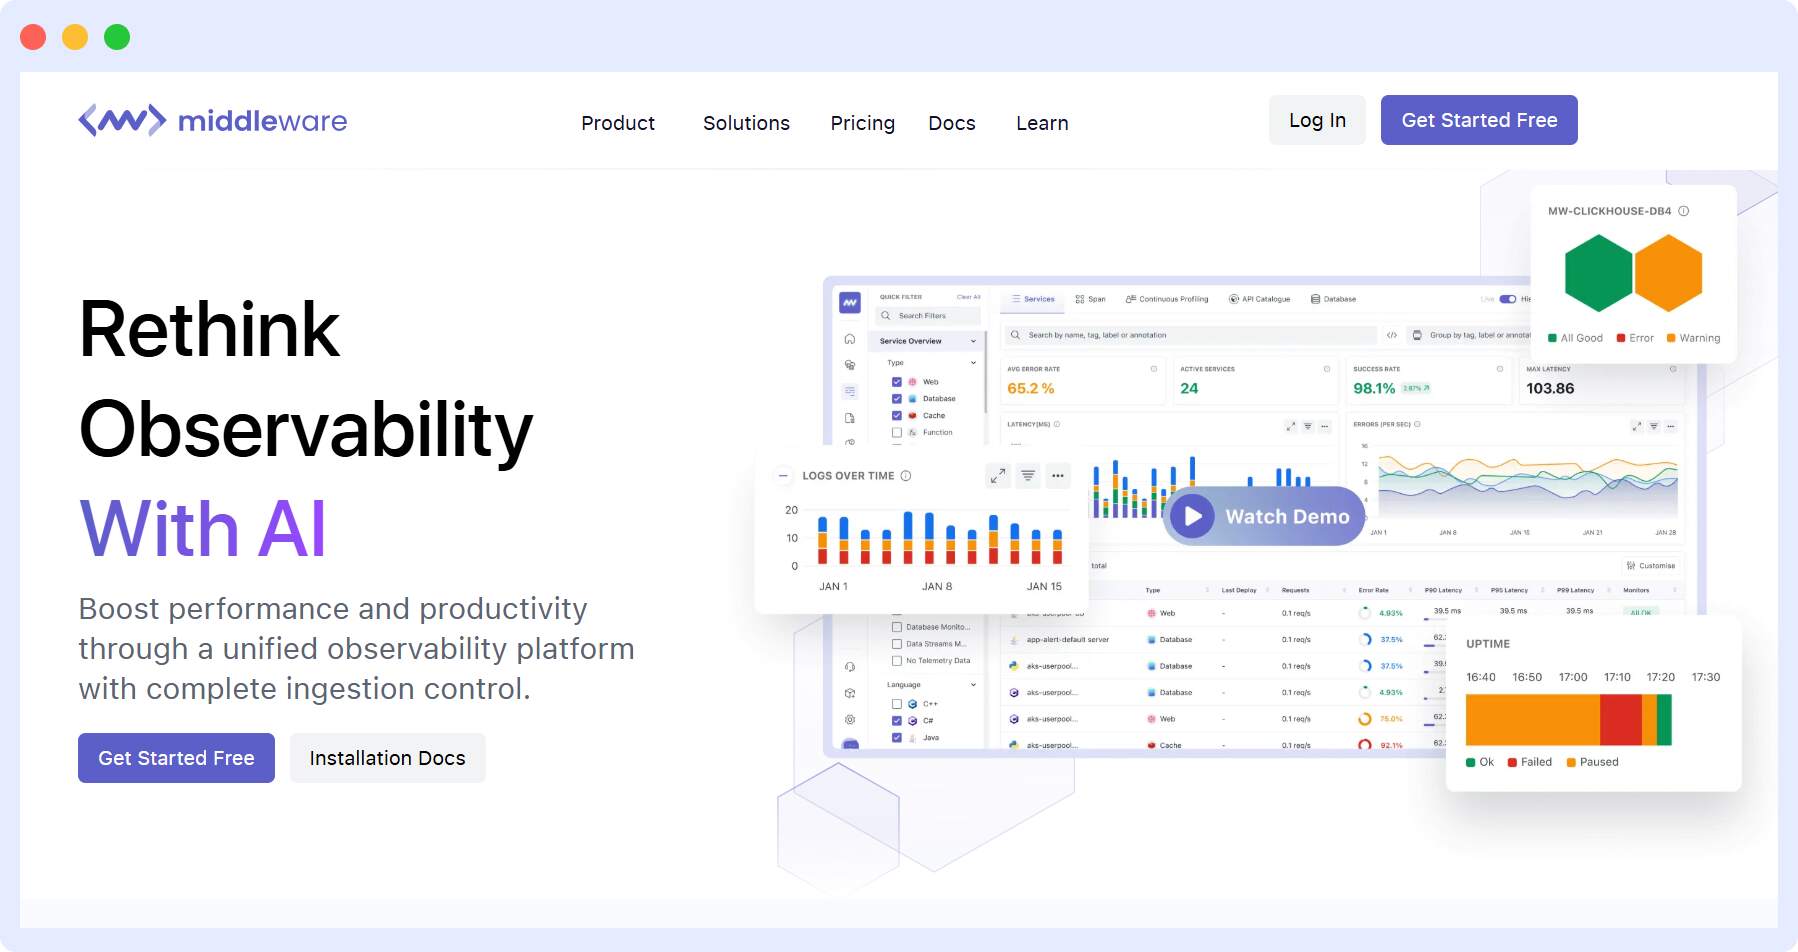
Middleware is a full-stack cloud observability platform that specializes in providing end-to-end observability for complex and multi-layered applications. This brings unique features, such as:
- A comprehensive observability platform tailored specifically for managing complex and multi-tiered systems.
- Real-time monitoring to track vital metrics and DataOps KPIs.
- Advanced Tracing features into the execution flow of transactions to identify bottlenecks and optimize performance.
- Event Logs to capture and analyze critical events, providing a detailed timeline for issue resolution.
- Capture business-critical actions, such as checkout clicks, to make informed decisions.
Datadog
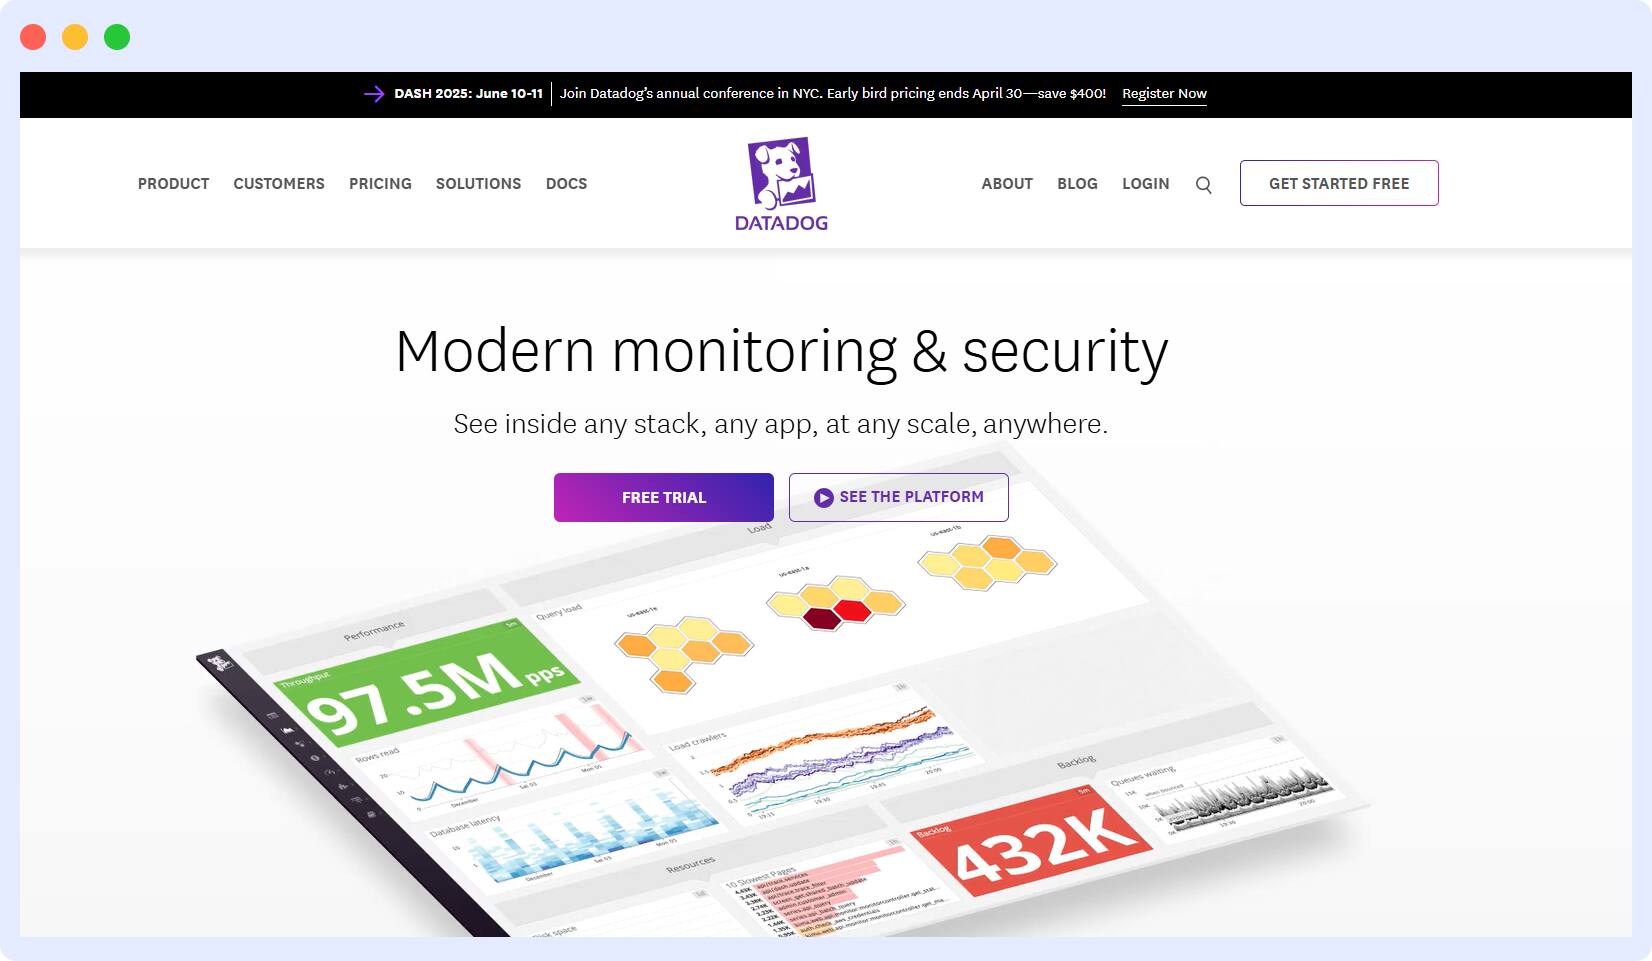
Datadog is a cloud monitoring and security platform that helps you monitor traces, metrics, and logs to make your application, infrastructure, and third-party services entirely observable. The tool offers comprehensive, proactive monitoring features, like:
- End-to-end visibility into the entire stack, including infrastructure, services, and applications.
- Customizable dashboards to monitor key metrics and performance indicators.
- AI-driven alerts and intelligent self-learning algorithms for smart alerting based on abnormal patterns and deviations.
Logz.io
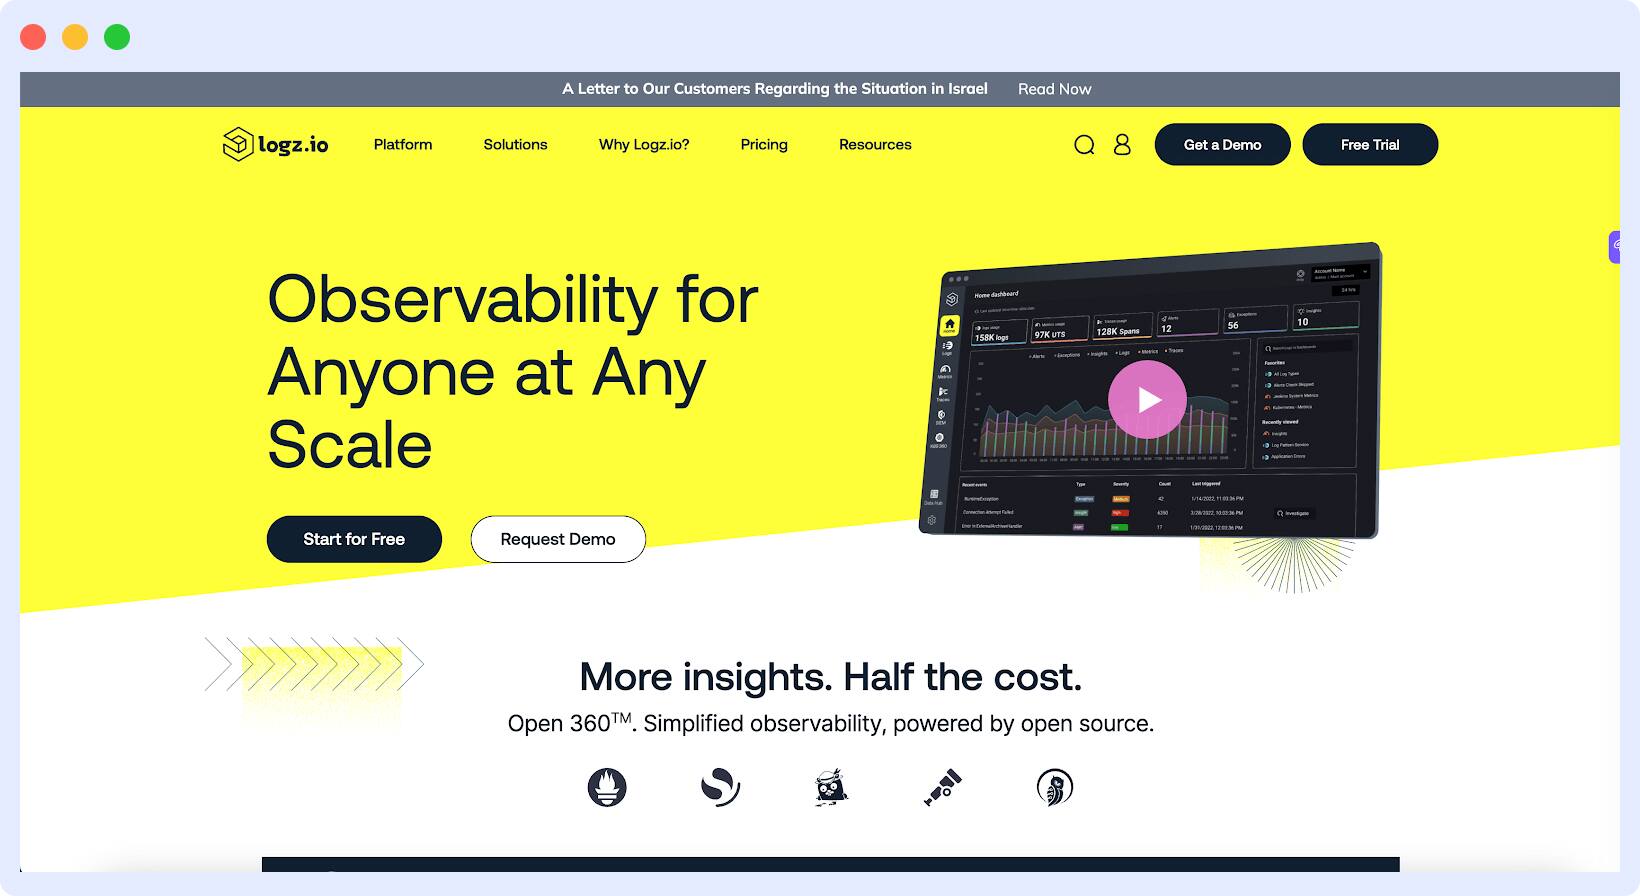
Logz.io is a 360-degree open-source observability and monitoring platform that is powered by OpenSearch (log analytics), Prometheus (metric analytics), and OpenTelemetry (trace analytics). This unique solution includes features like:
- Cloud-native log management, making it well-suited for modern Cloud applications.
- Monitor logs in real-time to detect anomalies, errors, or security incidents promptly.
- Advanced security analytics and threat detection capabilities to safeguard middleware environments.
- Ideal for teams that prioritize log-centric monitoring and troubleshooting.
Conclusion
Proactive monitoring will play a crucial role in any IT infrastructure and is already a growing trend in infrastructure monitoring. As it evolves, predictive analytics, machine learning, and AI will only help improve it further. This can help organizations take proactive monitoring even further, simplifying and automating it in the process.
Thus, the future trends in proactive monitoring can help organizations:
- Reduce downtime by identifying problems before they can impact the system.
- Improve performance by identifying performance issues in real-time.
- Enhance security by constantly monitoring the system for any threats.
To implement proactive monitoring & alert management, selecting the right tools is crucial. Evaluate your specific requirements, infrastructure, and budget constraints to make an informed decision based on your organization’s monitoring priorities.
With the right tool, you can ensure that proactive monitoring is implemented efficiently in your organization and aligns seamlessly with your business goals.
Get started with Middleware for free to help you gain the benefits of proactive monitoring and measure metrics in real-time.