Systemctl logs let you monitor how your Linux system is doing, assist you in troubleshooting, and ensure everything runs well. These logs provide you with vital information on your system services, hence enabling you to control your system more effectively.
This article will show you how to use systemctl to view, filter, and understand these logs. We will discuss necessary commands, applications, and some typical problems and how to debug them.
Understanding Systemd and Systemctl Logs
The fundamental system manager that keeps your Linux machine running smoothly is Systemd. It is smarter and quicker than older systems such as SysVinit and Upstart. It knows which services depend on others and makes sure everything starts in the right order.
Systemd starts the system, runs services, and takes care of other important tasks. It also runs systemd-journald, a logging tool that gathers system logs. The journalctl command lets you view these logs.
What are Systemctl Logs?
Systemctl logs are records of events, messages, and actions running on a Linux system. Systemd generates and controls these logs. These logs let developers monitor system activity, solve issues, and verify service status.
Systemctl logs, for instance, have a record of when a service starts, stops, or crashes. The journalctl command lets users view these logs. If you wish to examine logs for a particular service such as nginx, you can run:
journalctl -u nginxSystemctl itself is a command-line tool used to control and manage system services in Linux. It possesses commands that allow you to manage Linux services efficiently.
Common Systemctl Commands
Systemctl allows users to start, stop, restart, enable, disable, and check the status of services. Here are some common tasks and commands for systemctl:
1. Starting and Stopping a Service
If the service is not running, you can start the service by running:
systemctl start <service-name>To stop the service, run:
systemctl stop <service-name>2. Restarting a Service
If you need to restart a service, use the command:
systemctl restart <service-name>3. Reloading Service
To reload the configuration of a service without stopping it, use the command:
systemctl reload <service-name>4. Check Service Status
You can see if a service is running, stopped, or has failed using:
systemctl status <service-name>5. Enabling and Disabling a Service at Boot
To start a service automatically when the system boots, use the command:
systemctl enable <service-name>If you don’t want to start a service automatically:
systemctl disable <service-name>Importance of Systemctl Logs
Managing and troubleshooting a Linux system depends much on systemctl logs. Here’s why:
- Monitor System Health: Systemctl logs help you spot problems before they become serious. Regular checks with systemctl to view logs can show you if services are struggling or if there are errors to address.
- Find and Fix Problems: When something breaks, systemctl show logs are your first clue. They tell you exactly what went wrong and when, and this saves you hours of guesswork. By checking systemctl service logs, you get detailed information that helps pinpoint the issue quickly and accurately.
- Improve Security: Systemctl logs can let you know whether somebody is attempting unauthorized access to your system. By using systemctl get logs, you can review historical logs that may indicate potential security threats, allowing you to take corrective action and secure your system.
- Debug Applications: When you’re working with applications, systemctl logs become your troubleshooting partner. systemctl view logs show you where errors occurred and what was happening at the time, making fixes much easier.
Getting Started with Systemctl Logs
Systemctl logs are structured in such a way that they are simple to read and understand. Each log entry has certain data points known as fields that enable you to understand what happened, when it happened, and why it happened. Each log has the following:
- Timestamp: Every log entry begins with a timestamp. This indicates the precise day and hour the event occurred.
- Hostname: The hostname identifies the system from which the log entry originated. This is particularly useful when managing multiple machines, as you can easily track which system produced the log using systemctl show logs.
- Service or Process Name: This field indicates the name of the service or process that generated the log entry. You can check systemctl service logs to find logs associated with specific services, such as cron or nginx.
- PID (Process ID): This is the ID of the process that created the log.
- Log Message: The log message is the most important part of the entry. It describes what exactly happened, allowing you to understand the event and what caused it. You can use systemctl view logs to check detailed messages related to any service.
- Priority Level: Logs in systemctl logs are assigned priority levels, indicating the severity or importance of the event. Higher-priority logs need immediate attention. Using the systemctl get logs command, you can filter logs by their priority level to focus on critical issues.
For example, let’s display 10 logs for the cron service and see how they are structured. Run the command:
journalctl -u cron -n 10This will display logs only for the cron service. Here’s what the output will look like:
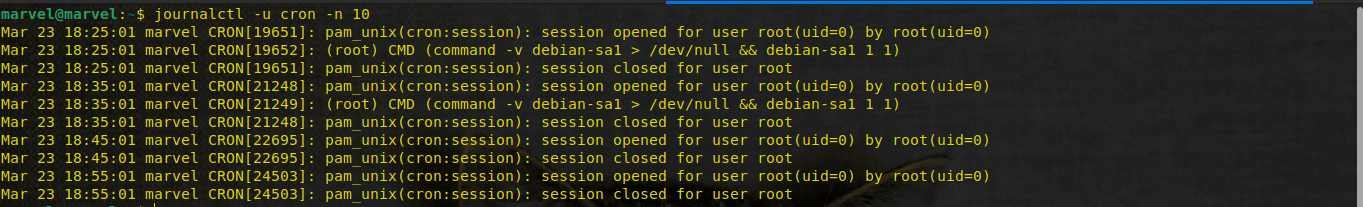
From the first log, we have the following:
- Timestamp: Mar 23 18:25:01 (date, time, and microseconds)
- Hostname: marvel (name of system)
- Service/Process: cron
- PID: [19651]
- Log Message: pam_unix(cron:session): session opened for user root(uid=0) by root(uid=0) (what happened).
You can view your logs in verbose format to see more detailed information (with all metadata). Use the command:
Journalctl -u cron -o verboseThe output looks like this:
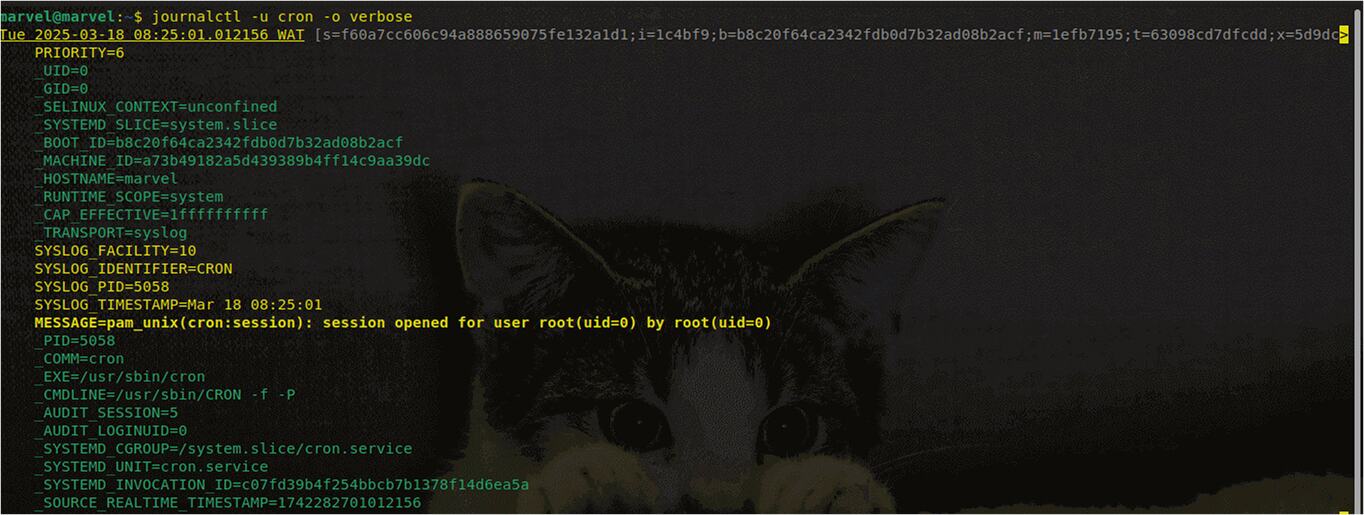
This shows a detailed log, including the priority level.
These are some of the log formats you can use:
- short: Default, concise format.
- verbose: Shows all metadata fields
- json: Machine-readable JSON format.
- json-pretty: Human-readable JSON format
- cat: Only log messages, no metadata
- with-unit: Includes systemd unit names
- monotonic: Uses monotonic timestamps.
Practical Use of Systemctl Logs
In this section, we’ll look at different ways to use systemctl logs effectively.
1. Viewing Logs for Specific Service
You can use systemctl to view logs for a specific service. Checking logs for a particular service is useful when troubleshooting issues or monitoring a service’s activity. To check logs for a specific service, you can run:
systemctl status <service-name>This command will display detailed logs for the service you specify, allowing you to analyze the events related to that service. For instance, you can use systemctl service logs to monitor the logs for services like nginx, cron, or apache2. This helps identify errors, warnings, and general activity associated with the service.
Replace <service-name> with the actual service name. For example, to view logs for cron, run:
Systemctl status cronOutput:
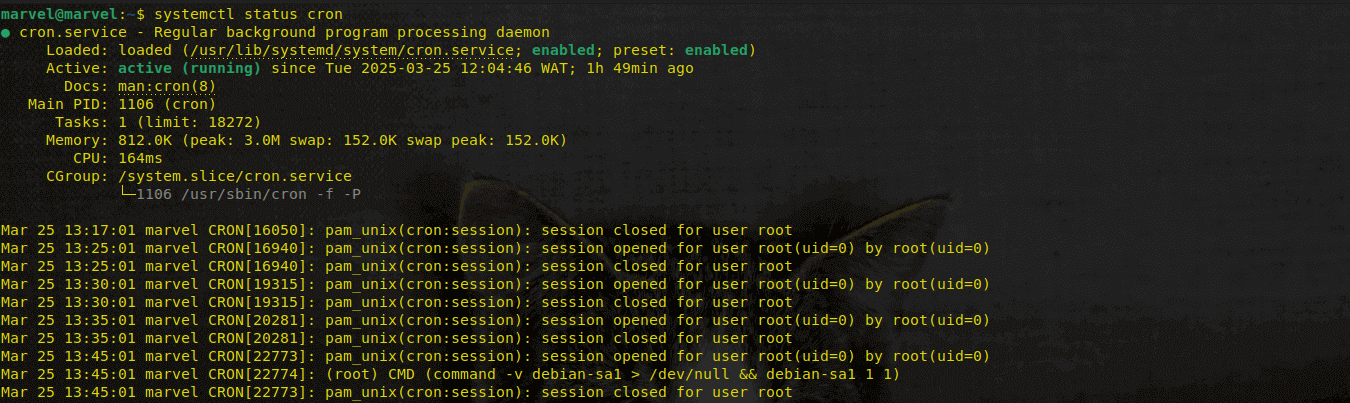
As mentioned earlier, you can use journalctl to check detailed logs.
journalctl -u cronThis will show all logs related to cron.
If you want to see logs for the current boot only (since the system was last restarted), use:
journalctl -u cron --bootThis is helpful when checking for issues that happened after restarting the system.
2. Filtering Logs (By Time and Priority)
Logs contain lots of information (which we mentioned earlier), so filtering helps you focus on important events.
- Filtering by Time
You can use –since and –until to view logs within a specific time range.
journalctl --since "2 hours ago"This command shows logs from the last 2 hours.
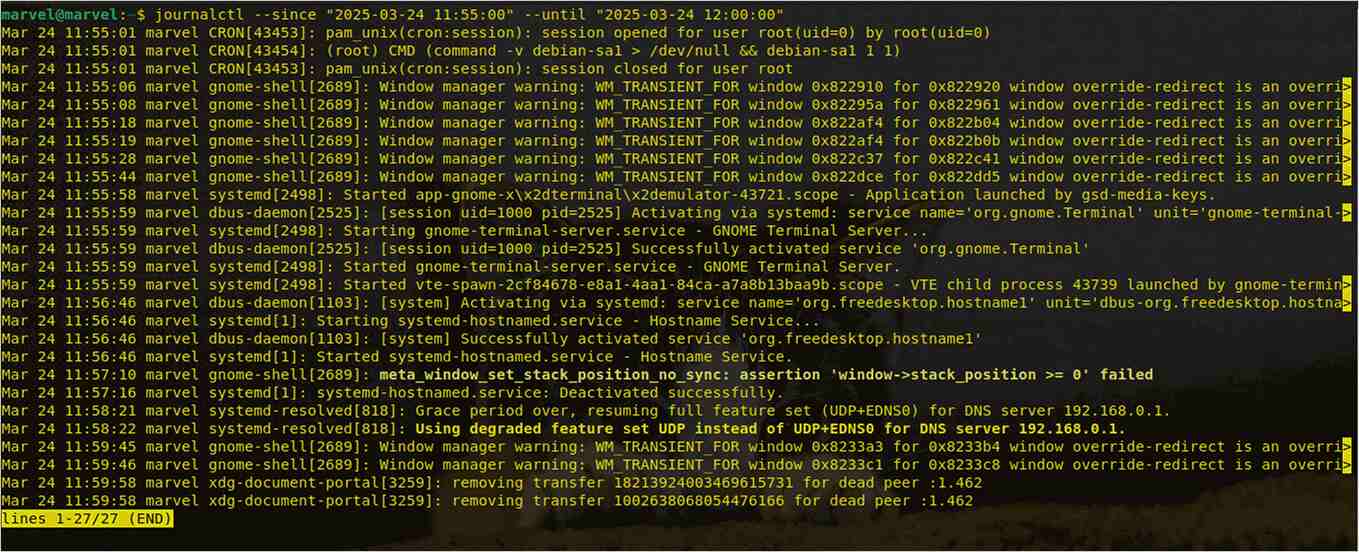
To check logs between a specific date and time:
journalctl --since "2025-03-24 11:55:00" --until "2025-03-24 12:00:00"This displays 5 minutes logs from 11:55 AM to 12:00 PM on March 23, 2025.
Output:
- Filtering by Priority
Logs have different priority levels, which help identify critical issues. Priority levels include:
- 0: Emergency (System is unusable)
- 1: Alert (Immediate action is required)
- 2: Critical (Severe issues)
- 3: Error (General errors)
- 4: Warning (Potential problems)
- 5: Info (General information)
- 6: Debug (Detailed debugging logs)
Let’s say you want to view only error logs (priority 3 and below), use the command:
journalctl -p 3 -n 20This shows the last 20 logs with priority Error, Critical, Alert, or Emergency.
You can also combine multiple filters:
journalctl -u nginx --since "today" -p errThis shows:
- Only logs for nginx
- From today
- Only error messages.
3. Following Logs in Real-Time
If you want to see logs as they are generated, you can follow them in real-time. You can use this to diagnose live issues. This is the command you’ll use:
journalctl -fThis continuously updates with new log entries.
To follow logs for a specific service, use:
journalctl -u <service-name> -fIt will show live logs of the specified service as new entries appear.
4. Searching Logs
You can search for specific words or phrases in logs. Use the command:
journalctl | grep "search term"Example:
journalctl | grep "fail"
journalctl | grep "error"
Output for logs that have the word “fail”:
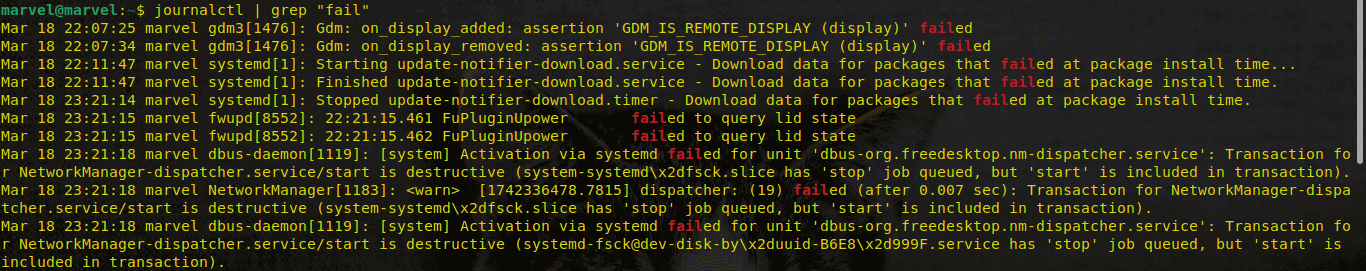
These tips will help you to quickly find relevant messages in large logs.
Use Cases for Systemctl Logs
Systemctl logs are very useful in different situations. Here are some common ways to use these logs:
Monitoring System Performance
Systemctl logs help you check if your system is working properly. You can use these logs to spot any errors or warnings. Logs also show which services are using too much CPU or memory. With insights from systemctl service logs, you can proactively manage your system’s health and ensure smooth operation.
Troubleshooting a Failed Service
If a service stops working, systemctl logs can show the reason. They show why the service failed and give error messages to help you find the cause. Logs can tell you if the service stopped because of missing dependencies or wrong settings.
Using systemctl show logs, you can quickly identify the root cause of the problem and take steps to resolve it, such as restarting the service or correcting the configuration.
Security Auditing
Systemctl logs help you keep your system safe. They show if someone tried to access the system without permission. They can also show signs of attacks, like many failed login attempts. With systemctl get logs, you can find security problems and take steps to protect your system.
Debugging a Custom Service
If you create your service, then you need systemctl logs too. They show if your service started correctly or if there were errors. The logs also give details about what the service is doing while it runs. By analyzing systemctl view logs, you can pinpoint the exact problems, refine the service, and ensure it runs smoothly in production.
Common Issues and Troubleshooting
When working with systemctl logs, you might run into problems with system logs. Here are some common issues and how to fix them.
Logs Not Showing Up
Sometimes, you might run journalctl but see no logs or get an error. This can be caused by different reasons:
- Service isn’t running: Check if the service is active using systemctl status <service-name>. If it’s stopped, start it.
- Logs do not persist: By default, logs are stored temporarily (i.e., they are lost after reboot). To save them, use the following commands:
sudo mkdir -p /var/log/journal
sudo systemctl restart systemd-journald- Unauthorized user: Your user does not have permission to view the logs. To resolve this, run the command as root:
sudo journalctl -u <service-name>High Disk Usage by Logs
System logs can take up a bit of space over time. If logs are using too much disk space, you can reduce their size.
- Check current log usage:
Journalctl --disk-usage- Delete old logs: Let’s say keep a log from the last 2 days only:
sudo journalctl --vacuum-time=2dOr limit it to a fixed size. Let’s say 500MB
sudo journalctl --vacuum-size=500MPermission Issues
By default, only root and users in the system-journal group can read logs. Take the following actions if you encounter a “permission denied” error:
- Add your user to the journal group
- Log out and log back in, or restart your system.
How Middleware Complements Systemctl Logs
While systemctl logs help you monitor system services, Middleware makes log management even better.
Here’s how Middlere complements systemctl logs:
Real-time Monitoring
Systemctl logs let you watch logs live with journalctl —f, but you have to keep the terminal open and manually check for problems. It is also limited to a single system. Middleware automates this by doing the following:
- Monitor logs in real-time across all your servers.
- Alerts you immediately if a service crashes or throws errors.
Example: If your database service stops, Middleware notifies you right away instead of waiting for you to notice yourself, which might take time.
Centralized Log Management
If you manage multiple servers, checking the logs separately can be really difficult. With journalctl, you must log into each server to check its logs. For instance, if you have 10 machines, that’s 10 terminals to manage.
Middleware solves this by collecting logs from all servers into one dashboard. It allows you to search and filter logs from every machine in a single place.
Advanced Analytics
Systemctl logs provide raw data, but you have to figure out patterns yourself (e.g., “Is this error happening a lot?”). Middleware, through its AI-powered analytics, automatically detects recurring errors and trends. It tells you which issues are getting worse over time and also helps you prioritize fixes by showing which errors impact users most.
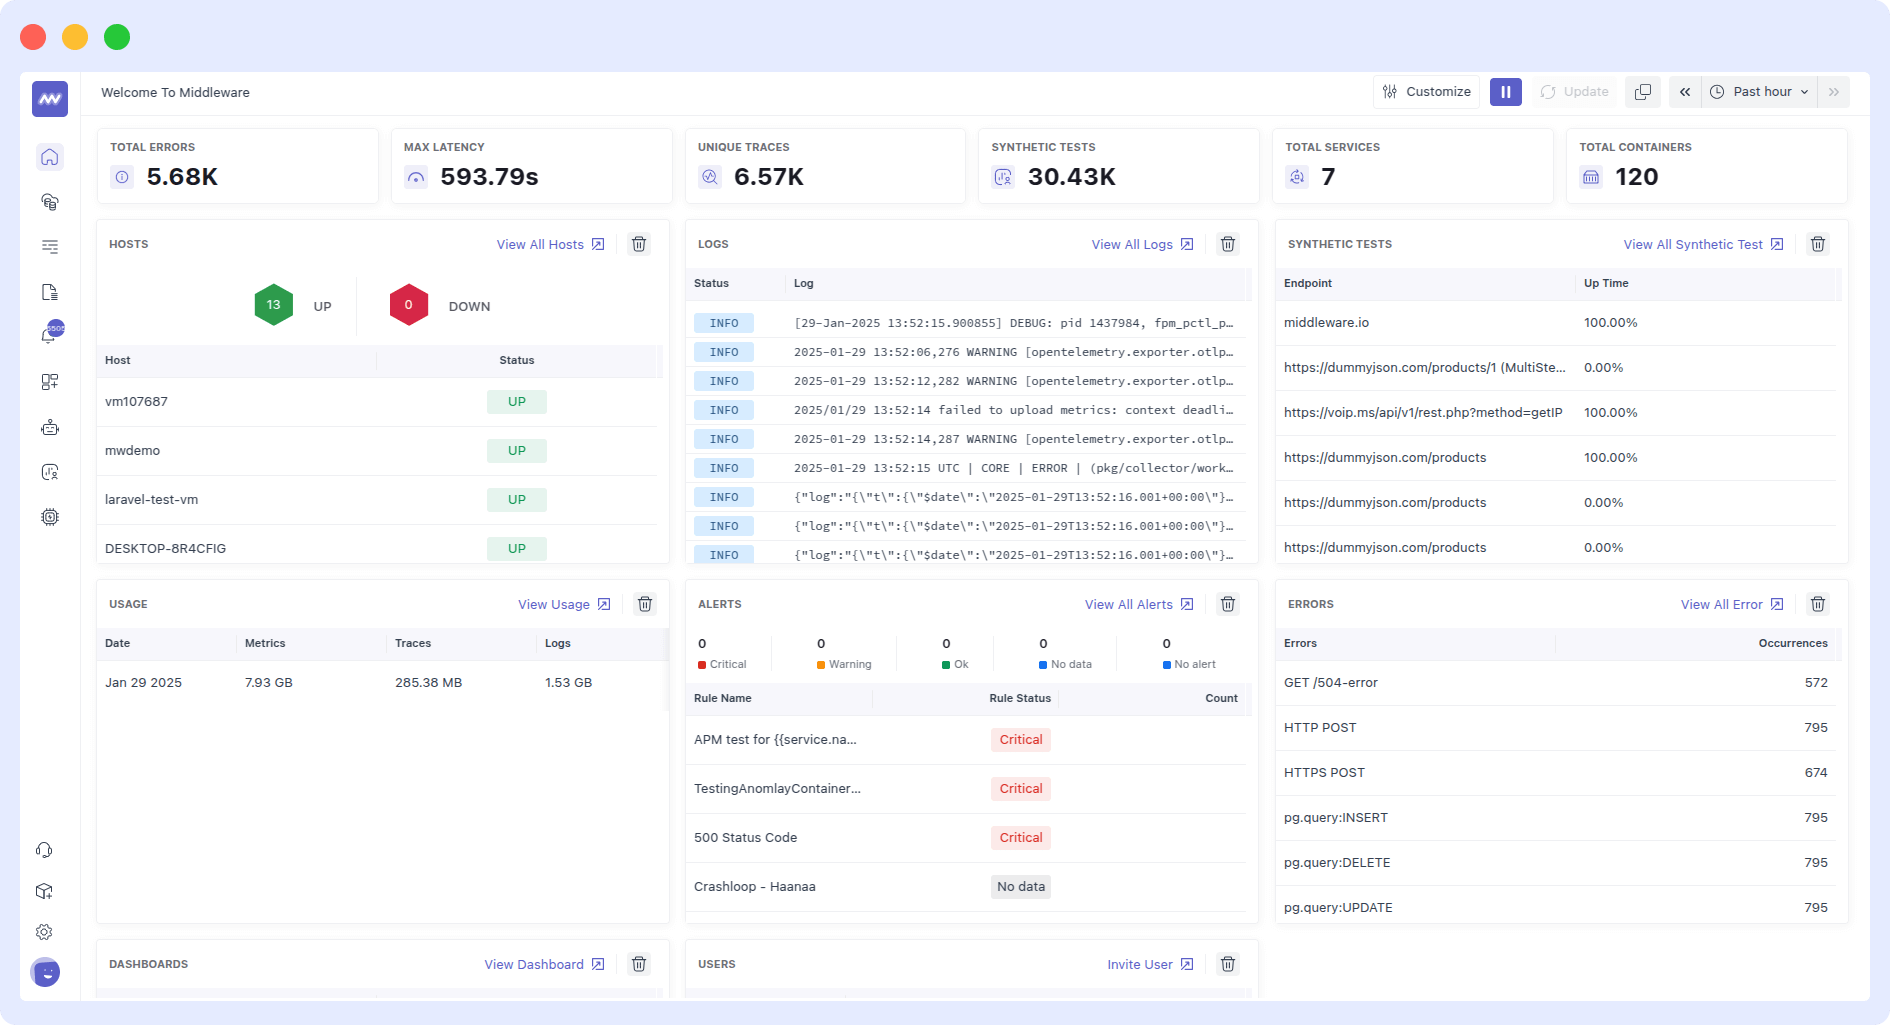
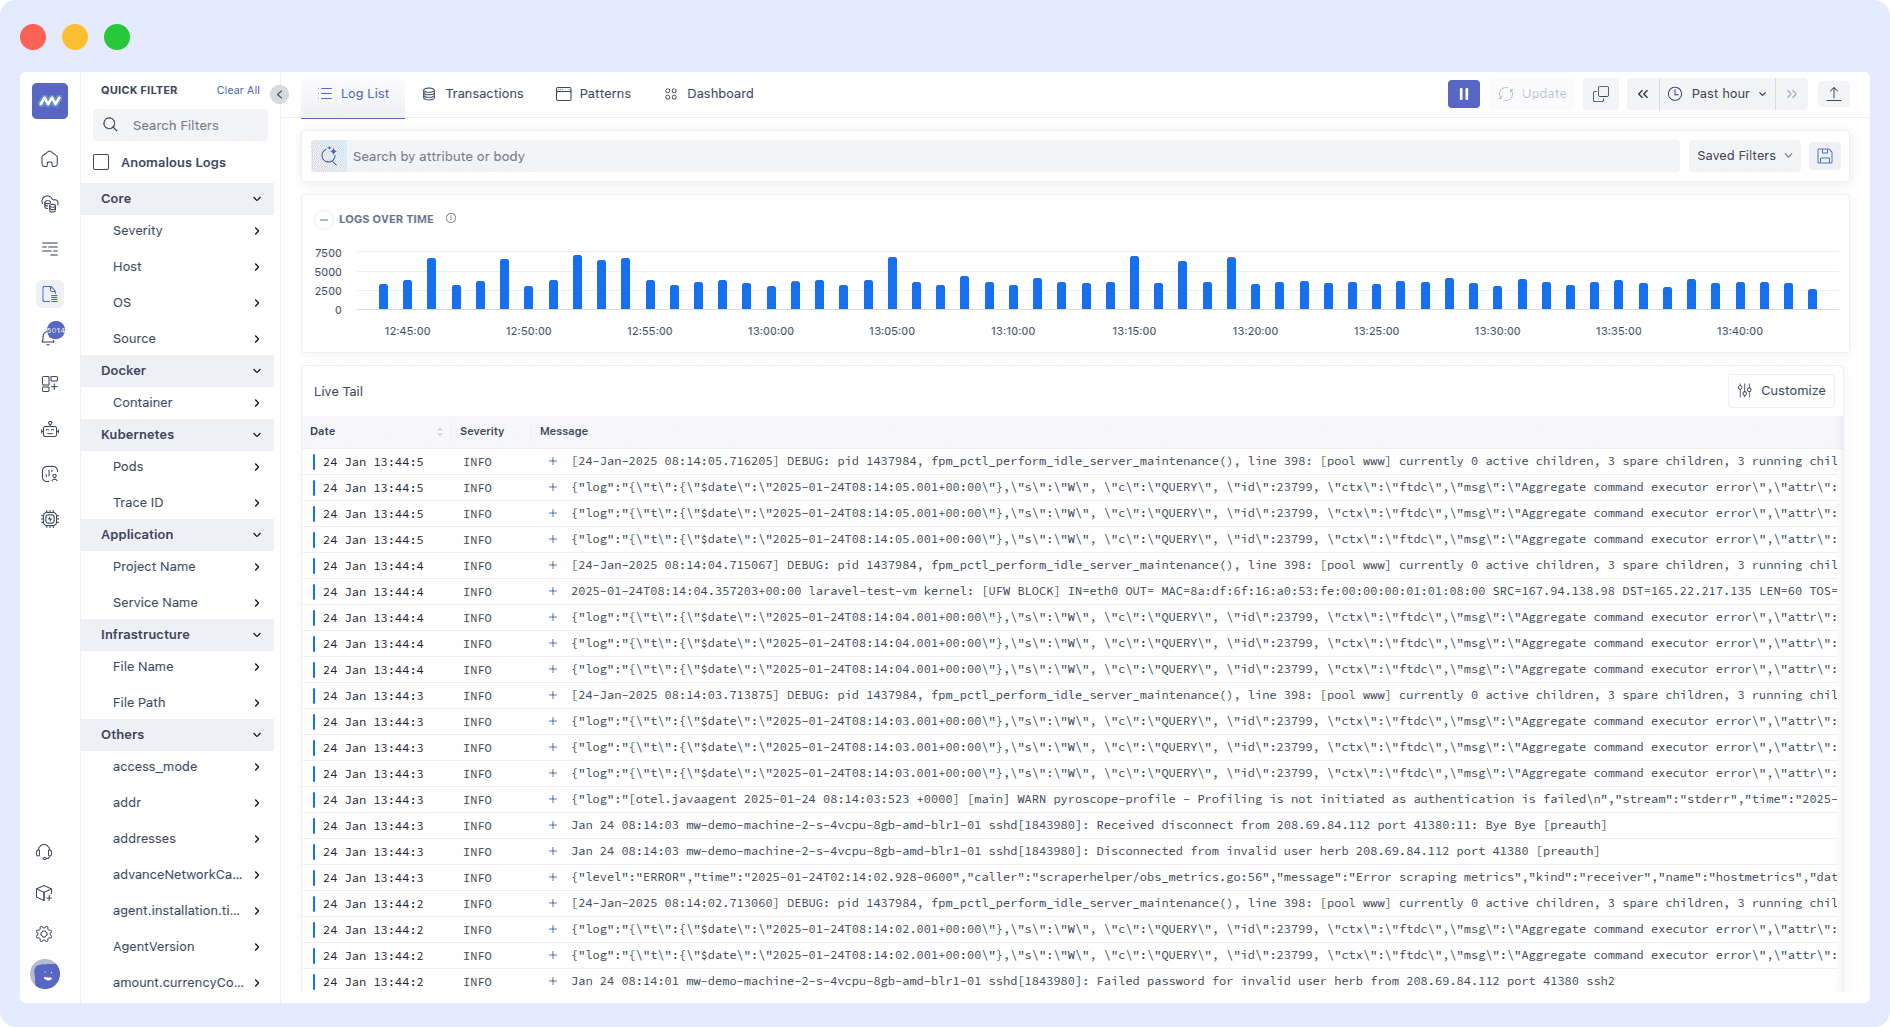
Visualization
Reading plain-text logs makes it hard to spot trends, especially when dealing with large amounts of data, but Middleware turns logs into visuals. It provides charts that show error rates, service health, and performance over time.
Conclusion
In this guide, we cover how logs are structured, how to view and filter them using journalctl, and how to resolve common issues. We also explored how Middleware can improve log management with real-time monitoring, centralized storage, advanced analytics, and easy visualization.
While systemctl logs are useful, handling large amounts of logs across multiple systems can be difficult. Middleware makes this easier by providing powerful tools for managing and analyzing logs in one place.
FAQs
What is systemctl logs used for?
Systemctl logs let you monitor service and system activity. They help to track system events, diagnose problems, and track performance.
How do I see logs for a particular service?
Use the command journalctl -u <service-name>. Replace <service-name> with the name of the program. For example, journalctl -u nginx.
How can I see real-time logs?
You can follow logs real-time by using the command journalctl -f.
How does Middleware improve systemctl logs?
Middleware helps by providing real-time monitoring, centralized log management, advanced analytics, and better visualization for easier log analysis.