Advancement in technology has given birth to sophisticated features in systems and applications. This raises customer and user expectations so much that any downtime or performance degradation can lead to reputation damage and revenue loss. Whereas, errors and anomalies are inevitable in the complex and interconnected microservices.
As a developer, proper monitoring is your key to maintain service reliability and meet user demands. In the event of any performance issue, monitoring helps you quickly identify the root cause and resolve it. It is also your compliance card to increasingly stringent data privacy regulations, to ensure adherence and prevent costly violations.
As productive as monitoring is, it can be gotten wrong if not approached properly. In this article, we highlight and explore top 10 monitoring best practices that will help you optimize performance and deliver seamless user experiences.
Whether you’re a seasoned developer or just starting out, mastering these practices can mean the difference between proactive issue resolution and firefighting in the dead of night.
What is monitoring?
Monitoring is the process of observing and measuring the performance and behavior of a system or application over time. It involves collecting data on various metrics, analyzing it, and using the insights gained to optimize the system’s performance.
By using monitoring tools, you will gain real-time visibility into the health and performance of your application and infrastructure. Keeping an eye on key metrics such as response times, error rates, resource utilization, and other critical indicators, helps you identify potential problems or anomalies before they escalate into critical issues.
Why is monitoring important in 2024?
Year in year out, the tech landscape undergoes rapid evolution. This is often a butterfly effect of the exponential growth in system sophistication, complexity and interconnectivity.
Cloud computing, microservices architecture, IoT devices, and AI-driven applications have lately become ubiquitous, leading to complicated and interconnected systems.
The shift towards distributed and hybrid infrastructures introduces new layers of complexity, making it challenging to track performance across diverse environments.
Integration of cutting-edge technologies amplifies the need for continuous monitoring to ensure the seamless operation of these intricate systems.
This trend continues in 2024 and won’t stop for a moment. As a developer seeking to be updated with trends in technology, it is important to keep up with the pace and expand your monitoring horizon.
In fact, cyber threats are more sophisticated than ever, posing a constant risk to data security and system integrity. Adopting effective monitoring is thus a frontline defense against cyber-attacks. It allows you to anticipate issues before they impact users, reducing MTTR and minimizing disruptions.
In today’s competitive market, where user loyalty hangs by a thread, staying ahead of issues through vigilant monitoring is imperative for businesses to maintain a competitive edge and foster customer trust.
In 2024, the ability to monitor systems effectively is not just advantageous, it also helps you deliver innovative, high-performing solutions that meet the demands of modern enterprises.
Top 10 monitoring best practices
To enjoy the fruit of your monitoring, there are certain best practices you should adopt. Adhering to industry-leading practices marks the difference between downtime and smooth operations.
The following are top 10 monitoring best practices that help you attain success in your monitoring endeavor.
Define your monitoring goals
Before initiating any monitoring exercise, clearly define what you want to monitor and why.
- What do you seek to achieve with monitoring the component?
- What is the extent of your exercise?
- What are the key metrics to be tracked?
- What is the frequency of monitoring?
- What actions are to be taken in response to alerts?
This clarity helps you ensure that your monitoring efforts are aligned with your organization’s business objectives. It also helps you streamline your monitoring efforts and response procedures.
A salient aspect of clear goal definition is to understand your infrastructure capacity and limit. This includes knowing the CPU cores, the amount of RAM in the memory, the network throughput, and the Disk IO. Information relating to this can be gathered across your bare metal, virtual machines, cloud providers and containers.
This information enables you to identify which metrics are critical for the smooth functioning of your system, and monitor the most crucial aspects of your applications and infrastructure.
By defining what monitoring success looks like in terms of system performance, you’ll easily track progress and identify deviations that require attention.
Choose the right monitoring tool
For monitoring success, you need to select a tool that best suits your specific monitoring needs. The chosen monitoring solution should be able to scale with your systems and adapt to changing requirements. It should accommodate growth without hindering performance or requiring a complete overhaul. Ensure that the solution seamlessly integrates with your existing infrastructure, applications, and tools.
While choosing a monitoring tool, you have to also consider whether the solution can monitor KPIs that are vital to your system’s performance. It should also provide accurate data with granular insights into system performance metrics, for detailed analysis and troubleshooting of issues.
Evaluate how it collects, stores, and presents data. Look for features such as real-time monitoring, historical data analysis, and customizable dashboards.
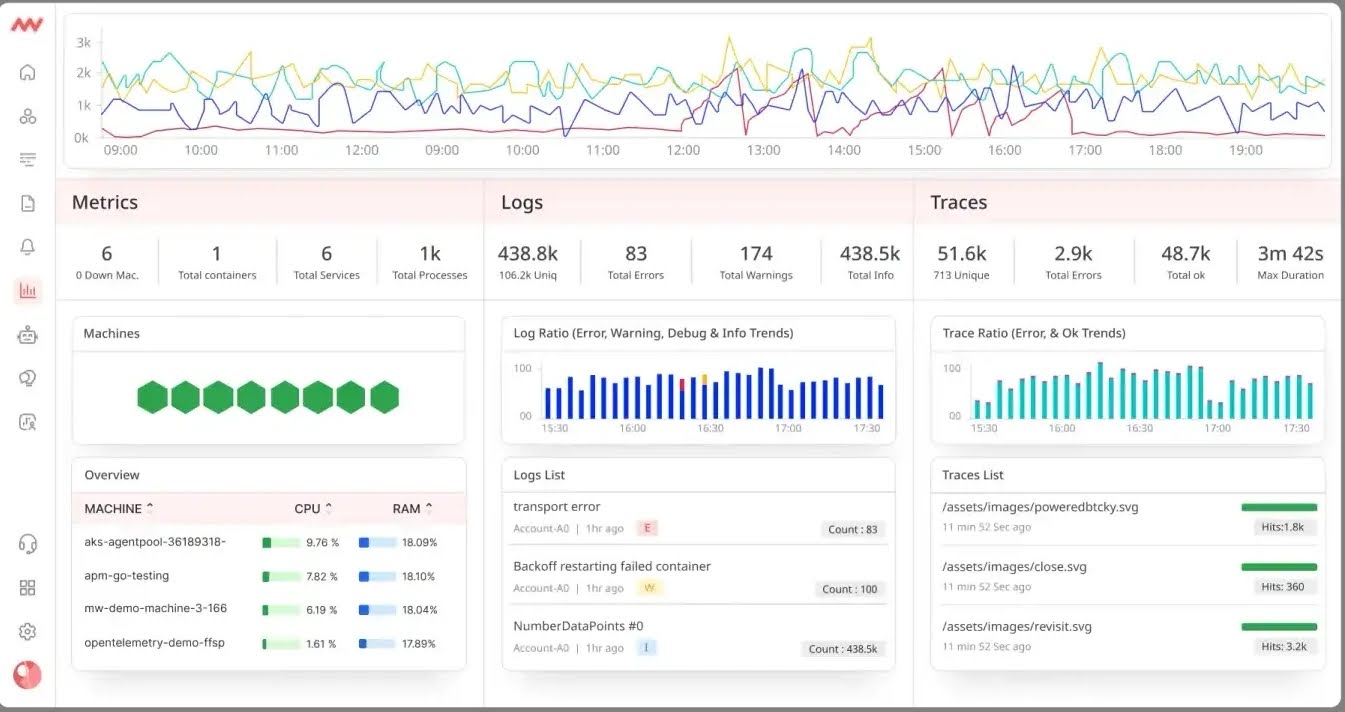
On Middleware’s dashboard, you can visualize your metrics in graphs and charts for clear and intuitive understanding of the data.
Check if the tool offers robust reporting capabilities and alerting mechanisms that enable you to set up alerts based on predefined thresholds and receive notifications via various channels like email, SMS, or any collaboration tools.
The monitoring tool must also allow for automated installation and configuration. This streamlines the monitoring process and reduces human error. A solution that is easy to use will also reduce the learning curve for your team. Its flexibility should include accessibility from both the browser and mobile devices.
In the end, evaluate the cost of the tool in relation to the features and benefits it provides. Consider also the ROI in terms of improved system performance and reduced downtime.

Monitor the right metrics
Select and monitor the most actionable metrics that align with your objectives and relevant to the performance and reliability of your systems.
By monitoring the right metrics, you’ll identify performance bottlenecks and proactively address them before they impact users. It also helps you pinpoint the root cause of performance issues or anomalies, leading to quicker resolution and reduced downtime.
To achieve this, simply do the following:
- Start by defining the KPIs that align with your objectives and system functions. Common KPIs include response times, error rates, throughput, CPU utilization, memory usage, network latency, etc.
- Then differentiate metrics based on the components of your system. For example, monitor database performance metrics (e.g., query response time, connection pool usage) for database systems, and server resource metrics (e.g., CPU, memory, disk usage) for servers.
- Set baseline values and thresholds for each monitored metric to define acceptable performance ranges. Deviations beyond these thresholds should trigger alerts, indicating potential issues that require attention. For instance, ensure CPU utilization is kept at 75% threshold, and send/receive rates for your network is at 70%.
Other metrics to consider include max queue sizes, entries performed, task counts, pool sizes, while avoiding sustained queue usage and accumulation of tasks blocked.
Implement distributed tracing
Distributed tracing allows you to track the flow of requests across multiple services in a distributed system. By correlating traces, logs and metrics from different services involved in handling a request, distributed tracing simplifies the process of root cause analysis. It provides a detailed view of how requests propagate through interconnected services in a distributed environment.
By implementing this feature, you’ll be able to trace the path of a single request across various microservices, enabling end-to-end visibility.
Capturing timing information at each service boundary, distributed tracing facilitates the identification of latency bottlenecks and dependencies between services. This helps you optimize response times and enhance system efficiency.
Your chosen monitoring tool must therefore have distributed tracing as its feature to capture trace spans, context, and metadata at various points in the request flow across services.
Ensure that trace context, including trace IDs, span IDs, and parent-child relationships, is propagated consistently across service boundaries.
Also, implement intelligent sampling strategies to manage the volume of trace data generated. Sampling controls the frequency of trace collection, ensuring that valuable insights are captured without overwhelming the monitoring system with excessive data.
Monitor end-to-end
Monitor the entire stack, from infrastructure to applications, to user behaviors, to gain a holistic view of performance.
With this, you can analyze the entire flow of a user request or transaction from start to finish across the different services, databases, caches, and external dependencies within your system.
It also enables you to assess system reliability from the perspective of end-users, and helps you ensure that service levels meet user expectations and deliver a seamless experience.
As a tip, establish service-level objectives that define the acceptable performance thresholds and error rates for each stage of user journey through your system. Monitor these SLOs proactively to detect deviations and take corrective actions.
Set up alerts and notifications
Configure alerts to notify you of any unexpected behavior or performance deviations. That is, defining rules, thresholds, severity levels, and conditions to automatically trigger alerts that notify you when predefined metrics or events indicate potential issues within your system.
By setting up targeted alerts based on KPIs and SLOs, you’ll effortlessly optimize resource utilization, prioritize tasks, and focus on addressing high-priority issues efficiently.
Alerts enable you to proactively detect and respond to anomalies, performance degradations, or security threats in real-time, before they escalate and impact users. It further helps you minimize downtime, mitigate risks, and maintain system reliability.
For effective alert configuration, the following is instructive:
- Set up alerts for key metrics such as response times, error rates, traffic spikes, resource utilization, and security breaches to capture a comprehensive range of issues.
- Define escalation policies that outline the hierarchy of alert recipients, response actions, and communication protocols in case of escalating alerts. Ensure that alerts are routed to the appropriate teams or individuals based on the severity and impact of the issue.
- Configure alert notifications to be delivered through multiple channels such as email, SMS, instant messaging platforms, or collaboration tools. Choose channels that suit the urgency and visibility requirements of different types of alerts and stakeholders.
- Integrate automated response actions into alerting workflows to enable self-healing mechanisms, auto-scaling, or automated corrective actions in response to predefined alerts.
Finally, continuously fine-tune alert thresholds based on historical data, trends, and changing system dynamics. Regularly review and adjust alerting criteria to avoid false positives, minimize alert fatigue, and ensure relevant notifications.
Conduct regular recovery testing
This involves simulating failure scenarios to verify the resilience and recovery mechanisms of your system. Define realistic failure scenarios that mimic common failure modes, such as server crashes, network outages, database failures, or third-party service disruptions.
Test various recovery strategies and mechanisms under different simulated conditions. Recovery testing validates the system’s ability to withstand and recover from failures, errors, or disruptions effectively.
This proactive approach helps you identify potential vulnerabilities, weaknesses, and points of failure in the full stack setup. It allows you to improve your system stability and minimize downtime.
By intentionally triggering failures in a controlled environment, you’ll be able to assess the resiliency of your system and its components.
Conducting recovery tests on a recurring basis enables you to gather insights from past incidents, refine recovery strategies, and optimize recovery times. This iterative process fosters a culture of continuous improvement and proactive monitoring.
Finally, conduct recovery tests in isolated or staging environments that replicate the production setup. Ensure that tests do not impact the live system and follow proper containment practices to prevent cascading failures during testing.
Establish a regular order for conducting recovery tests, such as weekly, bi-weekly, or monthly intervals, depending on the system’s complexity and criticality.
Foster collaboration
Collaborate with other teams if you work within a large organization or an enterprise. Involve teams, such as operations, QA, and security, to gather diverse insights and expertise.
This emphasizes cooperation, knowledge sharing, and cross-functional teamwork to enhance monitoring capabilities and problem-solving efficiency. By this, you leverage one another’s strengths to address complex monitoring challenges effectively.
Practice pair programming or buddy coding sessions where teams work together on monitoring tasks, troubleshooting issues, or implementing monitoring solutions.
Incorporate peer review practices into monitoring activities, such as code reviews, configuration validations, and alert rule inspections. This encourages feedback, knowledge exchange, and quality assurance.
Document processes and procedures
This involves creating detailed documentation outlining monitoring workflows, configurations, troubleshooting steps, and incident response protocols. It is different from your monitoring goals, but known and unexpected steps you take in the monitoring exercise.
Documenting processes and procedures captures critical insights, best practices, and domain knowledge related to monitoring activities. It preserves institutional knowledge and ensures continuity even when team members change or are unavailable.
Having a documented journal of processes that lead to either success or failure will assist in future troubleshooting. It plays a key role in standardizing practices and ensuring consistency in monitoring exercise.
Documentation also serves as a valuable resource for training new team members, onboarding stakeholders, and disseminating monitoring knowledge across the organization. It expedites the learning curve and empowers team members to contribute effectively.
For resourceful documentation, develop a structured documentation framework that categorizes processes, procedures, configurations, and troubleshooting guidelines into easily accessible formats. Use templates, style guides, and metadata tags to organize content consistently.
Implement version control systems such as Git to track changes, revisions, and updates to documentation. Maintain a central repository for documentation files, enabling collaborative editing, revision history tracking, and rollbacks to previous versions if needed.
Adopt continuous optimization
Implementing vulnerability scanning is crucial in identifying potential weak points while adopting optimization. Regularly review and refine your monitoring strategy to align with evolving systems, changing requirements, and emerging technologies.
Systems, applications, and infrastructure evolve over time, leading to shifting performance metrics, usage patterns, and monitoring needs.
By actively exploring opportunities for improvement and adjustment, you’ll enhance the efficiency and effectiveness of your monitoring practices.
Anticipate future growth and scalability requirements by incorporating scalability considerations into your monitoring optimization efforts. Ensure that your monitoring strategy can accommodate increased system complexity, traffic volume, and data processing demands as the system evolves.
Benchmark your monitoring performance against industry standards, best practices, or internal benchmarks to gauge the effectiveness of your monitoring strategy. Compare key metrics, response times, and alerting accuracy to identify areas where optimization is needed.
Adopt an incremental optimization approach by making small, iterative adjustments to your monitoring strategy rather than large-scale changes. Test and validate optimizations in a controlled environment before rolling them out to production to ensure minimal disruption.
Bottomline – Monitoring is essential
If you wish to build and maintain resilient, high-performing systems, you should master the monitoring best practices herein discuss. By incorporating these best practices into your workflows, you’ll effortlessly elevate your monitoring capabilities, address issues expediently, and maintain the reliability of your systems.
Using the right tool is at the core of implementing most of these best practices, such as distributed tracing, instrumenting the right metrics, end-to-end monitoring, alerts and notifications, and automation.
Interestingly, with Middleware, all these and more are at your disposal. In other words, it is a full-stack observability and monitoring platform with inbuilt best practices to simplify your monitoring exercise.