
With the increasing adoption of cloud-native technologies, containers, and microservices-based architectures, the significance of log monitoring and management within organizations has risen dramatically.
Because every production system generates logs constantly, E.g., a single Kubernetes cluster running a dozen microservices can produce millions of logs per hour. Most of those logs are noise or info, but some are warnings and errors that become critical incidents for businesses.
Therefore, understanding what is happening inside a complex system can be challenging. Log monitoring provides quick visibility and real-time insights, enabling engineers to investigate mission-critical applications and systems.
This guide provides an advanced overview of log monitoring, benefits, challenges, and best practices.
What are Logs?
Logs are timestamped records of events generated within infrastructure, applications, and networks. These records include timestamp, event types and relevant data. Logs are helpful for troubleshooting issues, monitoring system performance, and identifying security concerns.
Software programs and systems generate log files containing information about the application, user device, time, IP address, and more.
There are various types of logs, such as application logs, system logs, security logs and infrastructure logs. Here are the details:
Application logs come from your code. When your Node.js service throws an unhandled exception or your Python API returns a 500 response, these events are logged in the application logs. This is where most debugging starts.
System logs are generated by the OS and infrastructure layer, kernel events, service starts and stops, disk errors, and authentication events, as recorded in/var/log/auth.log on Linux systems.
Infrastructure logs cover the platform components your applications run on: load balancers, databases, Kubernetes control plane events, cloud provider audit logs, and network traffic logs.
A simple application log entry looks like this:
2024-03-15T14:23:01.482Z ERROR [payment-service] Transaction failed: user_id=38291 amount=249.99 error="connection timeout" db_host=postgres-primary latency_ms=5002From that single line, you know which service failed, what operation, which user was affected, and that the database was unreachable for over five seconds.
What Is Log Monitoring?
Log monitoring is the continuous, real-time process of collecting, parsing, and analyzing log data from systems and applications to detect anomalies, investigate incidents, and maintain operational visibility.
Unlike a one-time log audit, log monitoring is an always-on practice. It involves automated ingestion, structured logs, rule-based or ML-driven alerting, and dashboards that help teams feel in control and proactive.
A deployment issue that took down your checkout service at 2 AM isn’t useful information at 9 AM standup; it should have triggered a PagerDuty alert at 2:01 AM.
But using log monitoring tools, developers consistently evaluate incoming logs in real time, aggregate log files, and issue alerts or notifications for specific log messages and events.
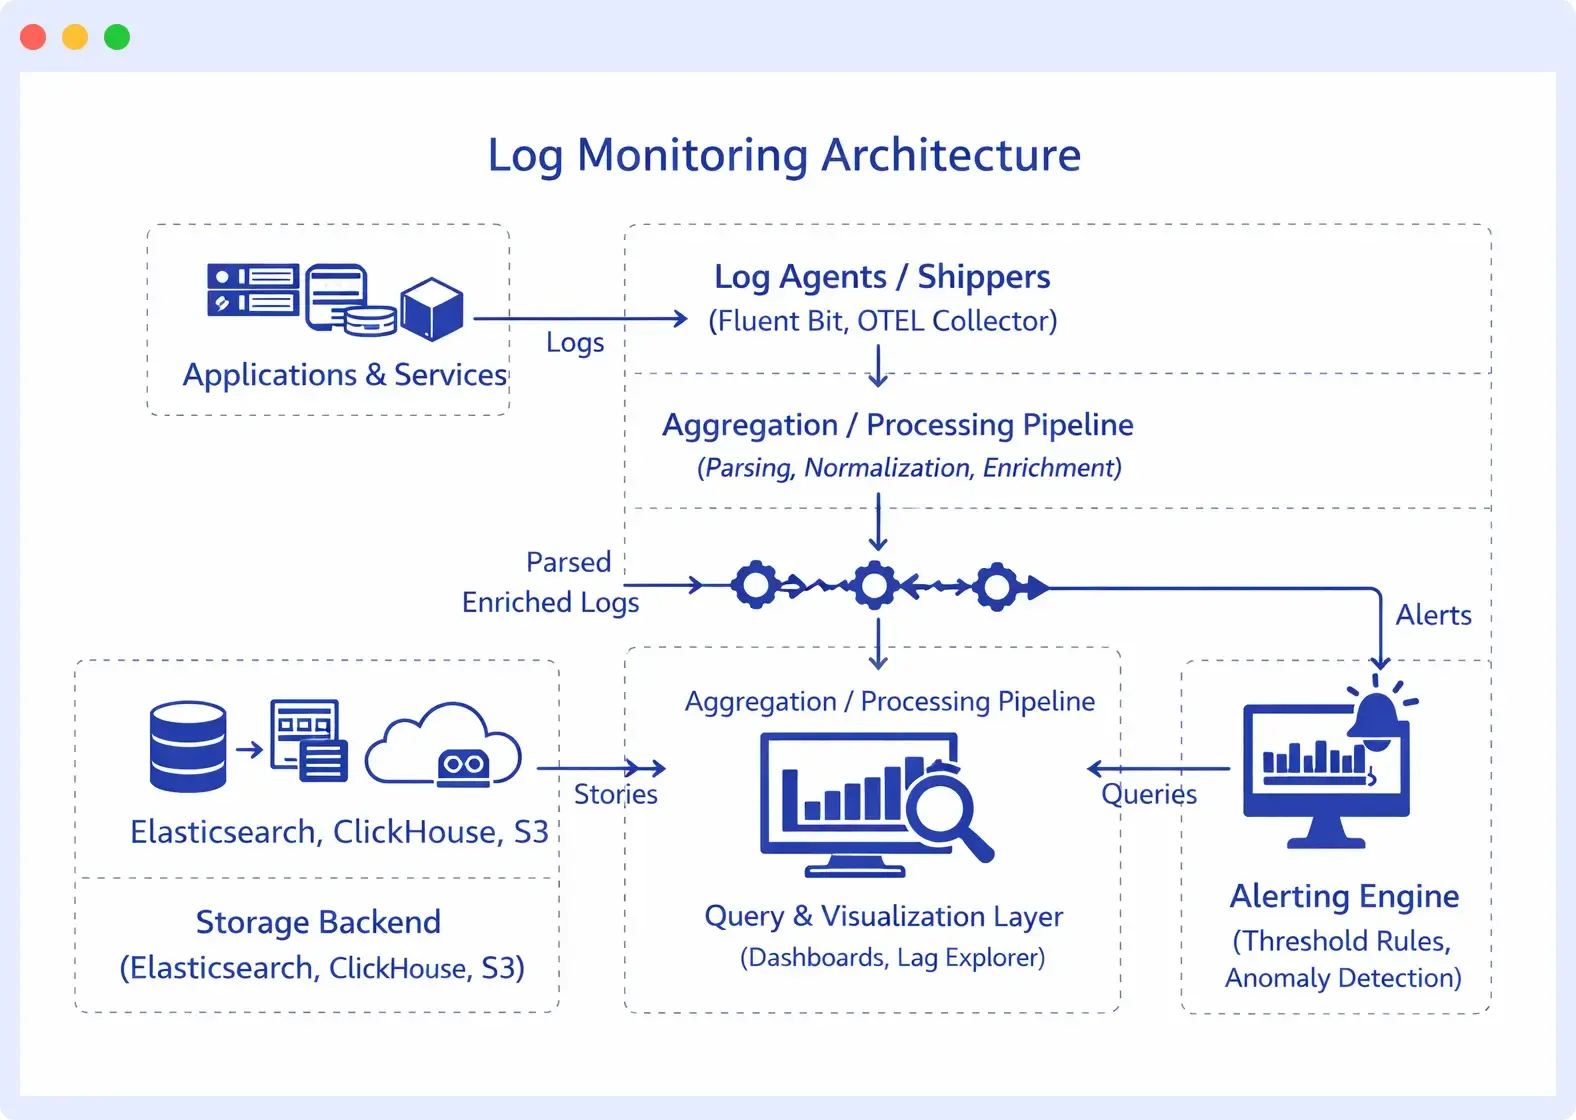
How Log Monitoring Works
Log monitoring follows a well-defined lifecycle from the moment a log entry is written until an engineer acts on it.
1. Log Generation Applications, operating systems, and infrastructure components write log data. In modern environments, this happens across hundreds of containers and services simultaneously.
2. Log Collection Agents (Fluent Bit, Logstash, the OpenTelemetry Collector) run alongside your services and ship logs to a central destination. In Kubernetes, this typically means a DaemonSet on every node.
3. Parsing and Enrichment Raw logs arrive in inconsistent formats. A parsing pipeline extracts structured fields from unstructured text, normalizes timestamps to UTC, and enriches records with metadata like environment (prod/staging), region, and pod name. Structured JSON logs make this step much cheaper.
4. Indexing and Storage Processed logs land in a storage backend optimized for search, typically, Elasticsearch or a columnar store. Indexing decisions made here directly affect query speed and storage costs.
5. Search and Analysis Engineers run queries to investigate issues: “Show me all ERROR-level logs from the payment service in the last 30 minutes” or “Which requests had latency above 2 seconds and came from this IP range?”
6. Alerting: Monitoring rules watch for specific patterns, thresholds, or anomalies. When a condition fires, say, more than 50 errors per minute from any single service, an alert routes to Slack, PagerDuty, or your on-call system.
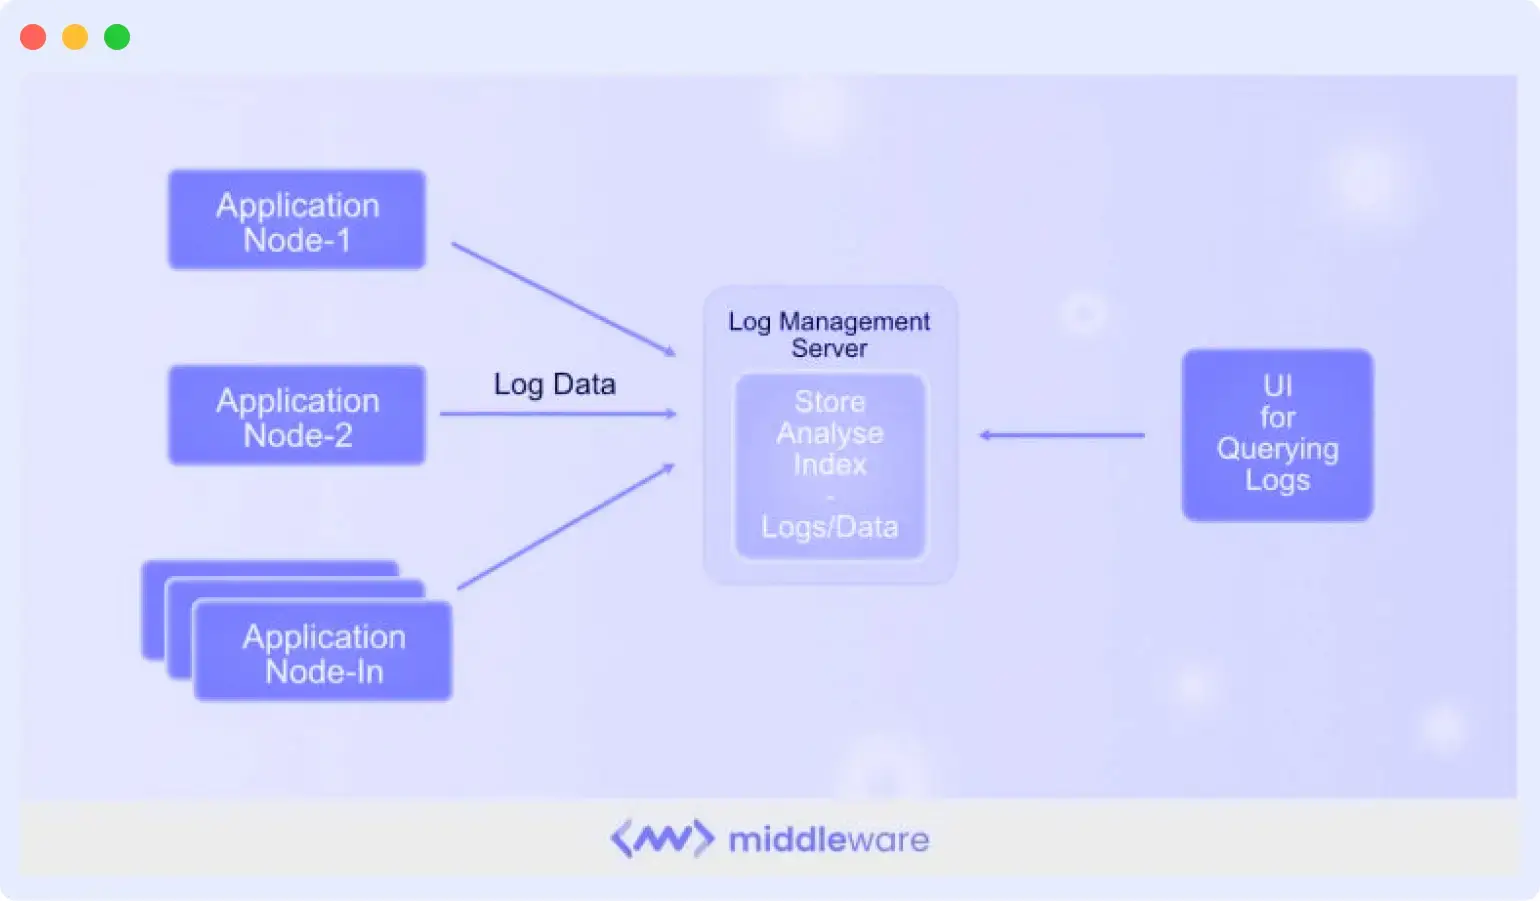
Log Monitoring Architecture
In a production environment, logs flow through multiple layers before they reach an engineer’s screen:
Centralized log monitoring is the goal here, pulling logs from every host, container, and cloud service into a single queryable system, rather than SSH-ing into individual servers. The moment your infrastructure spans more than a few nodes, decentralized log access becomes operationally unworkable.
Benefits of Log Monitoring
There are several benefits to log monitoring, including:
Faster incident detection and resolution: By analyzing logs in real time and triggering alerts for unusual patterns, engineers can detect failures early, reducing mean time to detection (MTTD) and mean time to resolution (MTTR).
Improved system visibility: Log monitoring provides a centralized view of activity across all these components, helping teams understand what is happening inside complex systems and correlate events across services.
Stronger security and threat detection: Logs record authentication attempts, access events, configuration changes, and unusual behavior. Monitoring these logs helps teams detect suspicious activity, such as repeated login failures, unauthorized access attempts, or abnormal traffic patterns, before they escalate into security incidents.
Better performance optimization: By understanding how systems behave over time, teams can optimize performance, allocate resources more effectively, and improve overall system reliability.
Compliance and audit readiness: Log monitoring helps maintain searchable audit trails that record user actions, system activity, and configuration changes, making it easier to meet compliance requirements such as GDPR, HIPAA, and PCI DSS.
Improved collaboration and operational efficiency: When incidents occur, teams can analyze the same data in real time, enabling faster decision-making during troubleshooting and post-incident analysis.
Common Log Monitoring Challenges
High volume and noise
A busy microservices platform generates tens of millions of log lines per day. The majority is routine INFO-level chatter. Building a signal out of that noise requires structured logging, log levels, and filtering at the collection layer, not after ingestion.
Alert fatigue
A misconfigured alert policy that fires every 5 minutes becomes useless immediately. Teams start ignoring alerts, and then miss the one that matters. Good log monitoring requires tuned baselines and anomaly detection, not just static thresholds.
Storage costs
Logs are expensive to store at scale. A realistic log monitoring strategy balances retention periods against cost, keeping hot, searchable storage for 7–30 days and cold archival for compliance. Not every log needs to live in an Elasticsearch cluster for six months.
Distributed system complexity
A single user request in a microservices architecture might touch 12 services. Correlating log entries across those services for a single transaction requires consistent trace IDs propagated through every hop, which requires discipline at the application level, not just the monitoring layer.
Log Monitoring Use Cases
Understanding what log monitoring is matters less than knowing what it actually helps you do. Here are the situations where teams lean on it most.
Application Debugging
Application debugging is the most common use case of log monitoring. For example, a user reports that checkout failed. But knowing the root cause of why the checkout failed is difficult without log data. With centralized log monitoring, you filter logs to that timestamp, narrow it to the payment service, and find the exact exception in under two minutes.
Cloud Infrastructure Monitoring
Log monitoring isn’t limited to application code. Load balancer logs may reveal unusual connection resets, while database logs can highlight queries that run for more than two seconds. Cloud providers may also record disk I/O saturation events on specific nodes. None of these appear in application logs, but they often explain why an application suddenly starts behaving unpredictably. Monitoring infrastructure logs alongside application logs provides a complete picture instead of only part of the story.
Kubernetes Troubleshooting
A pod keeps restarting, and nobody knows why. The application logs inside the pod are gone because the container died. But the kubelet logged an OOMKill event, and the container was terminated because it exceeded its memory limit. Kubernetes events captured the eviction. Without log monitoring at the cluster level, you’re guessing at a configuration problem that’s clearly documented in logs you weren’t watching.
Security Investigation
Someone is attempting to authenticate against your API from 47 different IP addresses over a 10-minute window. Each attempt generates a log entry. Without a monitoring log, you find out about it from a security audit weeks later. With alerting on the authentication failure rate, you’re notified as it happens.
Log monitoring is often the first line of intrusion detection for teams without a dedicated SIEM. Failed logins, privilege escalation attempts, and unusual data access patterns all leave traces in logs before they appear elsewhere.
Performance Monitoring
Your API response times degraded over the past week, but no alert fired because no single request was catastrophically slow. Looking at logs over time, you can see that database query latency crept from an average of 40ms to 280ms, gradual enough to miss threshold-based alerts but obvious in a trend view. Log monitoring over time reveals the patterns that point-in-time metrics miss.
Compliance and Audit Trails
A regulatory audit requires you to demonstrate who accessed sensitive customer data and when, over the past 90 days. If your access logs are centralized, searchable, and retained with appropriate controls, this is a query.
If they’re scattered across servers with inconsistent retention, it’s a project. Teams in HIPAA, PCI DSS, and SOC 2 environments often discover that their log monitoring infrastructure doubles as their compliance evidence layer.
Best Practices for Log Monitoring
1. Use structured logging
JSON-formatted logs with consistent field names are dramatically easier to parse and query than freeform strings. Define a logging schema and enforce it across services.
2. Log at the right level
DEBUG logs are for local development. Production systems should default to INFO, with DEBUG logging available on demand. Log everything at ERROR that represents a failure state.
3. Include context in every log line
Request IDs, user IDs, service names, and operation names turn a cryptic error message into an actionable alert. The log line should answer: what happened, where, in what context?
4. Set meaningful alerts, not maximum alerts
Alert on business-impacting conditions: error rate above baseline, latency SLO violations, failed authentication spikes. Avoid alerting on every single log-level event.
5. Correlate with a trace ID
Instrument your services to emit a trace ID on every request and include it in every log line. This is what makes root cause analysis tractable in distributed systems.
6. Define and enforce retention policies
Know how long you need logs for compliance, incident response, and debugging. Automate the lifecycle, so you’re not paying to store data you’ll never query.
Log Monitoring Tools and Key Features to Look for
When evaluating log monitoring tools, these capabilities matter most in practice:
- Centralized collection from heterogeneous sources (containers, VMs, cloud services, on-prem)
- Real-time ingestion and querying logs should be searchable within seconds of generation
- Full-text and structured search with fast filtering by service, severity, time range, and custom fields
- Anomaly detection to surface unusual patterns without requiring manual threshold configuration for every metric
- Alert routing with configurable severity levels and integrations with PagerDuty, Slack, and ticketing systems
- Dashboard visualization for operational health and trend analysis
- RBAC and audit controls for compliance environments (HIPAA, SOC 2, PCI DSS)
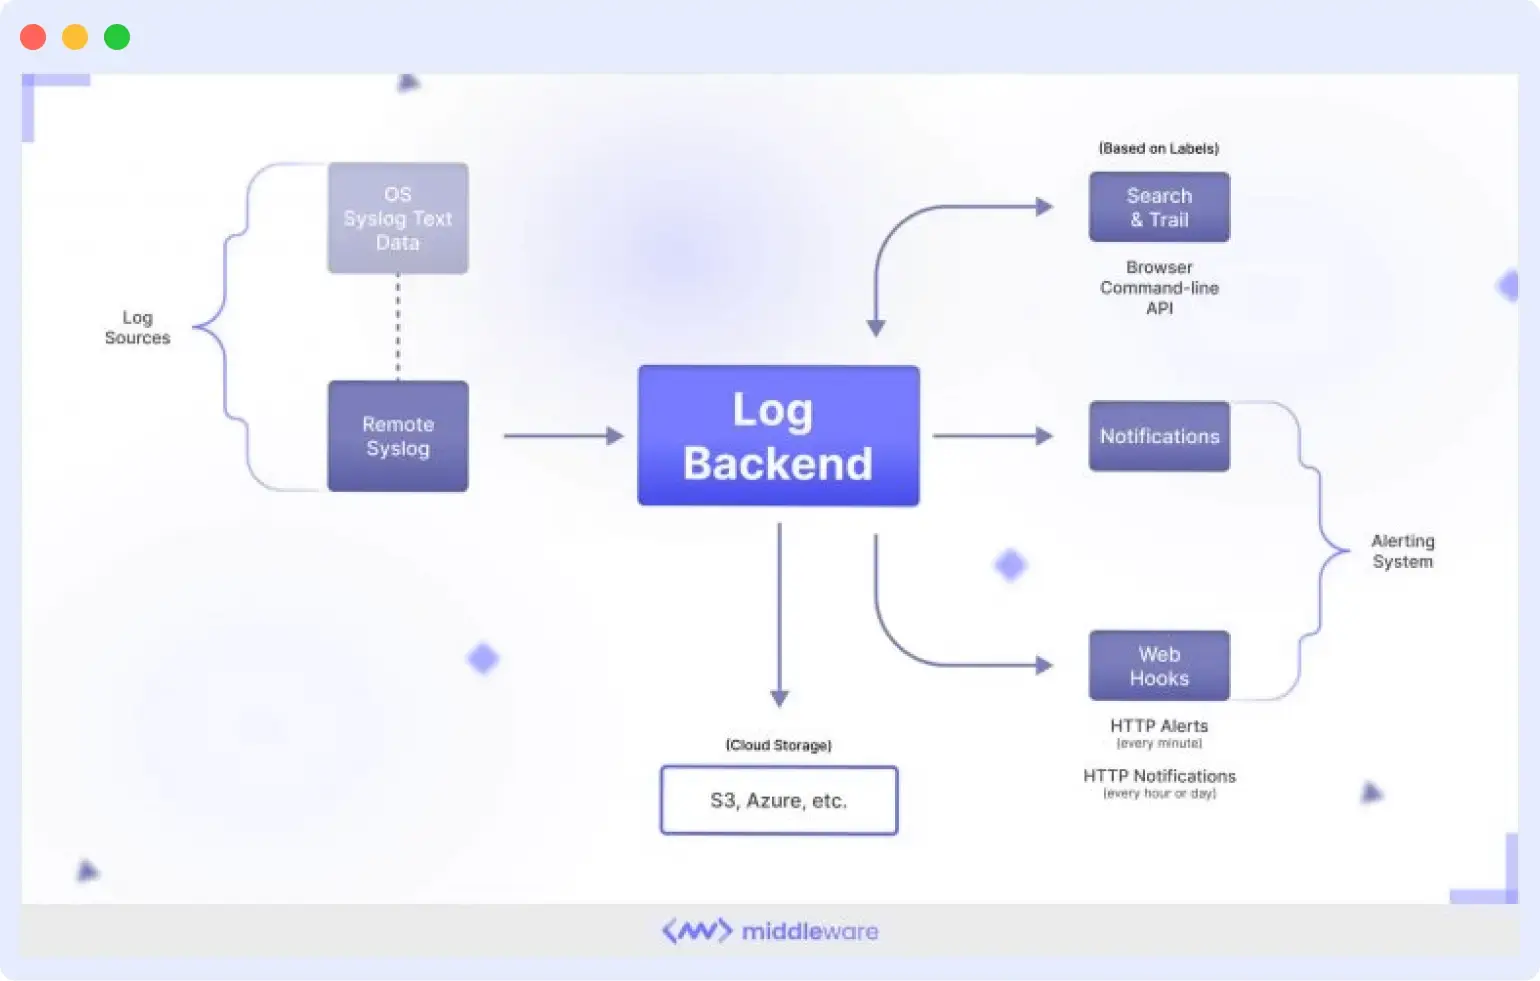
Log Monitoring vs. Log Management
These terms are often used interchangeably, but they describe different scopes.
Log management is the broader practice: how logs are collected, stored, retained, archived, and eventually deleted. It’s concerned with storage policies, compliance requirements, access controls, and data lifecycle. Log management asks: “Where do our logs live for the next 90 days?”
Log monitoring is a subset of log management focused on real-time analysis and alerting. It asks: “What is happening in our system right now, and should someone be notified?”
A team can have log management without log monitoring, storing logs to S3 for compliance without ever querying them in real time. But effective log monitoring requires good log management foundations underneath it.
Log Monitoring and Observability
Logs are one of the three pillars of observability, alongside metrics and distributed traces.
- Metrics show that something is wrong: CPU is at 95%, the error rate spiked to 8%, and p99 latency hit 3 seconds.
- Traces show where it’s wrong: the slow request traversed four services, and the bottleneck is in the inventory lookup.
- Logs tell you why it’s wrong: the inventory service logged “connection pool exhausted: max_connections=20, current=20” at the exact timestamp when your latency spiked.
Each signal is weakest in isolation. An effective observability platform correlates all three, so when an alert fires on a metric, you can click through to the relevant trace and then jump to the logs for that specific request. Platforms like Middleware are built around this correlation, letting teams monitor logs alongside metrics and traces in a unified view rather than switching between disconnected tools.
Log Monitoring in Kubernetes and Cloud Native Environments
Containers introduce a log monitoring problem that didn’t exist in the VM era: ephemerality. When a pod crashes and restarts, its local logs are gone. This makes container-native log collection non-negotiable; logs must be shipped off-node before the container dies.
In Kubernetes, the standard pattern is a logging DaemonSet (commonly Fluent Bit or the OpenTelemetry Collector) running on every node. It reads container logs from the node’s filesystem, enriches them with pod name, namespace, and labels, and forwards them to your centralized backend.
Kubernetes also generates its own valuable log sources: the control plane components (API server, scheduler, etcd), kubelet logs, and Kubernetes Events. Monitoring these alongside application logs is essential for diagnosing node-level failures, eviction events, and OOMKill incidents that application-level logs won’t surface.
For teams running multi-cluster or multi-cloud setups, the aggregation layer becomes critical; you need a single pane of glass across clusters, not one log system per cluster.
Collect & monitor logs that matter to you.
Try now
How Middleware Unlocks the Value of Log Monitoring
Most teams do not struggle with a lack of logs. The real issue is fragmentation. Logs exist, but they are spread across different services, stored in different log formats, and separated from the metrics and traces that provide useful context. Because of this, engineers often spend more time searching for information than actually solving the problem.
Middleware helps address that issue by bringing logs from your entire infrastructure into a single place. Application services, containers, cloud resources, and integrations are all collected in a single searchable interface. Instead of jumping between tools or matching timestamps across multiple dashboards, engineers can investigate issues from one view.
Middleware also uses anomaly detection to identify unusual patterns in log data. Instead of relying only on manually configured thresholds, the system learns what normal behavior looks like and highlights deviations.
Log search is designed to work quickly during real incidents. Engineers can filter logs by service, severity level, time range, or any structured field. This makes it easier to narrow down the exact moment when something went wrong and focus on the relevant events.
If your current troubleshooting process still involves logging into servers and searching through log files manually, Middleware’s free tier with 100 GB per month can be enough to centralize logs and see the benefits of a unified monitoring approach. Sign up for free to get real-time observability of logs.
FAQs
What is log monitoring?
Log monitoring is the process of analyzing system logs in real time to identify and resolve issues. It is essential for maintaining system and application availability, security, and reliability. This process includes detecting anomalies, pinpointing security threats, and monitoring performance metrics using log analysis tools.
Why is monitoring log important?
Log monitoring is crucial in managing IT operations and enables organizations to enhance system availability, security, and performance while minimizing downtime and business disruptions.
It is essential for troubleshooting, performance optimization, security threat detection, compliance adherence, and trend identification to predict and prevent future issues.
What are the three different kinds of logs?
- Availability logs: Used to monitor system performance, uptime, and availability.
- Resource Logs: These logs contain information on connectivity issues and capacity limits.
- Threat logs: These logs contain information about system, file, or application traffic that matches a firewall’s predefined security profile.
What are the best log monitoring tools?
Many log monitoring tools are available in the market, and the right one for you depends on your specific needs and preferences. Some popular options include Datadog, Middleware, Elastic, Splunk, and Graylog.