Java is a pioneer programming framework. In 2022, Java ranked sixth among all programming languages used by developers. In fact, Java was used by 35.35% of developers to create solutions and applications. Java is still ranked third among programming languages in TIOBE’s index for April 2023 with a 12.96 grade.
Java is widely used in the development of web applications and other software. As with any software, it’s important to monitor java applications to ensure they are running efficiently and effectively.
In this article, we go in-depth on Java application performance monitoring (APM); we discuss its significance, use cases, best practices, and tools you can use to monitor the performance of your Java applications.
What is Java performance monitoring?
Java performance monitoring is the process of tracking the performance of a Java application or system in order to identify and resolve issues that may be affecting its performance. By monitoring various metrics such as CPU usage, memory usage, and response times, it is possible to identify performance bottlenecks and other problems that may be causing the application to run slowly or crash.
Why is Java performance monitoring important?
For maximum performance, evaluating and improving your Java applications is crucial. As mentioned before, Java programs that run poorly have serious repercussions. However, you can only analyze and improve what you can see. Therefore, java performance monitoring is the cornerstone of a stable and dependable Java application.
Poorly optimized code, ineffective algorithms, and a lack of hardware resources are some of the things that might cause Java to run poorly. Monitoring enables you to identify what succeeds and fails and iterate and fix problems before they become serious.
Traditional vs. New ways to monitor Java performance
Java performance monitoring is not new. There are traditional and contemporary java APM approaches. Traditional Java APM technologies are intrusive, and use static instrumentation to gather metrics through statically specified tracepoints.
This has several ramifications, however. To add the user marks, you must first have access to the source code. Second, the evolution of the code base requires that user markers be maintained over time. In either scenario, recompilation is needed to activate the pre-defined marker.
But the tides have changed. There are now more effective ways to execute java APM, with the eBPF-based method being the most effective.
eBPF is a non-intrusive framework to monitor java application performance. It employs dynamic instrumentation through user-level dynamic tracing. Dynamic tracing lets you trace any software function in a running binary without restarting it.
The eBPF framework allows you to execute programs to exfiltrate monitoring data within the application without altering the source code. Java APM with eBPF is very secure, isolated, and can be exported to centralized platforms. This enables eBPF-based observability tools to provide a great deal of visibility, accuracy, and granular details of your java application.
Additionally, an eBPF based Java APM program runs in a sandbox environment, ensuring machine resources do not get saturated.
Five ways to improve java application performance
Five of the most effective approaches to improve the performance of a java application are:
1. Get started with code profiling
Systematic code profiling is a direct approach to isolate inefficiencies and regressions in the code. Profiling the Java code helps you identify slow performing areas in the Java virtual machine (JVM) system. Additionally, you can install profiling software with live code profiling components to overcome the hassles of manually profiling the codebase.
2. Avoid recursion
Recursion is a systematic method for breaking a big issue into several more minor, repeatable issues. Recursion is a technique that can be quick and effective in languages that provide tail call optimization. Java, however, is not one of these languages. Recursion is hence an expensive procedure. In most cases, you should choose an iterative solution utilizing loops over a recursive solution with Java.
3. Spot Java log errors with tracing
Java logs assist with error tracking. The Logging API, which was first available in Java 1.4 keeps them in a log file controlled by the Logging API. However, these logs are equally prone to errors because there are numerous logging frameworks. Tracing made it easier to find these issues in the Java logs. Hence, tracing is the guiding principle of Java’s error detection.
Tracing identifies an error’s primary source and ensures all problems are fixed. The most popular method for tracing is to use effective software. Effective tracing software tracks the transactions back to their origins in the log data. Numerous out-of-the-box tracing solutions exist, but only a tiny percentage are effective. For instance, Middleware aids in tracking down transactions and reporting their status, latency, total hits, and many other data significant for the prompt and efficient resolution of errors.
4. Leverage StringBuilder
Java offers a bewildering array of options for combining shorter strings into longer ones, but most of these options follow a two-sequence approach to buffering a string into a long thread, adding significantly to the Java heap. Because of this, memory duplication is required when an operator is initialized. Java has Stringbuilders that employ a one-sequence approach.
The StringBuilder is a mutable asynchronous function that provides a string-like class that allows you to initialize an operator in a single sequence. StringBuilder doesn’t have any overhead from thread synchronization and is, therefore, the fastest way to build large strings from smaller pieces.
5. Find and fix performance bottlenecks
The garbage collection system is the source of most performance issues. However, If the Java heap is too big, it must be stored outside the main memory. The higher paging activity impacts Java performance.
A sizable Java heap can also take a long time to fill up. This means that even though garbage collection happens less frequently, garbage collection pause times grow. You can enhance the performance of your Java program by correcting issues like these.
Another option to enhance the efficiency of your Java program is to use efficient techniques and tools while analyzing java logs. Finding the most frequent exceptions is a powerful technique. Most logging frameworks keep track of the exception’s type, message, and manner of occurrence.
Numerous solutions can graph and categorize exceptions by the number of occurrences if your logs are already parsed and stored. For instance, grep can discover exceptions based on type or class. The majority of log management solutions can offer ways to organize and search log entries by log type, message content, class, method, and thread.
Java performance monitoring using Middleware
Middleware uses the new eBPF-based approach to monitor your java applications. It collects java metrics with no interference, operates in a sandbox environment, and unifies all artifacts into a single APM dashboard. To configure your java application for monitoring with Middleware, follow these three steps:
- Install the Middleware Host agent. You can install the agent on Kubernetes, Ubuntu, and Docker.
- Download the jar files.
- If you want to add custom logs include our logging library in the pom.xml file
For comprehensive details on how to configure your Java application for monitoring with Middleware, follow this Java APM document.
How Middleware does Java APM
Middleware collects Java metrics with no interference, operates in a sandbox environment, and unifies all artifacts into a single APM dashboard.
Middleware has customized the OTEL Java Instrumentation project using its extension feature. It supports libraries and frameworks like Apache Dubbo, Apache Kafka, AWS lambda, Azure core, and several other libraries and frameworks.
After collecting application-level information, Middleware adds machine-level information to the data for easy filtering. This allows you to get clear bifurcation when monitoring your application across different machines.
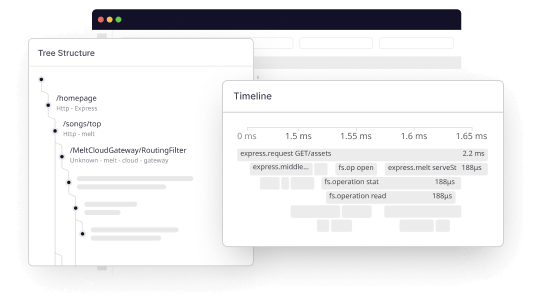
Middleware’s APM dashboard allows you to search, filter, and analyze Java traces. You can also auto-detect problems and issues with the AI-based auto-alerting system of Middleware for Java applications.
To configure your Java application for monitoring with Middleware, follow this document.
5 Best Java performance monitoring tools
A variety of tools offer Java APM. Here we will take a look at the 5 best java performance monitoring tools.
We selected these tools based on their features, ease of use, and overall effectiveness in helping to improve the performance of Java applications.
Whether you are a developer looking to troubleshoot issues with your code or an SRE responsible for maintaining the performance of a production system, these tools can provide the insights and data you need to identify and fix performance issues:
Middleware
Middleware is a java APM tool that employs the eBPF approach to ensure you get granular visibility into your java operations. Its auto-alerting features ensure that no problems go undetected, and its machine-level filtering enables you to locate the source of issues and quickly resolve them.
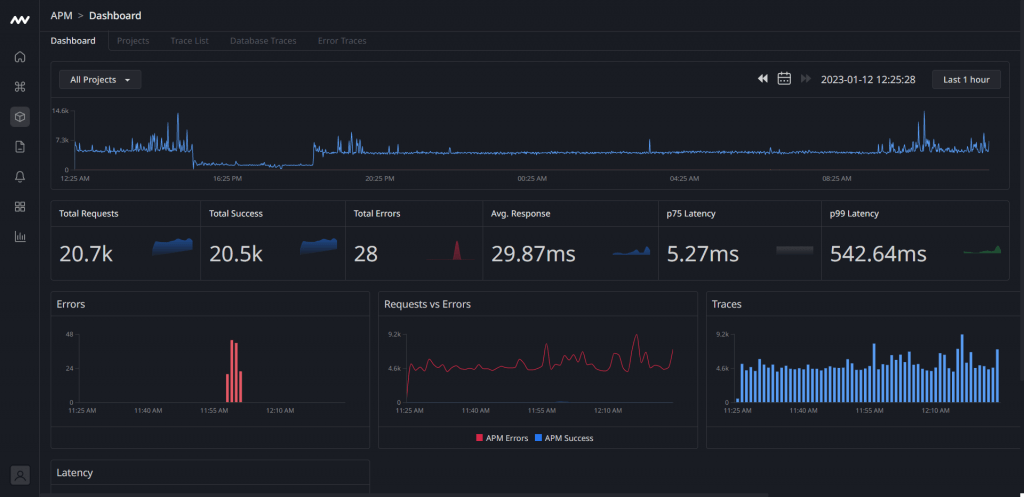
The unified dashboard with Middleware shows all core and necessary operations in one location. You can start using middleware for free and pay as your needs increase.
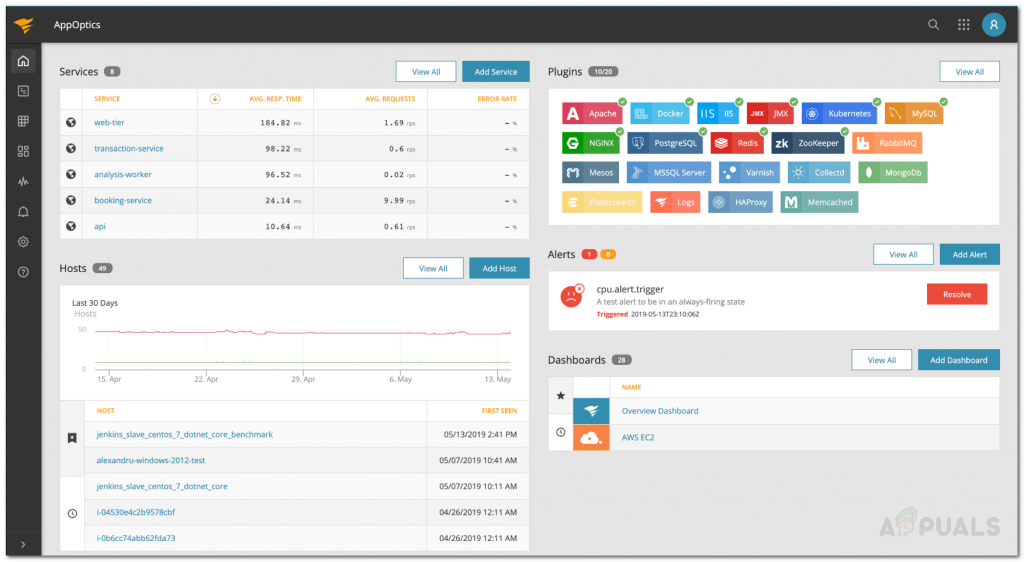
SolarWinds AppOptics
AppOptics provides distributed tracing, personalized and pre-configured metrics and alarms, and easily programmable dashboards. With built-in capabilities for numerous other coding frameworks and libraries, such as .NET, PHP, Python, and more, you can gather performance metrics, and complete transaction traces with AppOptics.
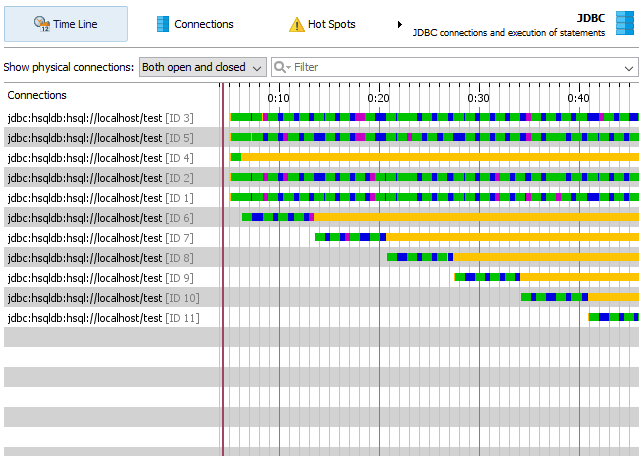
JProfiler
JProfiler concentrates on memory and storage. This Java Application performance monitoring tool aids in finding memory leaks, which helps to address storage and memory-related issues. Its intuitive user interface makes understanding threading problems easier. Application server integrations and IDE integrations are abundant in JProfiler.
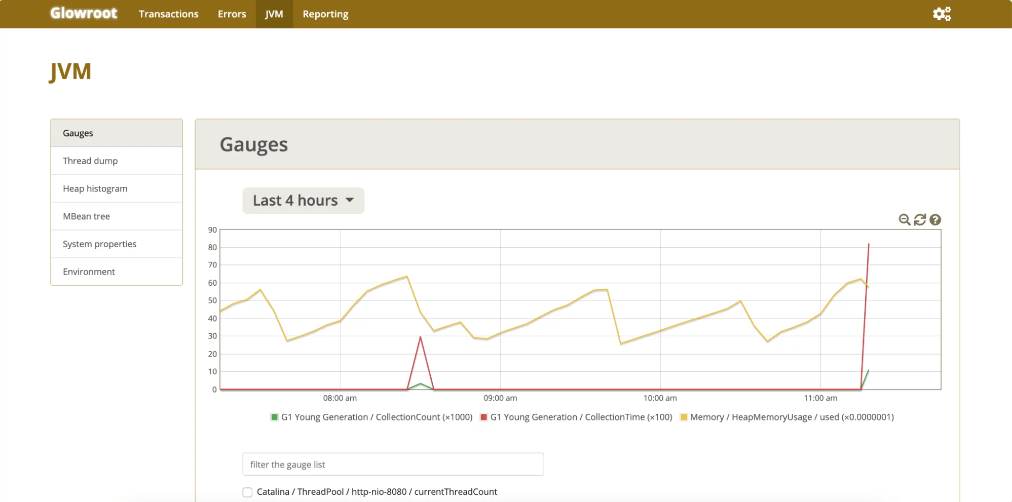
Glowroot
Glowroot is a quick, spick-and-span, and simple-to-use open-source Java APM solution. Thanks to its interactive user interface, you can monitor your Java program from desktop and mobile devices. It supports SQL catch, aggregation, log time follow for each user action, and tracing to capture slow requests and errors. The application also offers charts to show time breakdown and reaction time percentiles, as well as a historical roll-up of all information with configurable maintenance.
Eclipse Memory Analyzer
Eclipse Memory Analyzer enables you to precisely track memory usage, spot memory leaks, and fix OutOfMemoryError. The tool examines productive heap dumps to provide information on the relative sizes of kept objects, which is another important function. You can examine heap dumps using the Memory Analyzer tool even while millions of elements flow through. You can also define object retention sizes to guarantee that the garbage collector removes the right things from the heap.

Conclusion
Java application performance monitoring is vital to the smooth running of your java application. It enables you to find and resolve issues quickly.
To improve the performance of your java application, install code profilers with code-level profiling capabilities, avoid recursion, trace, and find and fix performance bottlenecks.
In this article, we have seen how Middleware executes java APM and other tools available on the market for the same purpose.
Sign up now on Middleware to start Java application performance monitoring for free.